


Introduction
Globally, the livestock sector shares 40 and 20% from developed and developing countries, respectively, in agriculture production. Indian agriculture relies on livestock, with a 482 million cattle population and accounting for 15% of the world's cattle population. It has the world's largest cattle population, followed by Brazil and China. In India, a larger area is used to produce food and cash crops, while a very less arable land is available for fodder production. It has been reported that the demand for forage sorghum in India is expected to be 855 MT green fodder yield (GFY) and 526 MT dry matter yield (DMY), which is against the current demand of 666 MT GFY and 138 MT DMY showing a huge gap between demand and supply. This is one of the prime reasons why fodder production is so crucial in today's agriculture (Dikshit and Birthal, Reference Dikshit and Birthal2010; Dhaliwal et al., Reference Dhaliwal, Sandhu, Shukla, Sharma, Kumar and Singh2020).
Sorghum (Sorghum bicolor (L.) Monech; 2n = 20) is the world's fifth most important cereal crop that supplies both feed and fodder (Doggett, Reference Doggett1988; Suvarna et al., Reference Suvarna, Salimath, Upadhya, Lokesha, Nidagundi, Patil and Patil2020). The Indian subcontinent is considered as the secondary home of sorghum origin (Vavilov, Reference Vavilov1926). Harlan and De Wet (Reference Harlan and de Wet1972) classified the cultivated sorghum into Bicolor, Caudatum, Durra, Guinea and Kafir inter-fertile races and 10 intermediate races based on the floral morphology. Sorghum includes a diverse range of annual to perennial types (Tariq et al., Reference Tariq, Akram, Shabbir, Gulfraz, Khan, Iqbal and Mahmood2012; Bibi et al., Reference Bibi, Zahid, Sadaqat and Fatima2016). Sorghum has significant specific end-use, which are categorized as grain, bio-energy and as forage. Due to high biomass production with quality forage under limited water regimes, sorghum is considered as the main source of green forage and roughages for livestock in tropical areas. Forage sorghum has 8–12% crude protein, 60–75% neutral detergent fibre and 34–40% acid detergent fibre on the dry matter basis and shows high digestibility and palatability (Undersander et al., Reference Undersander, Smith, Kaminski, Kelling and Doll1990).
The USDA estimates projected that the global sorghum area was 40.97 Mha in 2020–21, with a production of 59.76 MT. However, in India sorghum was cultivated in 4.80 Mha area with 4.40 MT production. The USA ranks first in sorghum production (9.27 MT) followed by Nigeria (6.86 MT), Sudan (4.95 MT), Ethiopia (8.31 MT) and India (8.09 MT) with share contribution of 15.62, 11.56, 8.35, 8.31 and 8.09%, respectively (USDA, 2021). India ranks third in area and fourth in sorghum production. In the northern region of India, sorghum is grown as Kharif crop (July to October), while in southern part, this crop is cultivated in both Rabi (November to March) and Kharif (July to October) season. Sorghum can withstand harsh climatic conditions compared to other cereal crops such as maize, rice and wheat, which makes it a climate-resilient crop. The major forage sorghum-growing Indian states are western Uttar Pradesh, Haryana, Punjab, Rajasthan and Delhi (Panday and Roy, Reference Panday and Roy2011).
Sorghum is susceptible to many diseases such as stalk rot, downy mildew, grain mould, rust, head smut, leaf blight, zonate leaf spot (ZLS) and anthracnose, which are responsible for substantial losses around the globe (Rao et al., Reference Rao, Reddy, Nagaraj, Upadhyaya, Wang, Upadhyaya and Kole2015; Mengistu et al., Reference Mengistu, Shimelis, Laing and Lule2019). Foliar disease causes a considerable fodder and grain losses up to 30–60% due to a decrease in photosynthetic leaf area. The ZLS disease caused by Gloeocercospora sorghi is considered as the most destructive disease of sorghum in central India; this region is also known as a hot spot for this disease. The characteristic symptoms of ZLS disease include an initially small brown specks that appear on the leaf, as the disease progresses they become circular to semi-circular spots, which are close to leaf margin. The colour varies from purple, red and tan, forming a characteristic concentric ring or zonate appearance (Palakshappa and Hiremath, Reference Palakshappa and Hiremath2003; Purohit et al., Reference Purohit, Singh, Bisht and Srinivasaraghavan2013). Elongated dark purple spots were also observed on the leaf sheath and stem, which brightened the entire plant. The ZLS disease causes huge yield losses, which is up to 38% in susceptible sorghum cultivars (unpublished data). Management of this disease is mostly carried out through fungicides, which may cause toxicity in animals, so the chemical disease management is less eco-friendly. Host-plant resistance has been the most economical, safest method of disease management in crops including sorghum.
Therefore, more emphasis is needed on forage production to support the livestock growth and reproduction. For this, we need a strong breeding programme on forage sorghum through which we could find the promising forage genotypes having high biomass and biotic stress resistance. As we know that, progress in any breeding programme depends on the genetic diversity present in the material. This means that it is imperative to exploit the variability found in the population and selection of elite genotypes. In the present experiment, phenotypic diversity correlation association among various agro-morphological traits in sorghum were evaluated, and an effort was made to identifying the potential source of resistance to ZLS diseases based on diverse and superior forage genotypes. These selected higher biomass and ZLS disease resistance lines could be used as potential source of donor in future sorghum breeding programme.
Materials and methods
Plant material
The experiment was conducted at the Experimental Farm of Indian Grassland and Fodder Research Institute, Jhansi, Uttar Pradesh (UP), during two successive wet seasons of 2019 and 2020. Jhansi lies in Bundelkhand region of UP at latitude and longitude of 25.4484°N and 78.5685°E. It has hot and semi-humid climatic conditions. A total of 108 accessions including indigenous collection (57) from Uttar Pradesh, Tamil Nadu and Madhya Pradesh, while exotic accessions (48) from Canada including three cultivars as checks (MP Chari, CSV-21-7 and CSV-31-F) were used in the present study (online SupplementaryTables S1(a) and S1(b) and Fig. S1).
Sorghum accessions were collected during the years 2002, 2003 and 2005 from 17 districts of northern, central and south Indian states of the country belonging to Chhattisgarh (1), Uttar Pradesh (33), Madhya Pradesh (22) and Tamil Nadu (1). The material for present experiment was procured from the mid-term storage unit, ICAR-IGFRI. The 108 sorghum accessions including three cultivars as checks were sown in augmented randomized block design (Federer, Reference Federer1956) with three replications. The single row length was 3 m and 30 cm row-to-row spacing was maintained in field conditions. All the recommended package of practices for growing sorghum were followed to raise good plant stand.
Agro-morphological traits evaluation
Six qualitative (early plant vigour, plant growth habit, node pigmentation, leaf pubescence, panicle colour and panicle density) and 13 quantitative observations (days to 50% flowering (DTF), plant height (PH) (cm), number of leaves per plant (NLP), leaf length (LL) (cm), leaf width (LW) (cm), panicle length (PL) (cm), stem girth (SG) (cm), stem weight per plant (SWP), leaf weight per plant (LWP) (g), leaf: stem ratio (LSR), GFY (g), DMY (g) and days to maturity (DTM)) were recorded on five randomly selected plants to examine the extent of genetic diversity present in the material. The PH, NLP, LL, LW and PL were measured manually with the help of scale, while the GFY, DMY, LWP, SWP and LSR were measured with the help of electronic weighing machine. The leaf pubescence, panicle colour, panicle density, node pigmentation, vigour and growth habit were recorded visually.
Epiphytic screening of zonate leaf spot disease
The ZLS (G. sorghi) disease reaction under natural epiphytic condition was evaluated during two consecutive wet seasons of 2019 and 2020 at ICAR-IGFRI, Jhansi (UP). The severity of disease was recorded on five plants at soft dough stage by using the following 1–9 scale rating (Thakur et al., Reference Thakur, Reddy and Mathur2007).

Data analysis
The mean data were subjected to analysis of variance (ANOVA) following the procedure of augmented design by using INDOSTAT package to access the significance of experiment and statistical analysis. The correlation between traits was conducted and compared against table r-value at n-2 degree of freedom at the probability level of 0.05 and 0.01 to evaluate their significance (Panse and Sukhatme, Reference Panse and Sukhatme1961). Dendrogram and principal component analysis (PCA) were performed using the statistical software StatistiXL version 2.0. The statistical analysis was conducted with data recorded on six qualitative and 13 quantitative traits to examine the extent of variability present in the experimental material. The Shannon–Weaver index (Reference Shannon and Weaver1949) of diversity (H’) was computed for each qualitative trait from frequency distribution observed for distinct categories of traits. K-means cluster analysis was constructed (R-software, version 4.2.2) by keeping cluster size, k = 3 to compute the clusters between GFY and other yield-contributing quantitative traits.
Results
Qualitative traits
The frequency of six qualitative traits including descriptors was shown in Table 1. The maximum frequency percentage of early plant vigour was observed in good (50%) scale. In case of plant growth habit, most of genotypes were erect type (99.07%). Node pigmentation exhibited two categories of green and purple colour with 80.56 and 19.44%, respectively. Under leaf pubescence, the sparse type (50.93%) contributes the maximum followed by intermediate types (37.96%). Experimental results indicated the pale green colour panicle (59.26%) followed by green colour panicles (40.74%). The studied experimental material exhibited maximum variation for panicle density in which majority were very loose erect primary branches type followed by loose and erect primary branches type with 35.19, 23.15 and 12.96%, respectively. The Shannon's diversity index ranged from H’ = 0.05 (plant growth habit) to H’ = 1.76 (panicle density).
Spectrum of variability observed in six qualitative traits of 108 sorghum genotypes

SDI, Shannon's diversity index.
Quantitative traits
Analysis of variance and descriptive statistics
ANOVA (Table 2) of quantitative traits showed that the mean sum of square (MSS) due to block was highly significant/significant (P ≤ 0.01 and 0.05) for all the traits except for PL and DTM. Likewise, the MSS due to treatment was also significant for most of the measured traits except for DTM. The interaction among germplasm, checks and check vs germplasm also showed highly significant and significant (P ≤ 0.01 and 0.05) variance for the measured traits, while non-significant for DTM. Table 3 showed the spectrum of variability observed for 13 quantitative traits in 108 sorghum genotypes. Among all the traits, SWP, GFY, DMY and LWP showed more variations for various variability parameters as compared to the other traits.
Analysis of variance for 13 quantitative traits among 108 sorghum genotypes
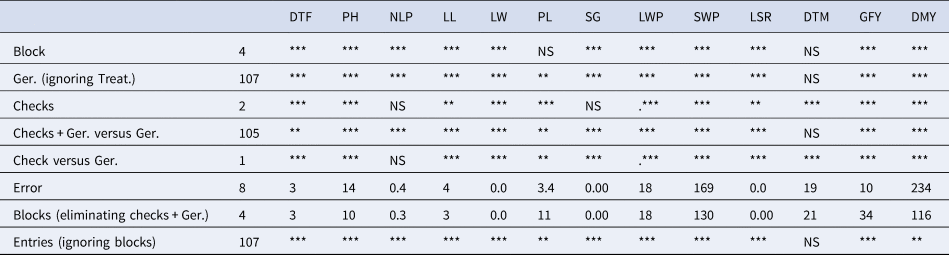
DTF, days to 50% flowering; PH, plant height; NLP, number of leaves per plant; LW, leaf width; PL, panicle length; SG, stem girth; LWP, leaf weight per plant; SWP, stem weight per plant; LSR, leaf: stem ratio; DTM, days to maturity; GFY, green fodder yield; DMY, dry matter yield; Ger., germplasm; T, treatments; NS, non-significant.
** Significant at the 5% and ***highly significant at the 1% levels.
Variability parameters observed for 13 quantitative traits in 108 sorghum genotypes

DTF, days to 50% flowering; PH, plant height; NLP, number of leaves per plant; LW, leaf width; PL, panicle length; SG, stem girth; LWP, leaf weight per plant; SWP, stem weight per plant; LSR, leaf: stem ratio; DTM, days to maturity; GFY, green fodder yield; DMY, dry matter yield.
Value mentioned as mean ± SE.
Trait correlations
Correlation is a measure of strength of linear relationship among the traits. The analysis was conducted to understand the correlation among 13 quantitative forage yields and their contributing traits. Results revealed that (online Supplementary Table S2) at genotypic levels, the GFY was positive and significantly correlated with SWP and GFY (r g = 0.99) followed by LWP and GFY (r g = 0.96). Among the other morphological traits, the highly positive correlation was observed among LWP with SWP (r g = 0.95), GFY with DMY (r g = 0.84), DM with DTF (r g = 0.87) and SG with GFY (r g = 0.83). Whereas, the negative correlations were observed among PL and LSR (r g = −0.40), PL and DTM (r g = −0.24), PL and LW (r g = −0.18) and PH and LSR (r g = −0.13).
Cluster analysis
K-means cluster analysis is the act of grouping data points so that they can be compared to one another and to data points belonging to diverse groups while supporting their similarities to other members of the same group. The various K-means clustering patterns between GFY (y-axis) with other quantitative traits (x-axis) and their respective mean (denoted as circle) are shown in Fig. 1(a–l). These three clusters showed the lower, moderate and higher categories for each individual trait (Fig. 1(a–l)). In these clusters, cluster III is desirable as it shows the higher mean values for quantitative traits along with higher GFY potential.
K-mean clustering diagram of association between green fodder yield and other yield-contributing traits of forage sorghum (K = 3). DTF, days to 50% flowering; PH, plant height; NLP, number of leaves per plant; LL, leaf length; LW, leaf width; PL, panicle length; SG, stem girth; LWP, leaf weight per plant; SWP, stem weight per plant; LSR, leaf: stem ratio; DTM, days to maturity; GFY, green fodder yield; DMY, dry matter yield.

K-mean clustering for DTF with GFY showed different genotypes categorized under lower (cluster I), medium (cluster II) and higher cluster (cluster III). Out of 108 genotypes, eight sorghum genotypes fall under cluster III with >90 days and GFY >500 g/plant (Fig. 1(a)). Similarly, for PH, nine genotypes fall under cluster III and show PH >350 cm and high GFY (Fig. 1(b)). In Fig. 1(c), K-mean clustering for NLP and cluster III showed >15 leaves in seven genotypes along with high GFY potential. For leaf length (LL), 10 genotypes showed >85 cm LL and were categorized under cluster III (Fig. 1(d)). Similarly, for LW trait, 20 genotypes showed higher LW (>8 cm) and were grouped under cluster III (Fig. 1(e)). Genotypes having maximum PL (>25 cm) with high GFY were grouped under cluster III and 24 genotypes followed this trend (Fig. 1(f)).
K-mean clustering for stem girth showed that seven genotypes having SG > 1.87 cm and high GFY (>500 g/plant) grouped under cluster III (Fig. 1(g)). Five genotypes with LWP >98 g/plant were grouped under cluster III (Fig. 1(h)). LSR >0.23 was used for the indication of higher K-mean clustering and 24 genotypes were grouped under cluster III (Fig. 1(i)). For DTM, 16 genotypes showing late maturing (130 days) behaviour and having high GFY potential were grouped under cluster III (Fig. 1(j)). Likely, for DMY, 23 genotypes having DMY >150 g/plant were grouped under cluster III (Fig. 1(k)).
Dendrogram constructed based on morphological traits using squared Euclidean distance and group average clustering method is shown in Fig. 2. Four groups (cluster I–IV) showed existence of considerable diversity among sorghum accessions but did not show any correlation with geographic occurrence of accessions. All exotic lines fall under both the clusters along with other indigenous genotypes. Clusters I (IG-03-340), III (EC-507822) and IV (EC-507787 and EC-512364) are showing diversity to cluster II which includes remaining 104 genotypes and checks. However, MP Chari tends to show more diversity towards cluster III. In the dendrogram, clusters I, III and IV are totally diverse from each other.
Dendrogram showing 108 sorghum accessions in different clusters.

Principal component analysis (PCA)
The PCA helps in identifying the key traits that contribute to the maximum variation and predicting the important traits that influence the clustering of germplasm (Akatwijuka et al., Reference Akatwijuka, Rubaihayo and Odong2016). PCA based on 13 quantitative traits and the contribution of PC1, PC2 and PC3 was shown in online Supplementary Table S3. According to the PCA, the first principal component (PC1) explained 52.7% of the total variance, contributed mainly by GFY, LWP, SWP, SG, DMY, LW and NLP. While the PC2 and PC3 accounted for 16.2 and 10.2% of total variation mainly contributed by PL, respectively (Fig. 3).
Clustering pattern of 108 sorghum accessions showing principal component analysis.

Zonate leaf spot screening
Based on the ZLS severity, five accessions were found resistant (score 2–3 on 1–9 scale), 26 accessions were moderately resistant (score 3.1–5), 56 were susceptible (score 5.1–7) and 18 were highly susceptible (score >7) compared to a 7.9 score for susceptible check MP Chari (online Supplementary Fig. S2 and Table S4). None of the accessions were found to have highly resistant reaction. Five genotypes viz., EC-512397, EC512393, EC512394, EC512399 and IG-02-437 were identified as potential donors for resistance to ZLS disease during two consecutive Kharif seasons (2019 and 2020) under natural infection condition (online Supplementary Fig. S3).
Discussion
The descriptive statistics of 13 agro-morphological traits showed the existence of morphological diversity among the forage sorghum genotypes, providing the scope for genetic improvement through further selection and hybridization breeding programme. The results indicated that the majority of genotypes were classified as early plant vigour, an important trait for healthy growth and generally associated with the higher vegetative growth (Verma et al., Reference Verma, Ranwah, Bharti, Kumar, Kunwar, Diwaker and Meena2017). Similarly, most genotypes were erect types which is also a desirable trait in forage sorghum. For panicle density, a lot of diversity was present, which is important information for targeted breeding programmes. For example, the loose type panicle is desirable for forage, whereas the compact type is suitable for grain production and semi-loose for dual purpose (Chand et al., Reference Chand, Dikshit, Gomashe, Elangovan and Samdur2017).
The correlation analysis showed that GFY was positive and significantly correlated with most of the agro-morphological trait studies such as PH, NLP, LL, LW, SG, LWP and SWP (Jain et al., Reference Jain, Elangovan and Patel2010; Bibi et al., Reference Bibi, Zahid, Sadaqat and Fatima2016; Khurd et al., Reference Khurd, Kadam, Chavan and Dahat2018; Rohila et al., Reference Rohila, Arya, Kumari and Pinki2019; Subalakhshmi et al., Reference Subalakhshmi, Selvi, Kavithamani and Vadivel2019; Suvarna et al., Reference Suvarna, Salimath, Upadhya, Lokesha, Nidagundi, Patil and Patil2020). However, DTM was found to be negatively associated, confirming previously published results (Sinha and Kumaravadivel, Reference Sinha and Kumaravadivel2016; Karthikeyan et al., Reference Karthikeyan, Babu and Amalraj2017; Patil et al., Reference Patil, Kalpande and Thawari2022; Verma and Biradar Reference Verma and Biradar2022). These agromorphological traits are associated with the improved source-sink capacity and higher assimilation rate. Strong positive correlations suggest that they are heritable and therefore informative for future forage sorghum improvement programmes.
From the clustering pattern, some genotypes were defined as late maturing, tall and with high SG, NLP, LWP, LW, PL, SWP, GFY and DMY. This indicates that forage genotypes showing higher GFY with other improved traits are more desirable and have better resource use efficiency. Based on K-mean clustering analysis as well as overall performance, three genotypes viz., IG-03-424, IG01-436 and IG-03-438 were identified as promising for higher GFY and DMY during both the growing seasons. These types of association between GFY with other yield-contributing traits were also observed by earlier workers like Patil et al. (Reference Patil, Kalpande and Thawari2022) and Verma and Biradar (Reference Verma and Biradar2022).
ZLS is currently considered as minor disease of sorghum but under future climate change scenarios, could cause significant yield loss especially in fodder sorghum (Prom et al., Reference Prom, Isakeit, Cuevas, Rooney, Perumal and Magill2015). In the present study, sorghum accessions viz., EC-512397, EC512393, EC512394, EC512399 and IG-02-437 were identified as resistant during two consecutive wet seasons for central India. Prom et al. (Reference Prom, Isakeit, Cuevas, Rooney, Perumal and Magill2015) found a total of 13 sorghum lines with good resistance source against ZLS and rough leaf spot. Results showed that exotic genotypes had greater resistance to ZLS as compared to indigenous accessions, and 57 of which were classified as highly susceptible. For overall biomass yield, indigenous genotypes had superior performance compared to the exotic collection; this was expected since indigenous genotypes are adapted to the local agro-climatic conditions and for biomass yield. Results from this study demonstrate the potential for breeding improved ZLS resistance into indigenous germplasm for further yield improvement. This could be achieved through marker-assisted breeding or novel biotechnological approaches.
Conclusions
This study aimed to address the lack of adequate and genetically diverse sources of resistance to ZLS disease which has been a major constraint to sorghum improvement. Five genotypes were identified as potential sources of resistance against ZLS disease in central India: EC-512397, EC512393, EC512394, EC512399 and IG-02-437. Three genotypes (IG-03-424, IG-01-436 and IG-03-438) has good yield attributes based on GFY (808.66 g/plant) and DFY (238.0 g/plant) but were to be highly susceptible to ZLS. Results from the study demonstrate the potential for sorghum improvement by breeding ZLS resistance into the highest yielding genotypes.
Supplementary material
The supplementary material for this article can be found at https://doi.org/10.1017/S1479262124000078
Acknowledgements
The authors are thankful to the Head, Division of Crop Improvement and Director, ICAR-IGFRI, Jhansi for supplying necessary support and encouragement during the study.



