Retinal ischemia is a common clinical entity, which remains a substantial contributor to visual impairment and blindness (Osborne et al., Reference Osborne, Casson, Wood, Chidlow, Graham and Melena2004). Retinal ischemia manifests itself through a variety of diseases, such as ischemic optic neuropathy, obstructive retinopathy, carotid artery occlusive disease, and glaucoma (Verma, Reference Verma1993; Flammer et al., Reference Flammer, Orgul, Costa, Orzalesi, Krieglstein, Serra, Renard and Stefansson2002; Osborne et al., Reference Osborne, Casson, Wood, Chidlow, Graham and Melena2004). Many studies have demonstrated that timely reperfusion remains the only effective treatment pertaining to retinal ischemia (Osborne et al., Reference Osborne, Casson, Wood, Chidlow, Graham and Melena2004). In addition, other studies have demonstrated that reperfusion with oxygenated blood following ischemia potentiates ischemic damage through reactive oxygen species (ROS) (Li et al., Reference Li, Fu and Lo2012). The current literature offers no effective and definitive treatment recommendations protecting the retina from ischemia–reperfusion damage.
Our study attempts to analyze the role of astrocytes and cellular pathways, which influence the severity of ischemia/reperfusion injury (Eng et al., Reference Eng, Ghirnikar and Lee2000). Retinal ischemia promotes increased proliferation and differentiation of astrocytes. The increase in astrocyte activity following ischemia causes an increase in glial fibrillary acidic protein (GFAP) transcription and translation. In addition to GFAP, Nrf2 and HO-1 are protective cellular responses against neurologic ischemia and stroke. Nrf2 is a basic leucine zipper transcription factor that is found in most cells of the human body (Moi et al., Reference Moi, Chan, Asunis, Cao and Kan1994). Nrf2 is responsible for regulating the expression of multiple genes involved in antioxidant and cellular protective genes during periods of oxidative stress, such as ischemia/reperfusion injury (Shelton & Jaiswal, Reference Shelton and Jaiswal2013). HO-1, a heme-oxygenase 1, is one of the downstream effector enzymes of the Nrf2 pathway. HO-1 is a stress-responsive isoenzyme, which protects cells from programmed cell death. Each of these modalities could be addressed through separate cellular mechanisms and therapies. Clinical interventions could be targeted toward controlling and modulating these protective cellular responses.
Several studies have demonstrated that ischemic conditioning protected retinal function and histology from ischemia–reperfusion injury, when applied before experimental retinal ischemia (preconditioning) and after (postconditioning) reperfusion (Fernandez et al., 2009b; Dreixler et al., 2011a,Reference Dreixler, Sampat, Shaikh, Alexander, Marcet and Rothb). The preconditioning and postconditioning initiate and potentiate endogenous protective mechanisms, which subsequently diminish reperfusion injury through neutralizing ROS (Zhang et al., Reference Zhang, Rosenbaum, Shaikh, Li, Rosenbaum, Pelham and Roth2002; Obolensky et al., Reference Obolensky, Berenshtein, Konijn, Banin and Chevion2008). Fernandez et al. determined that local ischemic postconditioning reduced retinal ischemia–reperfusion injury (Fernandez et al., 2009a,Reference Fernandez, Chianelli and Rosensteinb). However, there are significant limitations pertaining to local ischemic conditioning due to the characteristics and properties of inducing ischemic conditioning in vital organs, such as the heart or brain (Veighey & Macallister, Reference Veighey and Macallister2012). A major breakthrough in the clinical applicability of ischemic conditioning surfaced with the discovery of remote ischemic conditioning, which possesses a systemic protective phenotype (Veighey & Macallister, Reference Veighey and Macallister2012). The protective mechanism of ischemic conditioning can be explained by the idea that transient nonlethal ischemia and reperfusion of one organ or tissue confer resistance to a subsequent episode of lethal ischemia reperfusion injury in an isolated organ (Hausenloy & Yellon, Reference Hausenloy and Yellon2008). Many groups have confirmed and defended the effectiveness of LRIC against ischemia/reperfusion injury in the central nervous system (Zhao, Reference Zhao2009; Hoda et al., Reference Hoda, Siddiqui, Herberg, Periyasamy-Thandavan, Bhatia, Hafez, Johnson, Hill, Ergul, Fagan and Hess2012). We have also reported that limb ischemic perconditioning ameliorated neuronal injury in a focal ischemic stroke rat model (Ren et al., Reference Ren, Gao, Dornbos, Ding, Zeng, Luo and Ji2012). Recently, we have shown that repeated daily remote conditioning by limb ischemia prevents recurrent stroke in humans (Meng et al., Reference Meng, Asmaro, Meng, Liu, Ma, Xi, Li, Ren, Luo, Ling, Jia, Hua, Wang, Ding, Lo and Ji2012). Thus, the aim of the present study was to examine whether limb remote per-conditioning in conjunction with post-conditioning prevents retinal ischemia–reperfusion injury through the modulation and analysis of GFAP, Nrf2, and HO-1.
Materials and methods
Subject
A total of 81 adult male Sprague-Dawley (280 to 320 g) rats were used in this study. Animals were housed in the same animal care facility throughout the duration of the study with a 12-h light/dark cycle. Animal care was carried out in accordance with guidelines approved by the Capital Medical University. All efforts were made to minimize any suffering and to reduce the total number of animals used.
Retinal ischemic injury model
Anesthesia was induced and maintained with 1.5–3.5% enflurane in 70% nitrous oxide and 30% oxygen (Bickford veterinary anesthesia equipment model no. 61010, AM Bickford Inc., Wales Center, NY). The rats were orally intubated and mechanically ventilated (Rodent Ventilator Model 683, Harvard Apparatus Inc., Holliston, MA). Retinal ischemic injury was generated by a 60-min right middle cerebral artery and pterygopalatine artery occlusion, using an intraluminal filament as described previously (Block et al., Reference Block, Grommes, Kosinski, Schmidt and Schwarz1997). The right common carotid artery and the right external carotid artery (ECA) were exposed through a midline neck incision. The occipital artery and thyroid artery were separated from surrounding fascia and subsequently ligated by electrocoagulation. The ECA was dissected distally, ligated, and coagulated along with the terminal lingual and maxillary artery branches. A minimal incision was made in the ECA stump, at an angle of incidence, with iridectomy scissors. Following the incision, occlusion of the MCA was made by a heparinized intraluminal filament (0.28 mm, rounded tip), which was introduced via the ECA. In addition to the MCAO, the pterygopalatine artery was permanently ligated. The core body temperatures were monitored with a rectal probe and maintained at 36.8–37.2 °C throughout the duration of the experiment using a heating pad and lamp. The middle cerebral artery was occluded for 60 min with subsequent reperfusion. Physiological variables, such as blood pressure and blood gases (pH, pO2, and pCO2), were monitored before and after surgical procedures through the cannulated right femoral artery (Table 1). The fundus oculi was visualized using an ophthalmoscope, which provided definitive verification of the retinal ischemia. Visualizing retinal blood flow interruption and observing the conjunctiva, iris and retina transitioning to a pale color throughout the MCAO confirmed the effectiveness of the ischemic event. Rats that did not display the aforementioned ischemic fundus oculi changes were removed from the study.
Physiological variables in ischemic rats

Values are mean ± SD. No significance was detected by ANOVA analysis. N = 5.
Remote postconditioning
Rats were assigned to three groups, as depicted in Fig. 1. Perconditioning (PerC) (Ren et al., Reference Ren, Gao, Dornbos, Ding, Zeng, Luo and Ji2012) was initiated immediately following the onset of retinal ischemia by occluding blood flow to the hind limbs bilaterally. Hind limb occlusion was accomplished by tightening a tourniquet (8 mm) around the upper thigh for 3 cycles, with each occlusion or release phase lasting 10 min (Fig. 1A). Postconditioning began on the second postoperative day and was conducted every day thereafter. Rats were anesthetized with a smaller dose of sodium pentobarbital (30 mg/kg intraperitoneally) and received the remote postconditioning, as previously described (Wei et al., Reference Wei, Xin, Li, Tao, Li, Li, Liu, Zhu and Redington2011). The same duration of sodium pentobarbital treatment was applied to the sham and ischemia control groups.
Experimental protocols. (A) rats were divided into 3 groups. Group 1: sham group. Group 2: control ischemia group (Con) was induced by 1.5 h occlusion of the right MCA. Group 3: LRIC group was induced during ischemia and once a day after reperfusion. Histological and immunohistochemical analyses were performed at day 1, 3, and 7. Western blot analysis is performed at day 1 and 3 after retinal ischemia/reperfusion. (B) figure showing the position of tightened tourniquet for RIC. The tourniquet was tightened bilaterally around the upper thighs. Tourniquet size is 8 mm. (C) retinal diagram depicting the region of interest. The cells in the RGC layer were counted in a standardized region in all subjects. There were a total of six regions, which included three regions in both directions originating at the optic nerve head.
Histopathological examination and immunohistochemical analysis
The rats were anesthetized with chloral hydrate and were subsequently sacrificed by transcardiac perfusion with physiological saline followed by 4% paraformaldehyde containing phosphate buffered saline (PBS) (pH 7.4). The bulbus oculi was removed and postfixed in the above solution. Paraffin sections were prepared and examined by light microscopy. The cells within the retinal ganglion cell (RGC) layer were quantified, as previously described and modified (Fernandez et al., 2009b). Six cell regions of interest (ROI) were selected (around 200 μm from the optic nerve head) and the cells were counted in the ROI (Fig. 1C). The quantitative analysis is expressed by the average number of six cell regions (per unit length 200 μm). The cells within the RGC layer were examined and quantified in a blinded manner at days 1, 3, and 7 following retinal ischemic injury.
Several sections were also utilized for immunohistochemical analysis. Sections were deparaffinized with 1% H2O2 in distilled water for 10 min followed by 5% normal goat serum. The sections were subsequently incubated with antibodies against GFAP (dilution 1:200, Santa Cruz Biotechnology, Dallas, TX) in PBS containing 0.03% Triton X-100 at 4 °C for 48 h. They were subsequently incubated with a biotinylated secondary antibody (dilution 1:500, Beijing ZhongShan Inc., Beijing, China) for 2 h and further incubated with the avidin–biotin–peroxidase complex (dilution 1:100, Beijing ZhongShan Inc., Beijing, China) for 1 h at room temperature. GFAP was visualized with 3,3′-diaminobenzidine tetrahydrochloride. Microscopic observations were made using a Nikon 80i microscope (Nikon, Tokyo, Japan).
Immunoblot analysis
Retinas were promptly dissected and frozen in liquid nitrogen. Cytosolic and nuclear fractions were isolated from the retinas, as described previously (Shah et al., Reference Shah, Li, Thimmulappa, Kensler, Yamamoto, Biswal and Dore2007). Samples containing equal amounts of protein were electrophoresed on 12.5% sodium dodecyl sulfate-polyacrylamide gels and then transferred to a polyvinylidene difluoride membrane (Millipore Corporation, Billerica, MA). The membrane was probed with antibodies specific for Nrf2 (dilution 1:200, Santa Cruz Biotechnology, Santa Cruz, CA) and HO-1 (1:200, Cell Signaling Technology, Inc., Beverly, MA). The specific reaction was visualized through the use of a chemiluminescent substrate (GE Healthcare, UK). GAPDH was used to verify equal HO-1 loading and lamin B, a nuclear marker, was used to verify equal Nrf2 loading. The mean amount of protein expression from the sham rat was assigned a value of 1 to serve as a reference value. Target gene expression was represented as the fold-difference with respect to the control.
Statistical analysis
Primary quantitative data were compiled and charted in Excel and the statistical analysis was applied using SPSS for Windows, version 17.0 (SPSS Inc.). For two-group comparison, ANOVA and posthoc S-N-K tests were used to determine significance. Charts display means and standard deviation. In all cases, P < 0.05 was the criterion for significance.
Results
Histological protection by LRIC
The ischemic retina displayed disorganization and cell loss in the RGC layer 1 day after injury. These changes deteriorated at day 3 and 7 (Fig. 2A, 2C, 2E) following the retinal ischemic insult. Histological examination of the retina showed that the number of cells in the RGC layer significantly decreased through the 7 days (Fig. 2G). The aforementioned ischemic changes were significantly diminished by LRIC from day 3 through day 7 (Fig. 2B, 2D, 2F, 2H). The number of cells in the RGC layer appeared to be more in the LRIC-treated group compared to the control group at day 1; however, the difference between the two groups was not statistically significant (P > 0.05) (Fig. 2H). At day 3, the number of cells in the RGC layer was significantly greater (17.2 ± 2.8) in the LRIC-treated group compared to those in the control group (14.3 ± 2.3) (P = 0.035). Furthermore, the cell number within the RGC layer of the control group decreased at day 7 (11.4 ± 1.7) compared with that at day 3 (14.3 ± 2.3) (P = 0.046). In addition, more cells were preserved in the LRIC-treated group at day 7 (14.2 ± 1.7) (P = 0.025). There was no observed difference in the total retinal thickness between the control and LRIC-treated groups (Table 2).
Representative histopathological images of hematoxylin and eosin-stained retinae in 4 µm thick sections for each of the experimental groups. These sections were prepared from retinae removed from the rats at day 1, 3, and 7 after retinal ischemia/reperfusion. (A, C and E) represented the control group at day 1, 3, and 7, respectively. (B, D and F) represented the LRIC group at day 1, 3, and 7, respectively. (G) represented the sham group. (H) Bar graphs depicting the average cell number in the RGC. The averaged number of cells in the RGC layer is reported as cells per region of interest. * P < 0.05 compared to control group at day 1; # P < 0.05 compared to corresponding control group. Scale bar = 50 μm. Error bars indicated SD. N = 5.
Total retinal layer thicknesses
Values are mean ± SD. No significance was detected by ANOVA analysis. N = 5.
Alteration of GFAP
In order to fully elucidate and characterize the morphologic protection induced by LRIC, retinal immunoreactivity for GFAP was analyzed at day 1, 3, and 7 following injury. In nonischemic retinas, astrocytes localized within the nerve fiber and the ganglia cell layer elicited minimal labeling (Fig. 3B). Whereas, 90 min of ischemia induced an increase in retinal astrocyte GFAP levels, which spread to glial processes from the inner limiting membrane to the outer retina, associated with activated Müller cells (Fig. 3C). In addition, the GFAP immunoposition increased as the time of the reperfusion increased (Fig. 3C, 3E, 3G). LRIC significantly decreased the levels of GFAP in Müller cells compared with those observed in the control group (Fig. 3D, 3F, 3H).
Representative immunohistochemical images of GFAP in 4 µm thick sections for each of the experimental groups at day 1, 3, and 7 after retinal ischemia/reperfusion. (A) The negative control section that was not incubated with primary antibody. (B) Sham group. (C, E and G) represented the control group at day 1, 3, and 7, respectively. (D, F and H) represented the LRIC group at day 1, 3, and 7, respectively. Scale bar = 50 μm. N = 5.
Expression of oxidative stress-induced proteins
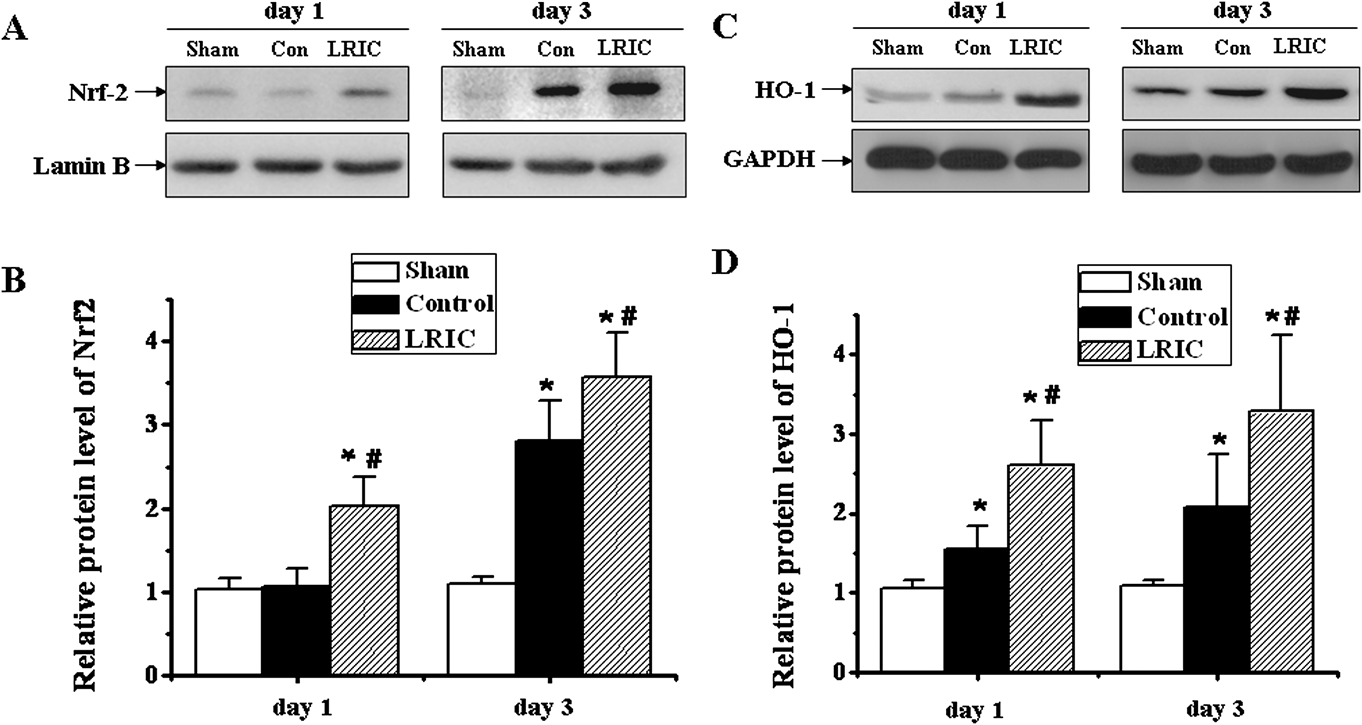
Nrf2 and HO-1 were analyzed by Western blot in rat retina for each of the experimental groups at day 1 and 3 after retinal ischemia/reperfusion (Fig. 4). When compared to the sham-operated group, Nrf2 protein expression slightly increased in the retinal ischemic group at day 1, but did not reach a statistically significant level. However, LRIC significantly (P < 0.000) increased the expression of Nrf2, as compared to sham group and non-treatment ischemic group (P < 0.000), at the same time point. At day 3, LRIC significantly increased Nrf2 expression (3.6 ± 0.5), as compared to the ischemic group (2.8 ± 0.5) (P = 0.007) (Fig. 4A and 4B). The LRIC group demonstrated a large and significant increase in HO-1 expression at day 1 (2.6 ± 0.6), as compared to the sham (1.1 ± 0.1) (P < 0.000) and the ischemic non-treatment groups (1.6 ± 0.3) (P = 0.00). In addition, LRIC performed on day 3 significantly increased HO-1 expression (3.3 ± 0.1), as compared to sham (1.1 ± 0.1) (P < 0.000) and ischemic groups (2.1 ± 0.7) (P = 0.008) (Fig. 4C and 4D).
Quantitative immunoblotting analysis in rat retina for each of the experimental groups at day 1 and 3 after retinal ischemia/reperfusion. (A, C) Representative Western blots of retinal lysates are shown, probed with antibody for Nrf2 and HO-1, respectively. (B, D) Quantifications of Nrf2 and HO-1 levels from immunoblot are shown, respectively. * P < 0.05 compared to corresponding sham group; # P < 0.05 compared to corresponding control group. Error bars indicated SD. N = 6.
Discussion
The results from this study indicate that remote ischemic per- and post-conditioning applied to the hind limbs ameliorated the retinal ischemia/reperfusion injury. LRIC decreased the GFAP levels from day 1 to 7 compared to the untreated ischemic rats. In addition, LRIC increased the expression of Nrf2 and HO-1 at day 1 and 3 following ischemia/reperfusion.
Ischemic conditioning can be applied before ischemia (pre-conditioning), during ischemia (per-conditioning), or after the onset of reperfusion (post-conditioning) (Hausenloy & Yellon, Reference Hausenloy and Yellon2011). In this study, one time limb remote perconditioning combined with daily postconditioning for up to day 7 was applied to rats with retinal ischemia/reperfusion injury. It was previously reported that remote perconditioning applied to the arm, by blood pressure cuff inflation, during ambulance transport (i.e., during ischemia) increased the mean and median salvage indexes (Botker et al., Reference Botker, Kharbanda, Schmidt, Bottcher, Kaltoft, Terkelsen, Munk, Andersen, Hansen, Trautner, Lassen, Christiansen, Krusell, Kristensen, Thuesen, Nielsen, Rehling, Sorensen, Redington and Nielsen2010). In our recent study, we demonstrated that repeated daily remote perconditioning by limb ischemia prevents recurrent stroke in humans (Meng et al., Reference Meng, Asmaro, Meng, Liu, Ma, Xi, Li, Ren, Luo, Ling, Jia, Hua, Wang, Ding, Lo and Ji2012). Wei et al. reported that a single early episode of remote perconditioning reduces infarct size after myocardial infarction, and repeated remote postconditioning further reduces adverse left ventricular remodeling and improves survival in a dose-dependent fashion (Wei et al., Reference Wei, Xin, Li, Tao, Li, Li, Liu, Zhu and Redington2011). Our present study further demonstrates that combining remote ischemic per- and post-conditioning results in retinal ischemic tolerance. These descriptions refer to the well-established protective effects of remote conditioning, when delivered during ischemia in several organ systems, such as the retina (Saxena et al., Reference Saxena, Newman, Shehatha, Redington and Konstantinov2010). In this study, our results indicate that the neuroprotection of LRIC may confer additional benefits to damaged ganglion cells by repeating the limb ischemia on a daily basis. LRIC may ultimately prove to be a simple, widely accessible, and potentially cost effective therapeutic strategy that improves retinal ischemia outcomes for patients.
To further demonstrate the protective role of LRIC, GFAP immunoreactivity was studied. Müller cells that do not express GFAP under physiological conditions are known to express GFAP in pathological situations (Osborne et al., Reference Osborne, Block and Sontag1991; Jadhav et al., Reference Jadhav, Roesch and Cepko2009). The physiological process of ischemia/reperfusion induced a significant alteration in Müller cells, as shown by an increase in GFAP immunoreactivity secondary to ischemia/reperfusion injury (Fig. 3C, 3E, 3G). LRIC reduced GFAP levels of Müller cells at day 1, 3, and 7 after reperfusion. Fernandez et al. reported that postconditioning offered neuroprotection at day 7; however, there was no significant protection observed at day 1 (Fernandez et al., 2009b). We believe the difference, in regard to the protective effect, may be related to our chosen ischemia model and the performance matter of ischemic conditioning. It is plausible that combining perconditioning during ischemia and postconditioning daily might enhance the protection of ischemic conditioning, although further evaluation with a control group is needed to confirm this assumption. As previously mentioned, HO-1 induced in Müller cells plays a protective role in retinal ischemia–reperfusion injury in rats (Arai-Gaun et al., Reference Arai-Gaun, Katai, Kikuchi, Kurokawa, Ohta and Yoshimura2004). It is plausible that the increased expression of HO-1 in the LRIC group diminished the ischemia/reperfusion injury, which subsequently reduced the GFAP expression in Müller cells.
A multitude of cellular and molecular mechanisms have been associated with the per- and post-conditioning, which include reduction of free radical generation, inhibition of inflammatory pathways, cellular signaling pathways, and regulation of mitochondrial function (Zhao & Vinten-Johansen, Reference Zhao and Vinten-Johansen2006; Zhao, Reference Zhao2009). The retina is highly susceptible to oxidative damage by ROS. ROS are generated within the CNS in response to the oxygen burst, induced by recanalization of anoxic tissue. During the pathological events of retinal ischemia, the imbalance between the production of ROS and the ability to scavenge these ROS by endogenous antioxidant systems is exaggerated. In this study, our data showed that LRIC upregulated the expression of Nrf2 and HO-1 (Fig. 4), which play a significant role in detoxifying ROS. Nrf2 has been reported to be a key regulator in cell survival mechanisms (Owuor & Kong, Reference Owuor and Kong2002). It induces expression and upregulation of cytoprotective and antioxidant genes that attenuate tissue injury. Shah et al. reported that Nrf2 has an important role in protection against cerebral ischemic stroke (Shah et al., Reference Shah, Li, Thimmulappa, Kensler, Yamamoto, Biswal and Dore2007). Nrf2 activation enhances defensive antioxidant mechanisms, within neurons and glia, in rat cortex through upregulation of the antioxidant response and antioxidant response element (ARE)-driven genes (Lee et al., Reference Lee, Calkins, Chan, Kan and Johnson2003). ARE-regulated genes, such as HO-1, ferritin, and glutathione peroxidase, maintain redox homeostasis. Of these, HO-1 has been reported to have the most AREs on its promoter. Substantial evidence suggests that HO-1 can be regulated through the Nrf2/ARE-mediated pathway (Satoh et al., Reference Satoh, Okamoto, Cui, Watanabe, Furuta, Suzuki, Tohyama and Lipton2006; Zhao et al., Reference Zhao, Kobori, Aronowski and Dash2006). It has been shown that HO-1 is expressed in the liver at 4 and 24 h after hind limb remote preconditioning, which is associated with protection of the liver against ischemia/reperfusion (Lai et al., Reference Lai, Chang, Chen and Tsai2006). Zhu et al. reported that hypoxic preconditioning could increase the expression of HO-1 protein in a retinal ischemic mouse model (Zhu et al., Reference Zhu, Zhang, Ojwang, Brantley and Gidday2007). More recently, Shokeir et al. reported that ischemic conditioning could enhance expression of Nrf2 and its dependent antioxidant genes, such as HO-1, in renal ischemia/reperfusion rat model (Shokeir et al., Reference Shokeir, Hussein, Barakat, Abdelaziz, Elgarba and Awadalla2013). However, in our pilot experiment, LRIC-only treatment without ischemia had no significant effect on the expression of Nrf2 and HO-1 within the retina at day 1 (data not shown). Although the present study did not provide direct evidence showing that Nrf-2 and HO-1 expression leads to neuroprotection, this hypothesis has been supported by a recent study. He et al. reported that the upregulated expressions of Nrf-2 and HO-1 by ischemia/reperfusion were further enhanced by Lycium barbarum polysaccharides, which protect retina from ischemia/reperfusion injury (He et al., Reference He, Pan, Chang, So, Brecha and Pu2014). Integration of our results with previous findings and literature suggests that LRIC exerts its beneficial effect through the Nrf2/HO-1 pathway.
In conclusion, we determined that limb remote ischemic conditioning (LRIC) protects the rat retina from ischemia/reperfusion injury. Although the mechanism(s) involved in retinal ischemic conditioning need to be further examined, the results from our study and the current literature support the idea that the Nrf2/HO-1 pathway is directly involved in retinal protection induced by LRIC. The results exhibited in this study may provide clues to help elucidate the protective capabilities of LRIC. LRIC could serve as a valuable tool in the scientific and medical community’s pursuit for superior therapeutics in enhancing neurological outcomes following ischemia/reperfusion injury. The findings in our study indicate three directions in which therapeutics could be designed. First, LRIC techniques could be maximized and evaluated in depth to truly comprehend and understand the power of this treatment. Second, pharmacologic agents could be directed at the Nrf2 and HO-1 pathway. LRIC was used to discover the potentiation of this pathway and its favorable effects following ischemia and reperfusion. Moving forward, interventions could be developed that modulate and potentiate the Nrf2 and HO-1 pathway. Third, Nrf2 and HO-1 could be used as biomarkers of ischemic and reperfusion injury. Further studies would be needed to differentiate and calibrate changes in Nrf2 and HO-1, as they relate to clinical applicability and the patient.
Sources of funding
This work was partially supported by the National Basic Research Program of China (973 Program, No. 2011CB707804) and Scientific Special Funding of Capital Health Development (No. 2011-1001-03).
Disclosures/Conflict of interest
None.