INTRODUCTION
The NAO is a large-scale atmospheric circulation pattern across the Atlantic Ocean (Wanner et al. Reference Wanner, Bronnimann, Casty, Gyalistras, Luterbacher, Schmutz, Stephenson and Xoplaki2001; Hurrell et al. Reference Hurrell, Kushnir, Ottersen and Visbeck2003). It has marked effects on the European climate (Hurrell & Van Loon Reference Hurrell and Van Loon1997) including the UK (Wilby et al. Reference Wilby, O'Hare and Barnsley1997), especially on winter temperature. Many direct and indirect effects of the NAO on marine, freshwater and terrestrial ecosystems have been documented (Ottersen et al. Reference Ottersen, Planque, Belgrano, Post, Reid and Stenseth2001; Blenckner & Hillebrand Reference Blenckner and Hillebrand2002).
A significant association between a wheat grain quality measurement (specific weight) and a North Atlantic Oscillation (NAO) index the previous winter was demonstrated by Kettlewell et al. (Reference Kettlewell, Sothern and Koukkari1999). Specific weight (grain bulk density) is one of the primary criteria used in the UK wheat market, since it has a strong impact on transport and storage costs (Brooker & Bakke Reference Brooker, Bakker-Arkema and Hall1992). High specific weight of wheat grain is also used commercially as an indicator of flour yield (Morris & Rose Reference Morris, Rose, Henry and Kettlewell1996), animal feed value (Miller & Wilkinson Reference Miller and Wilkinson1998) and alcohol yield (Bringhurst et al. Reference Bringhurst, Fotheringham, Brosnan, Russell, Bamforth and Stewart2003), although good relationships between specific weight and these variables are not always found (respectively, Hook Reference Hook1967; Taylor et al. Reference Taylor, Cranstoun and Roscrow1993; McCracken et al. Reference McCracken, Miller, Rose and McNab2001). Specific weight is largely determined by the environment during grain filling and grain ripening. Plump, well-filled grain tends to have higher specific weight than shrivelled, poorly filled grain (Bayles Reference Bayles1977) and grain ripened in wet weather tends to have low specific weight (Czarnecki & Evans Reference Czarnecki and Evans1986).
The climatic basis of the specific weight relationship with winter NAO was explored by Atkinson et al. (Reference Atkinson, Kettlewell, Hollins, Stephenson and Hardwick2005), who showed that it is attributable to a time-lagged relationship between the winter NAO index and aspects of the summer climate that impact directly on the quality characteristics of the grain. These were: firstly, the duration of sunshine during the grain filling period, leading to a higher specific weight because it reflects greater quantities of photosynthate available for filling the grain; secondly, the unconditional wet-day probability (the probability of a wet day following either a dry or a wet day) during the grain-ripening period, because this will affect the degree of weathering of the grain surface and thus the specific weight. The support for this hypothesis was strengthened by the demonstration of a link between the winter NAO and summer precipitation (Kettlewell et al. Reference Kettlewell, Stephenson, Atkinson and Hollins2003; Westgarth-Smith et al. Reference Westgarth-Smith, Leroy, Collins and Roy2005). An alternative hypothesis was tested: that winter temperatures, associated contemporaneously with the winter NAO, may have an effect on the rate of development of the crop, which would later be manifested in quality differences. Associations between the NAO index and dates of development stages were very weak, as were associations between specific weight and dates of development stages. On this basis, the winter temperature hypothesis was rejected.
The earlier studies of the relationship between specific weight and the NAO (Kettlewell et al. Reference Kettlewell, Sothern and Koukkari1999; Atkinson et al. Reference Atkinson, Kettlewell, Hollins, Stephenson and Hardwick2005) were based on data pertaining to UK national average quality collected between 1974 and 1999 by the Home-Grown Cereals Authority (HGCA). A search was made for similar series of historical data, which could be used to explore the relationship further into the past. The only suitable long-term dataset available was from Broadbalk Field at Rothamsted, from an experiment initiated in 1843 and still running. Specific weight was measured from these experimental plots until 1955. One of the experimental treatments (farmyard manure (FYM)) was chosen as representative of the whole experiment and the time-series for this treatment was extended until 2001 by measuring the specific weight of archived grain samples.
The aim of the present study was to discover whether the association with the NAO, previously found in the national average specific weight from 1974 to 1999, could also be detected in the single site data from the Broadbalk Experiment over the much longer period of 1844–2001. Initially, the specific weight was examined with multiple regression analysis to see if similar relationships with weather during grain development could be found in the Broadbalk data to those in the national average specific weight. Subsequently, the association with the NAO was characterized with regression analysis and running correlations.
MATERIALS AND METHODS
The Broadbalk Wheat Experiment
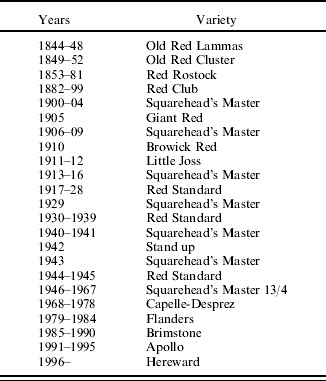
The first experimental crop of wheat was sown on Broadbalk in the autumn of 1843 and harvested in 1844. The experiment aimed to test the effect of a range of organic and inorganic fertilizers on the yield of winter wheat. Broadbalk is a field of c. 5·6 ha divided originally into 20 linear plots running the length of the field (approximately east-west), which has a silty clay loam soil. There was some variation in the treatments in the early years but a permanent set of treatments was established in 1852. One of the treatments that has remained constant since 1844 is the application of FYM at the rate of 35 t/ha. The crop has usually been sown in October or November and, with a few exceptions, a single variety each year (Table 1). It is harvested in August or September. It was harvested by hand until 1901 and by binder from 1902 to 1956. Sheaves were stooked on the plot then carted and stored until threshing in winter, when bushel weight was determined by weighing a bushel measure filled with grain. A combine harvester has been used since 1957. The measurement of bushel weight was discontinued in 1955 (Johnston & Garner Reference Johnston and Garner1969).
Wheat varieties grown in the Broadbalk Experiment, 1844–2001

Weeds were starting to become a problem during the early decades of the 20th century, having previously been removed by hand. Fallowing of various parts of the field was introduced in various years, until, in 1926, the field was divided into five sections, which were systematically fallowed in rotation (Johnston & Garner Reference Johnston and Garner1969).
Various changes were instituted in 1955. Greater changes were brought about in 1968, when the field was further divided into 10 sections, of which four grew continuous wheat and the others grew wheat in a 3-year rotation. One of the continuous wheat sections (section 1), which was last fallowed in 1966 (Dyke et al. Reference Dyke, George, Johnston, Poulton and Todd1983), was the source of samples for the present study.
Treatment and plots used in the present study
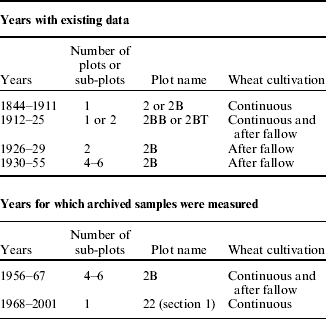
Two plots that have had the most consistent treatment across the whole period of the experiment are the FYM and control (no fertilizer or manure) plots. The former was chosen on the basis that this treatment was the closer of the two to standard agricultural practice at any date. The plot used in the present study was called 2 until 1885, 2B between 1886 and 1968, and 22 since 1969. For the present work, the plots from which data were taken are given in Table 2, as are the plots from which archived samples of cleaned grain were available. The bushel weight data from 1844 to 1955 were obtained from the Electronic Rothamsted Archive (2002) and the units converted from lbs/bushel to kg/hl.
Plots in the Broadbalk Experiment from which data was used
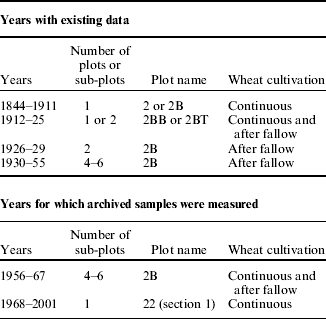
Only in 1935 did the fallowing regime settle such that the four intervals after fallowing were present, and in 1955, one of the plots was split. A one-way analysis of variance of the specific weight between 1935 and 1954 to test whether crops in the first, second, third and fourth years after fallowing had any systematic differences in specific weight showed that there was no significant difference due to the position in the fallowing cycle (P=0·94). The data from each section of the field in each of these years were therefore pooled. Data were similarly pooled for the other years in which fallowing took place.
Measurement of grain samples from 1956 to 2001
The archived grain samples had been stored in glass jars with wax-sealed cork stoppers or in tins with tight fitting metal lids. These samples were too small to be accommodated by the chondrometer available for measuring specific weight. Consequently, a cardboard insert was made for the chondrometer which approximately halved its volume. The specific weight of the archived samples was calculated from a linear regression equation derived from 16 samples from field experiments in the 2001 harvest at Harper Adams University College. Specific weight measured with the standard procedure was regressed against the weight of grain filling the reduced-volume chondrometer.
Meteorological and climatic data
Although the Broadbalk Experiment began in 1844 and measurement of precipitation began in 1853, sunshine duration was not recorded until 1891. Daily maximum and minimum temperatures, daily precipitation and daily duration of sunshine data for the period 1891–1997 were obtained from the Electronic Rothamsted Archive (2002). For 1998–2001, they were obtained from the British Atmospheric Data Centre (2002).
The NAO index of Jones et al. (Reference Jones, Jonsson and Wheeler1997) permitted the analysis of the relationship with specific weight data from the start of the experiment in 1844. This index uses sea level pressure data from Gibraltar and Stykkisholmur (Iceland) enabling the series to be extended back to 1825. This could therefore be used with the entire time series of specific weight (1844–2001). The January index was used to be consistent with the present authors' previous study (Atkinson et al. Reference Atkinson, Kettlewell, Hollins, Stephenson and Hardwick2005).
Crop modelling
It has been shown in a previous paper (Atkinson et al. Reference Atkinson, Kettlewell, Hollins, Stephenson and Hardwick2005) that the two principal climatic factors affecting specific weight were sunshine duration during the grain filling period (approximating to June and July) and a measure of the probability of wet days during grain ripening (approximating to July and August). To confirm that the Rothamsted specific weight data demonstrated the same response to these climatic variables as the UK average data, these data for the same time period were subjected to the same analysis.
Dates of grain development stages were not available for most of the period under study, and therefore a computer model for wheat crop development (AFRCWHEAT) was used to retrospectively estimate the dates of grain development stages (Weir et al. Reference Weir, Bragg, Porter and Rayner1984). This model has been extensively validated in the UK and other countries and is often used in simulating effects of projected climate change on wheat (e.g. Laurila Reference Laurila1995). The part of this model concerned with predicting development stages requires only the latitude of the site, sowing date and daily maximum and minimum temperatures as input variables. The variety (Avalon) was kept constant since inadequate information on the model parameters for the varieties in the Broadbalk Experiment was available. The assumption was made that these parameters would be broadly representative of the other varieties. Seed sowing density was also kept constant at 320 seeds/m2. The Broadbalk sowing date for each year, and the daily maximum and minimum temperatures from the Rothamsted meteorological station were used. The latitude of the meteorological station (51°48′N) was used in the model. Input to the model for a single year consisted of daily maximum and minimum temperature for every day of the year. The model was run for the years 1891–2001 and predicted dates for the two-development stages anthesis and end of grain fill were noted.
The grain filling period was defined as the period between anthesis and end of grain fill, and grain ripening was defined as beginning one day after the end of grain fill and finishing 19 days later (Atkinson et al. Reference Atkinson, Kettlewell, Hollins, Stephenson and Hardwick2005). Cumulative daily sunshine duration during grain filling was calculated for each year. The unconditional probability of a wet day using a threshold of 2 mm daily precipitation was calculated for the grain ripening period for each year (Atkinson et al. Reference Atkinson, Kettlewell, Hollins, Stephenson and Hardwick2005).
A range of statistical analyses was undertaken, as described in detail in the Results section, with Genstat for Windows, 6th to 10th editions.
RESULTS
Preliminary data analysis
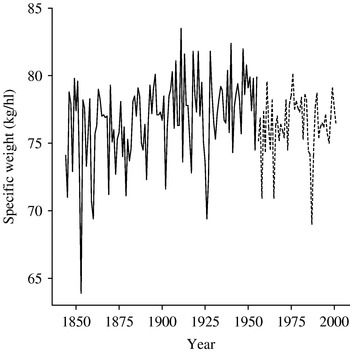
The specific weight data was treated as two separate datasets: 1844–1955 and 1956–2001. This is because the method of measurement was different for these two periods, and additionally the method of harvest was different (from 1957). A difference between the two datasets can be seen in the time-series graph shown in Fig. 1, with the data from the recent (archived) samples (1956–2001) appearing to have a lower specific weight than the data for the previous few decades (collected at the time of threshing in each year). Analysis of variance comparing the 46 years of the more-recent specific weight (1956–2001) with the specific weight in the immediate past 46 years (1910–55) confirmed that a significant difference existed (P=0·008). These two datasets are subsequently referred to as historic (1844–1955) and recent (1956–2001).
Time series of specific weight of wheat grain from Broadbalk. Solid line is historic data from Electronic Rothamsted Archive for weight of a bushel of dressed grain measured at threshing, converted to kg/hl; dashed line is recent data measured in kg/hl with a chondrometer using archived grain samples.

Since varieties of wheat differ in their quality characteristics, residual maximum likelihood analysis was used to ascertain whether varieties grown in different years had an effect on the specific weight (Smith & Gooding Reference Smith and Gooding1999). No significant effect was detected in the recent dataset, so raw data were used for all subsequent analyses with this dataset. Variety was significant (P=0·021), however, for the historic dataset and specific weight values adjusted for the variety effect were used in subsequent analyses with the historic data.
Calculation of the autocorrelation coefficients for the variables used in subsequent regression analyses showed that little or no serial correlation existed, indicating the validity of subsequent simple regression analyses.
Responses to climate during grain development
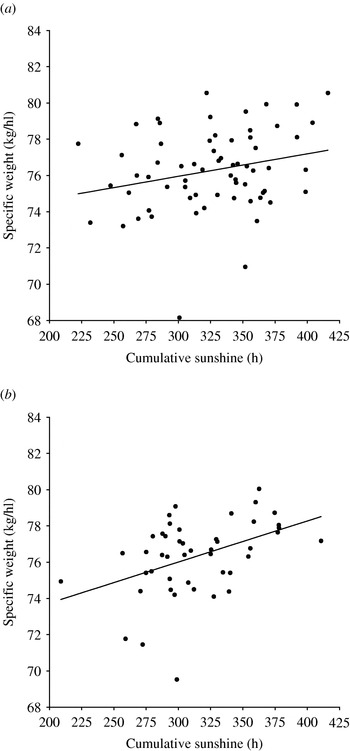
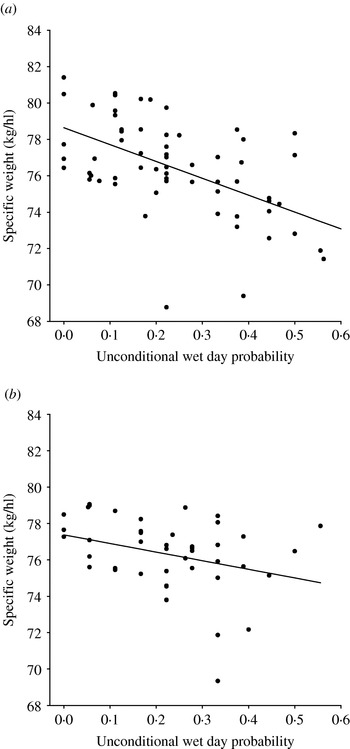
Multiple regression of specific weight against sunshine hours during grain filling and unconditional wet day probability was conducted using the historic and recent sample data with the former starting from the time when sunshine data was first recorded in 1891. The regression analysis showed similar results in both datasets. Broadbalk specific weight increased with longer sunshine duration during grain filling at 0·012±0·0062 kg/hl/h in the historic dataset and at 0·023±0·0074 kg/hl/h in the recent dataset (Fig. 2). Specific weight decreased with greater unconditional wet day probability during grain ripening with a regression coefficient of −9·3±1·62 kg/hl/unit probability in the historic dataset and with a regression coefficient of −5·5±2·22 kg/hl/unit probability in the recent dataset (Fig. 3). These rates of increase are of the same order of magnitude and broadly comparable with those from the previous analysis of the UK national average specific weight (Atkinson et al. Reference Atkinson, Kettlewell, Hollins, Stephenson and Hardwick2005) of 0·02±0·006 kg/hl/h for sunshine duration, and −8·5±2·33 kg/hl/unit probability for unconditional wet day probability. This indicates that the specific weight of grain from Broadbalk responded to weather in a similar way to the specific weight of grain from the HGCA Quality Survey.
Relationships between Broadbalk specific weight and cumulative sunshine duration during grain filling over the periods (a) 1891–1955 and (b) 1956–2001.

Relationships between Broadbalk specific weight and unconditional probability of a wet day during grain-ripening over the periods (a) 1891–1955 and (b) 1956–2001.

Relationships with the NAO
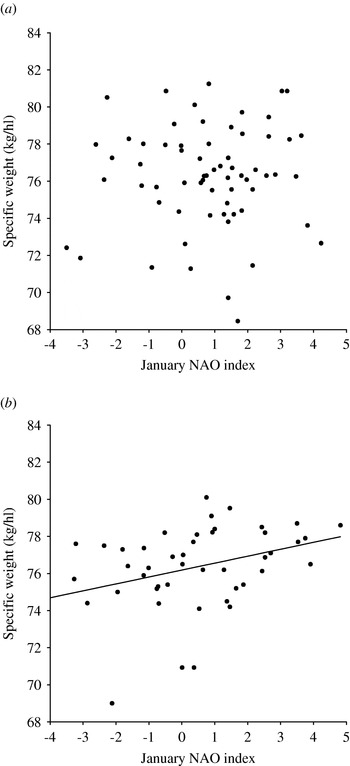
Regression of the historic specific weight time series against Jones' January NAO index showed no relationship (P=0·750), whereas in the recent specific weight there was a significant, albeit weak, increase with increasing January NAO (P=0·018; R 2=0·12) (Fig. 4). This indicates that the association between wheat quality and the NAO is a relatively recent phenomenon.
Relationships between Broadbalk specific weight and Jones' January NAO index over the periods (a) 1844–1955 and (b) 1956–2001.

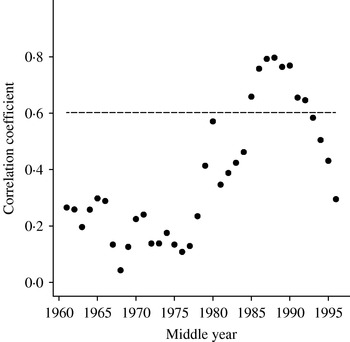
Since the dataset of HGCA national average specific weight used in the previous study only started in 1974, it is of interest to examine the relationship of Broadbalk specific weight and the NAO in different parts of the recent period to see if the relationship existed before 1974. In order to do this, running correlations were carried out using an 11-year window, i.e. the 36 correlation coefficients between specific weight and the Jones' January NAO index were calculated for the periods 1956–66, 1957–67, 1958–68, et seq. These correlation coefficients are plotted against the middle year of the 11-year period in Fig. 5. The conventional significance level for the correlation coefficient, determined using the t distribution (e.g. Sokal & Rohlf Reference Sokal and Rohlf1995), is shown as a dashed horizontal line in Fig. 5.
Running correlations for 11-year periods between Broadbalk specific weight and Jones' January NAO index from 1956 to 2001 plotted against the mid-year of each 11-year period. Horizontal dashed line is the correlation coefficient value significant in the conventional t test at P=0·05.

Eight of the 36 correlations are significant at P=0·05 and the significant correlations are consecutive in the time-series starting with the 11-year correlation for 1980–90 and ending with the 11-year correlation for 1987–97. This indicates that the association between the NAO and specific weight in the Broadbalk Experiment was not present (or too weak to be significant with only nine degrees of freedom) before the 1980s and weakened again in the 1990s.
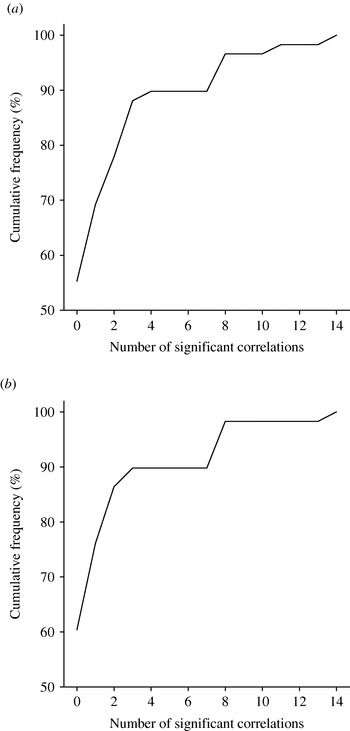
Some coefficients above the significance level would be expected due to chance with a large number of multiple tests. Livezey & Chen (Reference Livezey and Chen1983) have calculated the proportion of significant correlation coefficients which would be expected by chance when conducting multiple tests, based on the binomial distribution. Eight out of 36 significant correlations (a proportion of 0·22) is above the proportion expected by chance. However, since coefficients for periods close to each other are calculated with some of the same data, they are not independent. To aid interpretation of significance in this situation, a Monte Carlo simulation (Wilks Reference Wilks2006) was performed under a null hypothesis that there are no significant correlations in the 46-year time series of specific weight and Jones' January NAO index. A simulated run was done by randomly rearranging both time-series (specific weight and the NAO index), performing a running correlation analysis and counting the number of significant (at P=0·05) coefficients. This was carried out 1000 times and the cumulative frequency distribution of significant running correlation coefficients was plotted (Fig. 6a). This shows that eight (or more) significant running correlations, as found with the original Broadbalk and NAO data, were only found by chance in 0·034 of running correlation analyses when 36 coefficients are calculated in each analysis, i.e. an overall significance of P=0·034. Furthermore, all eight of the significant running correlations are consecutive in the time-series, and the cumulative frequency distribution of consecutive significant running correlations was also compiled from the same Monte Carlo simulations (Fig. 6b). This shows an even smaller frequency by chance (0·017) of obtaining eight or more consecutive significant running correlations, giving an overall significance of P=0·017. These Monte Carlo simulations give some reassurance in the validity of the interpretation of the running correlation analysis of the original Broadbalk and NAO data described in the previous paragraph.
Cumulative probability distributions for (a) number of significant (at P=0·05), (b) number of consecutive significant (at P=0·05) running correlations obtained in each of 1000 Monte Carlo simulations of 36 running correlations using re-randomized Broadbalk specific weight and Jones' January NAO index over the period 1956–2001.

DISCUSSION
A strong relationship between the January NAO index and specific weight was detected by Atkinson et al. (Reference Atkinson, Kettlewell, Hollins, Stephenson and Hardwick2005) in a set of data averaged from many sites in each year starting in 1974 and finishing in 1999. The existence of this association is confirmed in the present work with the single-site data from Broadbalk field. A significant relationship was found between the Jones' January NAO index and specific weight for the recent period (1956–2001), although not for the historic period (1844–1955). Furthermore, the running correlation analysis indicates that the association may not have been present until 1980.
The start of the 11-year period for the first significant running correlation in 1980 is very close to the introduction of spraying summer foliar fungicides for disease control (1979). Summer disease control is known to increase specific weight (Gooding & Davies Reference Gooding and Davies1997) and it is possible that this may have allowed the association with the NAO to be detected. The effects of the two weather variables mediating the effect of the NAO (sunshine duration and unconditional wet day probability) were, however, very similar in both historic and recent datasets, indicating that the grain was responding to the weather regardless of whether fungicide was used or not.
The relationship between the January NAO index and specific weight for Broadbalk is much weaker than in previous studies using UK national average specific weight. Only 0·017 of the variation in Broadbalk specific weight was accounted for by Jones' January NAO compared with 0·46 of the variation in national average specific weight (for the same years 1974–2001). This is probably a result of greater local variation in climate, especially rainfall, at a single site compared with averaging across a very large area. Furthermore, the HGCA data is derived from a much larger number of samples: the median sample number is 2124. In support of this, the R 2 for the relationship between the winter NAO and summer herbage growth in a neighbouring single site experiment at Rothamsted was broadly similar to that between January NAO and specific weight in the Broadbalk Experiment (Kettlewell et al. Reference Kettlewell, Easey, Stephenson and Poulton2006).
The significant relationships between specific weight and sunshine duration during grain filling and unconditional wet day probability during grain ripening show that the biological mechanism of the association between the winter NAO and specific weight is similar for Broadbalk wheat to that found previously with the national average wheat quality. The similar order of magnitude of the regression coefficients for these relationships between these studies also indicates that the assumption made in the calculation of the climate variables for Broadbalk that the AFRC model parameters for Avalon would approximate to those for other varieties was not unreasonable.
The linkage between the winter NAO and summer climate has been suggested by several previous studies. The phenomenon was investigated over the whole of the northern hemisphere by Ogi et al. (Reference Ogi, Tachibana and Yamazaki2003), who concluded that it is not uniformly distributed but is particularly evident over certain restricted areas. Hurrell's winter (December, January and February) NAO index was correlated with surface temperature (Ogi et al. Reference Ogi, Tachibana and Yamazaki2003) in a small number of restricted regions. This was also the finding of Kettlewell et al. (Reference Kettlewell, Stephenson, Atkinson and Hollins2003) with respect to precipitation and Qian & Saunders (Reference Qian and Saunders2003) with respect to temperature. All of these variables show an area of positive correlation over the British Isles. Other studies (Wedgbrow et al. Reference Wedgbrow, Wilby, Fox and O'Hare2002; Hollins et al. Reference Hollins, Kettlewell, Atkinson, Stephenson, Corden, Millington and Mullins2004) have restricted themselves to the winter–summer linkage over the British Isles. The physical mechanism of the winter NAO and summer climate linkage is not clear, but the suggestion is made by Ogi et al. (Reference Ogi, Tachibana and Yamazaki2003) that the winter–summer linkage cannot be mediated by the atmosphere and that the most likely candidates are sea ice, sea-surface temperatures (SSTs) and snow cover. High European snow cover in late winter (negative NAO index) may delay spring and summer warming because of the high albedo and high requirement of latent heat for melting. These lower temperatures may delay the expansion of the Azores high, leading in turn to lower summer temperatures over the British Isles (Qian & Saunders Reference Qian and Saunders2003).
The varying strength of winter–summer linkage observed in the present study was noted by Qian & Saunders (Reference Qian and Saunders2003). They observed that significant correlations between winter NAO and Central England Temperature were only attained in the last 35 years. Furthermore, temporal instability was observed by Kettlewell et al. (Reference Kettlewell, Easey, Stephenson and Poulton2006) in the relationship between the winter NAO and summer herbage growth in a neighbouring experiment at Rothamsted (the Park Grass Experiment). The reasons for this temporal instability are not clear.
In conclusion, the present study confirms with single site data previous work with national average data that there is an association in the UK between the January NAO and wheat grain quality, as measured by specific weight. This research extends the previous work by showing that the association is relatively recent and did not exist in the second half of the 19th century and the first half of the 20th century.
We are grateful to the HGCA for funding this research, and ADM Milling, Allied Mills/Weston Research Laboratories, Alvan Blanch, Hydro Agri, PBIC Seeds, Rank Hovis and Syngenta for additional support. We are grateful to Stoyan Pirgozliev for the use of grain samples for calibration. We thank Rothamsted Research for permission to use data from the Electronic Rothamsted Archive and for allowing access to archived grain samples. Rothamsted Research receives grant-aided support from the UK Biotechnology and Biological Sciences Research Council. We are grateful to the Meteorological Office for permission to use data from meteorological stations.