INTRODUCTION
The social ecology and population biology of the common bottlenose dolphin, Tursiops truncatus (Montagu, 1821) have been studied in many locations around the world (reviewed by Connor et al., Reference Connor, Wells, Mann, Read, Mann, Connor, Tyack and Whitehead2000). It is a cosmopolitan species that occurs in temperate and tropical regions, both in coastal and deep waters (Reynolds et al., Reference Reynolds, Wells and Eide2000). Longevity in this species is up to 40 or 50 years, in males and females respectively. Females reach reproductive maturity between five and 13 years of age and males between eight and 13. The gestation period lasts 12 months, resulting in a single calf, with inter-birth intervals typically of three to four years (Connor et al., Reference Connor, Wells, Mann, Read, Mann, Connor, Tyack and Whitehead2000).
Throughout their extensive distribution range, common bottlenose dolphins are usually found in groups between two and 15 animals, although groups of hundreds or thousands have been reported in offshore waters (Scott & Chivers, Reference Scott, Chivers, Leatherwood and Reeves1990; Wells & Scott, Reference Wells, Scott, Ridgway and Harrison1994). Coastal populations form smaller groups, with a fission–fusion dynamic composition, even though some associations may be very stable over the years (Connor et al., Reference Connor, Wells, Mann, Read, Mann, Connor, Tyack and Whitehead2000). Sex, age, reproductive condition, familial relationships, affiliation histories or the formation of coalitions may influence the association patterns of these animals (Connor et al., Reference Connor, Smolker and Richards1992; Wells & Scott, Reference Wells, Scott, Ridgway and Harrison1994; Connor & Whitehead, Reference Connor and Whitehead2005; Whitehead & Connor, Reference Whitehead and Connor2005).
Common bottlenose dolphins in the Sado Estuary region (central continental Portugal) form one of the few resident communities in Europe (Gaspar, Reference Gaspar2003). The first reports of repeatedly recognizable individuals were presented in the early 1980s (Teixeira & Duguy, Reference Teixeira and Duguy1981) and later surveys indicated a clear residency pattern (dos Santos & Lacerda, Reference dos Santos and Lacerda1987). Observations of interactions or exchanges between the resident group and adjacent, sympatric groups have always been rare or inconclusive (Gaspar, Reference Gaspar2003).
Popular and anecdotal sources speak of over 50 dolphins in the area before the 1980s (dos Santos & Lacerda, Reference dos Santos and Lacerda1987) and, using photo-identification, these authors estimated a local population of at least 40 individuals. Gaspar (Reference Gaspar2003) studied animals identified between 1981 and 1997 and listed 37 individuals considered resident at the end of this period. Survival rates varied according to age-class, with lower rates in calves and subadults, and these quantitative analyses supported the notion of rapid decline in this resident community.
Social structure may influence conservation, especially in species where strong bonds exist and local traditions affect movement or mating patterns (Sutherland, Reference Sutherland1998; Whitehead, Reference Whithead2008a). Therefore, any insight into the association patterns within this declining community should be relevant to the evaluation of its survival.
Although this species is listed as ‘Least Concern’ in the 2009 update of the IUCN Red List (IUCN, 2009), local isolated populations of bottlenose dolphins may warrant the status of ‘Critically Endangered’ (Currey et al., Reference Currey, Dawson and Slooten2009). Recognizing the grave condition of the local population in the Sado region, the conservation authority in Portugal, Instituto da Conservação da Natureza e Biodiversidade, has approved an Action Plan to protect and monitor these bottlenose dolphins (Sequeira et al., Reference Sequeira, Matias, Farinha, Gaspar, Silva, Augusto, Ferreira, Fonseca, Narra and Luís2009).
As stated in the Action Plan, while demographic and behavioural information on the bottlenose dolphin community resident in the Sado Estuary is limited, the assessment of its conservation status will benefit from the analysis of its social structure in the greatest detail possible.
With this study we analyse the social structure of this community, relating our results to the available demographic data and considering them from a conservation perspective.
MATERIALS AND METHODS
Study area
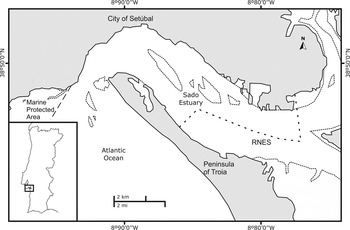
The bottlenose dolphin groups were observed and sampled in the core region of this population's home range: the Sado Estuary and the adjacent coastal waters (Figure 1), where these animals feed and socialize on a year-round basis. The study area covers about 200 km2 and is rather variable in physiography and level of human influence: there is a city front and a busy harbour; long and quiet beaches and rocky shores; shipping lanes and also protected areas. The river mouth, 40 m deep, is located at approximately 38°29′28″N 08°55′28″W. Industrial pollutants, herbicides and pesticides have been accumulating for decades in the water and sediments, reaching high contamination levels in some areas (e.g. Gil & Vale, Reference Gil and Vale2001; Caeiro et al., Reference Caeiro, Costa, Ramos, Fernandes, Silveira, Coimbra, Medeiros and Painho2005).
Map of the study area, on the central western coast of Portugal. The small dotted lines represent mud banks and the broken lines represent Marine Protected Areas and RNES (Natural Reserve of the Sado Estuary).

Data collection
Group composition data, photographic and behavioural records were collected during 40 days, from April 2007 to July 2010, a total of 195 hours, with at least three observers on-board an 8.40-m motor launch. Groups were followed focally from a distance between 50 and 100 m. Using the definition of Shane (Reference Shane, Leatherwood and Reeves1990a, Reference Shane, Leatherwood and Reevesb), groups are sets of individuals in apparent association, moving in the same direction, usually engaged in the same behaviour. Photographic records of the individuals were collected with a digital Nikon D70S or/and a Canon EOS 400D (both with 70–300 mm zoom lenses).
Data analysis
Photographs were used to identify individuals from the marks and scars on their dorsal fins (Würsig & Würsig, Reference Würsig and Würsig1977), and these records were compared to the accumulated photo catalogue started in 1981 and managed jointly by ISPA—Instituto Universitario and Projecto Delfim. Age-class and sex for each individual identified were determined using previous data (e.g. dos Santos & Lacerda, Reference dos Santos and Lacerda1987; Harzen & dos Santos, Reference Harzen and dos Santos1992; Gaspar, Reference Gaspar2003).
The method described in Grellier et al. (Reference Grellier, Hammond, Wilson, Sanders-Reed and Thompson2003) was used to determine maternity. In this method, photographic records from the calf's first sighting until the last sighting the next calendar year were used to calculate coefficients of association (CoAs) using the simple ratio index (p)
 $$p = {x \over y_a + y_b}$$
where x is the number of times a calf (individual A) was seen with another identified animal (individual B), ya the number of times where the calf was sighted without individual B, and yb the number of times where the individual B was sighted without the calf. The sum of ya and yb is noted as n, the total number of times either animal was seen. The standard error of p is estimated as
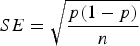 $$SE = \sqrt {{p(1 - p) \over n}}$$
A one tailed z-test was then used to compare the CoAs of the top associates of the calf
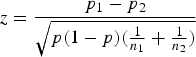 $$z = {p_1 - p_2 \over \sqrt{p(1 - p )({1 \over n_1} + {1 \over n_2})}}$$
This is only considered a good approach when n1 + n2 > 12 (Grellier et al., Reference Grellier, Hammond, Wilson, Sanders-Reed and Thompson2003).
The CoAs are calculated using two different approaches, members of the same group (defined as in Shane, Reference Shane, Leatherwood and Reeves1990a, Reference Shane, Leatherwood and Reevesb) and in the same photographic frame. Analysis was first carried out using groups and, if according to the z-test, the CoA of the top associate was significantly greater than the other associate, the top associate was designated as the calf's mother. If the z-test determined that both top associates had a similar CoA, the analysis was repeated using the photographic frames. If according to the z-test, the CoA of the top associate was not significantly greater than the other associate in both analyses the maternity of the calf remained undetermined.
Photographs allowed the confirmation of estimated group sizes and group composition based on visual counts and identifications. Only data confirmed by photographic evidence were used. Groups were categorized according to the age-classes present (procedure adapted from Félix, Reference Félix1997): big and robust individuals, most of them previously identified and catalogued, were considered adults; less robust and smaller individuals, not in close association with a particular adult, were considered subadults; small individuals, sometimes with fetal folds, in close association with an individual were considered calves. Average group sizes according to class were analysed with a Kruskal–Wallis test (Zar, Reference Zar1996) using Statistica v. 8.0 (StatSoft, Inc.). The null hypothesis is that average group sizes are similar between groups with different age-classes.
Typical group size (see Jarman, Reference Jarman1974, appendix 2), the size as experienced by an individual, was also estimated
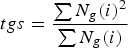 $$tgs = \displaystyle{{\sum {N_g \lpar i\rpar ^2 } } \over {\sum {N_g \lpar i\rpar } }}$$
where N g is the count of the size n of observed groups.
Coefficients of association between dyads were calculated with SOCPROG 2.3 (Whitehead, Reference Whitehead2009) using the half weight index (HWI), considered less biased for this kind of sampling (Cairns & Schwager, Reference Cairns and Schwager1987):
 $$HWI = \displaystyle{x \over {x+{1/2}\left({y_a+y_b } \right)}}$$
in which x is the number of groups where the individuals A and B were seen together, ya the number of groups where the individual A was sighted without the individual B, and y b the number of groups where the individual B was sighted without the individual A.
Coefficients vary between 0 (individuals never seen together) and 1 (individuals always seen together). Only individuals identified in more than 20 photographs were used. The standard error associated with each CoA was calculated using the binomial approach:
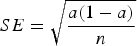 $$SE=\sqrt {\displaystyle{{a\lpar 1 - a\rpar } \over n}}$$
in which a is the calculated CoA and n is the total number of times either animal was seen.
The randomness of CoAs was tested using the preferred/avoided associations test (Bejder et al., Reference Bejder, Fletcher and Bräger1998; Whitehead, Reference Whitehead1999; Whitehead et al., Reference Whitehead, Bejder and Ottensmeyer2005). The null hypothesis for this test is that associations between pairs of individuals are random, and it is refuted if the standard deviation of the calculated coefficients is significantly higher than those from the permuted data. The routine chosen is SOCPROG 2.3 tests for both short and long term associations. If the standard deviation of calculated associations is significantly higher than the permutated data, the associations are long term preferred; if the mean association of calculated CoAs is significantly lower than the permutated, the associations are short term preferred.
Gregariousness, or differences in sociality between individuals (Whitehead et al., Reference Whitehead, Bejder and Ottensmeyer2005) was tested, in order to look for individuals that may be consistently found in groups larger or smaller than the typical (sensu Jarman, Reference Jarman1974), also using data from the permutation tests. The null hypothesis is that all individuals are found in groups with a similar distribution of sizes. It is refuted when the standard deviation of typical group size (SDtgs) has unexpectedly high values that are significantly different from the permutated data.
Accuracy of the social representation was assessed using r, the correlation coefficient between the estimated CoAs and the true CoAs (the proportion of time a pair is actually associated) (Whitehead, Reference Whitehead2008b).
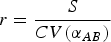 $$r = \displaystyle{S \over {CV\lpar \alpha _{AB} \rpar }}$$
in which S is the social differentiation, the estimated CV of the true CoAs and CV(αAB) the CV of estimated CoAs. Values vary between 0, not an accurate representation, to 1, an excellent representation.
S indicates how variable the CoAs are within a population. Values smaller than 0.3 indicate CoAs between individuals are similar, so relationships within the population are homogeneous, S greater than 0.5 indicates that relationships are well varied and a S greater than 1 represents very varied and differentiated relationships (Whitehead, Reference Whitehead2008b).
Social organization of the community was graphically displayed in a dendrogram using average linkage hierarchical cluster analysis (Morgan et al., Reference Morgan, Simpson, Hanby and Hall-Craggs1976; Colgan, Reference Colgan and Colgan1978). To assess the level of division of the population into communities the modularity of the clustering was calculated (Newman, Reference Newman2004, Reference Newman2006). Modularity, modified for weighted networks and applied to coefficients of association, can be described as the difference between the expected proportion of association within clusters—in this case, sets of individuals—and the proportion obtained with the data (Newman, Reference Newman2006). A modularity different from zero indicates that there is a deviation from random, but only values superior to 0.3 are considered good indicators of division. The maximum modularity possible is 1, when members of different clusters do not associate. For these analyses only individuals that are currently alive and are not calves were taken into account, since the low CoAs from deceased individuals are not caused by avoidance of others, and calves associate closely with their mothers during their first years, thus they do not truly reflect the association patterns.
To model how associations vary with time a standardized lagged association rate (SLAR) analysis was performed (Whitehead, 1995) using all available data. This rate is the probability that, if two individuals, A and B, are associated at a particular time, then τ units of time later, a randomly chosen association of individual A will be B. The sampling period used was 1 hour, and the SLAR was compared to the null association rate, i.e. the SLAR if associations were random.
The SLAR obtained was also compared with theoretical models of different types of social structure (Whitehead, Reference Whithead1995). To assess which was the one most similar to our data the quasi-Akaike information criterion (QAIC) was calculated. The model that minimized this criterion was considered the best fit (Whitehead, Reference Whitehead2007). The fit of the other models was also assessed using the variation of QAIC (ΔQAIC). If ΔQAIC is between 0 and 2 there is substantial support for the model, if it is between 4 and 7 it has considerably less support and if it is larger than 10 it has no support (Burnham & Anderson, Reference Burnham and Anderson2002).
RESULTS
Community composition and demographic structure
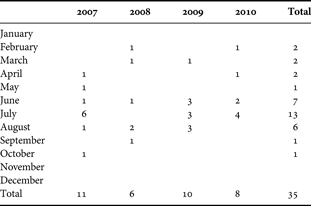
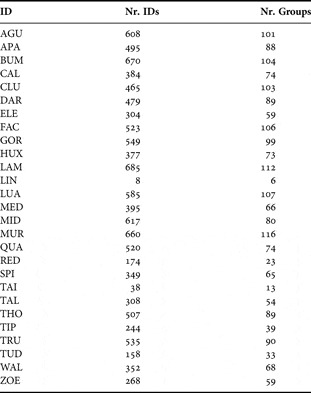
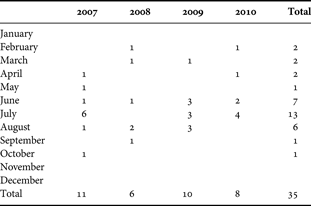
A complete census revealed that the Sado resident community is currently composed of 24 individuals. A total of 13,035 photographs, collected from April 2007 to July 2010 (Table 1), were analysed, 63% of which were used for photo-id purposes. From these, 11,303 identifications of 27 individuals were obtained (Table 2). However, during the sampling period three of the individuals disappeared (LIN, RED and TUD). All individuals were identified on the first sampling day, except the calves born in the summer of 2007—HUX and LIN—summer of 2010—TAI; and an individual—TIP—who returned to the community in June 2007 after an apparent absence of at least one year.
Monthly distribution of sampling effort from 2007 to 2010.
Photoidentifications for each individual identified in the population, from April 2007 to July 2010. ID, identification of individual; Nr. IDs, number of photographs where the individual was identified in; Nr. Groups, number of groups where the individual was identified in.

Currently, this community comprises 79.2% adults, 12.5% subadults and 8.3% calves, so one of its most striking features is the vast majority of adults. Half of the current community (and 63.1% of adults) have been observed since the 1980s, their first sighting varying from 1981 to 1985. These individuals were already adults at the time of first sighting, so they should be at least currently 30 years old. The sex of most individuals is unknown (58.3%), and most of those identified are females (29.2%).
Testing for maternity of calves
According to the maternity test, GOR is DAR's mother (Table 3) and AGU is HUX's mother (Table 3). It was not possible to pinpoint LIN's mother because of the calf's low number of identifications and the analysis for TAI could not be carried out because the test is only performed with photographic records spanning a period of over one year.
Maternity test according to Grellier et al. (Reference Grellier, Hammond, Wilson, Sanders-Reed and Thompson2003). Significant test results are marked in bold (z0.05 = 1.64). F. 1 High., female with the highest coefficient of association (CoA) with the calf; F. 2 High., female with the second highest CoA with the calf; p, CoA using simple ratio; n1, total number of times F.1 High and calf were seen together; n2, total number of times F.2 High and calf were seen together; z, unicaudal z-test result.

Group size and associations
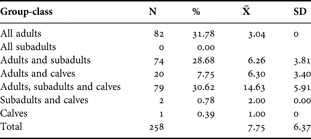
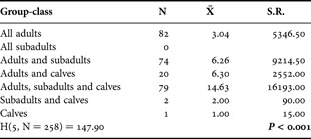
A total of 258 groups was analysed, their size varying between one and 26 individuals. Average group size was 7.75 ± 6.37 (Table 4), i.e. about 1/3 of the community size. Typical group size for this community is 12.97, i.e. just over half of the community size. The most frequent group categories were ‘All adults’ and ‘Adults, subadults and calves’ while the less frequent were ‘Subadults and calves’ and ‘Calves’ (Table 4). No groups with ‘Subadults only’ were recorded. According to the Shapiro–Wilk normality test (P < 0.001), the size distribution according to classes is not normal, so a non-parametric approach was used, through a Kruskal–Wallis test. Average group size varies according to class (Table 5): groups with adults, subadults and calves have the largest average size in this community.
Groups according to classes for data from 2007 to 2010. N, number of samples; %, percentage of group-class in the sample;  , average group size; SD, standard deviation.

Kruskal–Wallis test results for average group size according to classes. Significant P value for 0.05 significance is marked in bold. N, number of samples; , average group size; S.R., sum of ranks; H, Kruskal–Wallis statistics; P, P value.

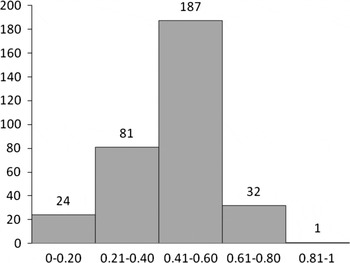
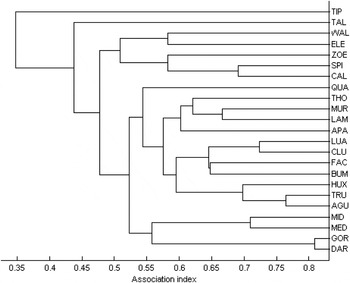
The association matrix resulting from the HWI (see Appendix) has an average of 0.45 ± 0.15. Most of the CoAs are medium (0.41–0.60) and there is only one high CoA (>0.81) (Figure 2). The association patterns are displayed in a dendogram (Figure 3), which represents the data accurately, with a cophenetic correlation coefficient of 0.83.
Coefficients of association classified according to Quintana-Rizzo & Wells (Reference Quintana-Rizzo and Wells2001): low 0.01–0.20; medium–low 0.21–0.40; medium 0.41–0.60; medium–high 0.61–0.80; and high 0.81–1.

Dendrogram of the hierarchical cluster analysis using average linkage for all individuals currently alive in the population, except calves. The x axis represents the coefficients of association values, and the y axis represents the individuals.

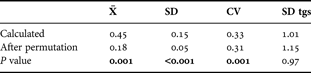
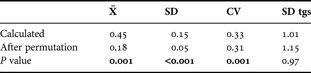
SOCPROG estimated a correlation value of 0.942 between the CoAs calculated using our sampled data and the true associations, so the calculated CoAs are a good representative of the real ones and conclusions drawn from them can be applied to the community. The permutation tests determined that associations between dyads are preferred and long term, since the standard deviation of calculated CoAs is significantly higher than the permutated dataset (Table 6). There are no differences in gregariousness in this community, since the SDtgs is low and has a corresponding low value when compared to the permutated data (Table 6). This community has a homogeneous structure, with a social differentiation value of 0.38. Cluster analysis does not show a clear division in the community, given the maximum modularity of 0.05.
Preferred/avoided associations test—comparison between real and permutated coefficients of association (CoAs). Permutated data were calculated using 1000 random permutations and 10,000 trials per permutation. Significant P values for 0.05 significance are marked in bold. , average CoAs; SD, standard deviation; CV, coefficient of variation; SD tgs, standard deviation of typical group size.
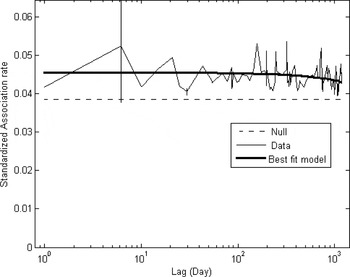
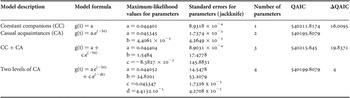
The SLAR analysis shows that association rates vary through time, but remain above the null rate until at least 1000 days (Figure 4). The large error bars at the seven day mark reflect the structure of the data. Since there are not many consecutive sampling days, how associations vary on the short term is not very well understood. The error bars become smaller because the longer the time frame, the more data were collected, hence our understanding of variation in associations increased. The best fit model for the associations in this community is the one consisting of casual acquaintances (Table 7), g(t) = a.e(−bt) = 0.045345.e−(t.4.4061×10(−5)). In this scenario, the duration of associations can be estimated by 1\b (Whitehead, Reference Whithead2008a). Given that b = 4.4061×10⁻⁵ associations last approximately 34 days in this community.
Standardized lagged sssociation rate (SLAR) for all individuals. Error bars were calculated using the jackknife technique. The null association rate represents the theoretical SLAR if individuals associated randomly. The maximum-likelihood best fit model represents casual acquaintances.

Fit of social models to the standardized lagged association rate for the community. t, time in days; QAIC, quasi-Akaike information criterion; ΔQAIC, variation of QAIC between the current model and the best fit; g, SLAR.

DISCUSSION
A complete census of the Sado resident community of bottlenose dolphins has been conducted, with an analysis of the available demographic information and of social structure from April 2007 to July 2010.
This is not only a very small, but also an aged community, since 63.1% of adults are, at least, 30 years old. During the 1990s none of the calves born in this community survived for more than two years (Gaspar, Reference Gaspar2003), causing the current imbalance between age-classes. Still, there is no evidence of reproductive senescence in this species, as females may be reproductively active until their late forties (Cockcroft & Ross, Reference Cockcroft and Ross1990; Wells & Scott, Reference Wells, Scott, Ridgway and Harrison1994; Reynolds et al., Reference Reynolds, Wells and Eide2000), so it is not unreasonable to expect them to be reproductively active after that age. This notion is supported by the fact that AGU was estimated to be at least 31 years old when HUX was born and that GOR was estimated to be at least 27 years old when DAR was born.
Since these dolphins have been studied there was only one documented case of an individual that was seen with an adjacent, non-resident group and then returned to the resident community (Gaspar, Reference Gaspar2003). During our sampling period only one animal was apparently absent for at least one year, possibly joining other groups. However, no contacts between resident and non-resident animals have been observed in this study. Most likely this community is strongly phylopatric and has been essentially closed. However, considering the likely relevance of those exchanges, even if they are rare, the term community (referring to a group of animals in which most individuals interact with most others: Whitehead, Reference Whithead2008a, p. 14), instead of population, is perhaps the most adequate designation for the biosocial status of these dolphins.
Average group size is similar to previous studies in the Sado area (dos Santos & Lacerda, Reference dos Santos and Lacerda1987; Harzen, Reference Harzen1995) and similar to the one recorded in previous studies elsewhere (Scott & Chivers, Reference Scott, Chivers, Leatherwood and Reeves1990; Wells & Scott, Reference Wells, Scott, Ridgway and Harrison1994), but the typical group size (as experience by the individuals) is much larger, just over half of the current community size. Large groups with all age-classes are quite common, possibly representing a calf and subadult protection strategy, as suggested by Kerr et al. (Reference Kerr, Defran and Campbell2005) and Gowans et al. (Reference Gowans, Würsig and Karczmarski2008). Younger classes have had a high mortality rate in the last decade, and contamination, fishing nets and other forms of habitat degradation are all possible causes (Gaspar, Reference Gaspar2003). The non-existence of ‘Subadults only’ groups in this study period may also be related to this protection strategy.
Interestingly, according to the results of the maternity tests, GOR and AGU adopted different strategies with their calves. Since the GOR could be determined as DAR's mother using only associations based on group membership it means the pair spent a considerable amount of time separate from other groups, while the opposite happened with AGU. She could only be identified as HUX's mother using data on photographic frames, so the pair was found consistently in groups with other individuals but in close spatial association.
It is unclear why these females adopted different strategies, but it is possible that patterns of association could change according to the calf's age. We know that DAR was born in summer 2006, but data available for this analysis were only recorded since March 2007. Therefore, results for the maternity test might be reflecting the parenting strategy after the first six months of the calf's life.
Bottlenose dolphin societies are characterized by a fission–fusion dynamic, with group membership varying within a very small time frame, leading to low association coefficients between pairs of individuals (with the exception of some long lasting bonds, usually between alliance forming males and mother–calf pairs) and consequently to a low average coefficient of association for the community.
The Sado community shows a different social organization. It presents an average coefficient of association of 0.45, higher than other resident communities, which vary between 0.1 and 0.3 (Smolker et al., Reference Smolker, Richards, Connor and Pepper1992; Félix, Reference Félix1997; Connor et al., Reference Connor, Wells, Mann, Read, Mann, Connor, Tyack and Whitehead2000; Quintana-Rizzo & Wells, Reference Quintana-Rizzo and Wells2001; Chilvers & Corkeron, Reference Chilvers and Corkeron2002; Eisfeld & Robinson, Reference Eisfeld and Robinson2004). It is also higher than what was previously calculated for this resident community (Harzen, Reference Harzen1995), when its size was larger and most similar to Doubtful Sound's population (0.47 ± 0.04) (Lusseau et al., Reference Lusseau, Schneider, Boisseau, Haase, Slooten and Dawson2003). A small community size influences the associations only up to a point. A good estimator of the average coefficient of associations for a population is typical group size divided by population size minus 1 (Whitehead, Reference Whithead2008a). So, coefficients of association are affected not only by population size—the smaller the population, the larger the average coefficient—but also by typical group size. It is possible to have a small population size with a low average coefficient of association if the typical group size is also small. For example, if this population had a typical group size of 8 individuals (similar to average group size) the average coefficient of association would be closer to 0.3, which would be an average value for this species.
Given the social differentiation, relationships within this community are homogeneous, so pairs of individuals have similar associations. There are no differences in gregariousness, so all individuals have a similar typical group size. These are all atypical traits for bottlenose dolphin societies, in which association patterns are commonly influenced by factors such as the age and sex of the individuals.
Associations are also preferred and long term, so individuals associate in a non-random and preferential way, with associations lasting for approximately 34 days, according to the SLAR. The patterns of association seem to be best described as casual acquaintances, individuals that associate for a period of time, dissociate after it and may reassociate afterwards. This obviously reflects the fission–fusion dynamic typical for these societies, although even more stable than previously reported (Harzen, Reference Harzen1995). Community size is known to influence fission–fusion societies in wild chimpanzees (Lehman & Boesch, Reference Lehman and Boesch2004). Cohesiveness increases and fission–fusion patterns become less flexible with small communities. It is possible that community size has been influencing the Sado social structure in the same manner.
The only bottlenose dolphin population that, so far, has been found to have a stable social structure is resident in Doubtful Sound (Lusseau et al., Reference Lusseau, Schneider, Boisseau, Haase, Slooten and Dawson2003). Other resident bottlenose dolphin populations have much more fluid social structures, as is reflected by their low average CoA (Smolker et al., Reference Smolker, Richards, Connor and Pepper1992; Félix, Reference Félix1997; Connor et al., Reference Connor, Wells, Mann, Read, Mann, Connor, Tyack and Whitehead2000; Quintana-Rizzo & Wells, Reference Quintana-Rizzo and Wells2001; Chilvers & Corkeron, Reference Chilvers and Corkeron2002; Eisfeld & Robinson, Reference Eisfeld and Robinson2004). Although the Sado community does not show as long lasting associations, they still last longer than would be expected in a typical fission–fusion society and it is interesting to compare both populations. There are several parallelisms between the resident population in Doubtful Sound and in the Sado Estuary. They are both small, nearly closed and phylopatric, although Doubtful Sound still has a population of 65 individuals (Lusseau et al., Reference Lusseau, Schneider, Boisseau, Haase, Slooten and Dawson2003). The main difference relates to the habitat type. While Doubtful Sound is a fjord with highly variable spatial and temporal productivity, the Sado Estuary provides stable feeding resources for the bottlenose dolphins throughout the year. With a decreasing number of individuals in such a stable feeding ground, it is likely that intraspecific competition has diminished, resulting in a high typical group size and increasing the stability of the association patterns (Perrin & Lehmann, Reference Perrin and Lehmann2001; Gowans et al., Reference Gowans, Würsig and Karczmarski2008). The closed and phylopatric nature of this community, and its dependence on its habitat, affects its social structure but it also renders it more fragile, as it is unlikely to benefit from immigration or exchanges with other groups. If contact with other groups is happening, in order for it to not be detected in the present study, it must be sporadic or located in a time frame when sampling was not performed—nighttime or winter. Future work should focus on collecting data on coastal non-resident groups and their possible interactions with the resident community. This would make it possible to apply social network models and determine how the Sado community interacts with neighbouring groups. It would be interesting to assess if contacts are carried out by specific individuals—brokers (Lusseau & Newman, Reference Lusseau and Newman2004)—instead of by the community as a whole and to model how contacts are affected by the loss of certain individuals. Different individuals may have different connectivity within or between communities and their removal may cause grave effects on the community (Lusseau & Newman, Reference Lusseau and Newman2004). Contacts might have a particular importance for this community, especially at this low number of individuals.
In Little Bahama Bank, two hurricanes caused the loss of 30% of a population that comprised only one community (Elliser & Herzing, 2010). The remaining individuals formed two separate communities, each integrating immigrants. This population initially comprised 190 individuals, a much larger number than the Sado community. It also had a more fluid social structure and it was not geographically or demographically isolated from other populations, which may explain why immigrants were so well accepted.
It would be likely that if the Sado community size continues decreasing the fission–fusion dynamics will continue stabilizing, but how it would affect contacts with other populations is still unknown.
With this study we show how the social structure of the Sado community is affected by its demography. Its small and declining size, in a stable feeding ground, has led to a decrease in intraspecific competition and, consequently, to a more stable association pattern of fission–fusion dynamics. We believe that detailed information on the social structure of this community will promote a better understanding of its conservation perspectives which may depend on contacts with non-resident groups.
ACKNOWLEDGEMENTS
We are grateful to all our colleagues who participated in the fieldwork and data collection, especially Miguel N. Couchinho, Ana Rita Luís, Cecília V. Ferreira, Sónia Louro, Ana Teresa Cândido, Erica Sá and Carina Silva. Thanks are due to Miguel N. Couchinho for the map of the study area, to Hal Whitehead for his comments on the final draft, and to the anonymous referees who helped to improve the manuscript. We also acknowledge with gratitude all the current supporters of Projecto Delfim, especially Zoomarine, Alcatel, Via Verde and Companhia das Sandes. This work was supported by the Portuguese Foundation for Science and Technology (FCT) (Grant number MAR-LVT-Lisboa-331), and by private sponsors (Zoomarine-Portugal and Alcatel).
Appendix
Matrix with the coefficients of association using the half weight index, for all the individuals of the community with more than 20 photographic identifications.