The interaction between polysaccharides and clay minerals plays an important role in soil structuring, organic matter stabilization, nutrient retention and contaminant immobilization. Previous studies have shown that saccharides and other biomolecules can associate strongly with mineral surfaces through hydrogen bonding, electrostatic interactions and cation-mediated bridging (Parfitt & Greenland, Reference Parfitt and D.J1970; Dontsova & Bigham, Reference Dontsova and J.M2005; Godek et al., Reference Godek, Grządka and Maciołek2022; Trambitski et al., Reference Trambitski, Kizinievič and Kizinievič2026). Among the clay minerals, montmorillonite (MMt) is especially relevant because its expandable interlayer region offers a nanoconfined environment whose accessibility depends on the hydration state, swelling behaviour and coordination properties of the exchangeable cation (Kharroubi et al., Reference Kharroubi, Balme, Henn, Giuntini, Belarbi and Haouzi2009; Pei et al., Reference Pei, Sun, Xu and Sun2024; Machahary et al., Reference Machahary, Sarkar, Das and Basumatary2025; Slaný et al., Reference Slaný, Jankovič, Matejdes, Žemlička and Madejová2025; Wani et al., Reference Wani, Maheepala, Imtiyaz, Rallapalli, Jadda and Robert2025; Amrani et al., Reference Amrani, Elkabous, Essifi, Azerkane, Karzazi and Gharibi2026; Li et al., Reference Li, Zhang, Chen, Miao, Wang and Kuang2026; Zheng et al., Reference Zheng, Xie, Yu, Xiao, Yu and Wang2026). Although the hydration and swelling of homoionic MMts have been extensively investigated, much less attention has been paid to how the identity of the interlayer cation controls the uptake of small saccharides and the resulting transport properties of the clay. In particular, direct comparisons across the complete alkali series remain scarce, and studies coupling adsorption, structural characterization, thermal analysis and electrical transport on the same set of glucose-loaded homoionic samples are still lacking. This gap is significant because glucose, as a small polyhydroxylated probe molecule, is well suited to revealing how cation size, hydration strength and interlayer accessibility jointly control host–guest interactions in MMt. Beyond adsorption amount alone, such coupled interactions may also influence interlayer structural organization and ionic transport behaviour, which remain comparatively less explored across the complete alkali series under identical experimental conditions. Clarifying these effects is relevant both for understanding saccharide stabilization in natural clay-rich environments and for designing bio–clay hybrid materials with tuneable structural and transport properties.
In this context, the present study investigates how exchangeable alkali cations (Li+, Na+, K+, Rb+ and Cs+) regulate glucose uptake in homoionic MMt and how this uptake is reflected in the structural, thermal and electrical responses of the clay system. Glucose adsorption was examined in parallel with X-ray diffraction (XRD), differential thermal analysis (DTA), Fourier-transform infrared (FTIR) spectroscopy and broadband impedance spectroscopy. By comparing the complete alkali series under identical conditions, this work goes beyond reporting adsorption capacities alone and instead identifies cation-dependent relationships among glucose uptake, basal spacing, thermal response and direct current (DC) ionic conductivity. The novelty of the present study lies not only in the comparison of glucose uptake across the complete alkali series, but also in the combined adsorption–structure–transport investigation performed under identical experimental conditions. The coupled analysis of equilibrium uptake, interlayer structural reorganization, thermal response and ionic transport provides a broader comparative framework for understanding cation-dependent saccharide–clay interactions in MMt.
Materials and methods
Preparation and characterization of homoionic MMt
The complete series of alkali-exchanged MMt samples used in this study was prepared according to the procedure previously described in Kharroubi et al. (Reference Kharroubi, Balme, Henn, Giuntini, Belarbi and Haouzi2009). The starting material was the reference clay SWy-2 supplied by the Clay Minerals Society (Wyoming source clay). Briefly, the raw MMt was dispersed in deionized water, followed by sedimentation and centrifugation steps to isolate the ≤2 μm clay fraction (Kharroubi et al., Reference Kharroubi, Balme, Henn, Giuntini, Belarbi and Haouzi2009). The purified fraction was subsequently subjected to cation-exchange treatments using successive 1 M aqueous MCl solutions (M = Li+, Na+, K+, Rb+ or Cs+) to obtain the corresponding homoionic forms. Each exchange step was repeated several times to ensure complete replacement of the natural interlayer cations. The resulting samples were thoroughly washed with deionized water until chloride-free (AgNO3 test) and then dried at 60°C. The chemical composition of the alkali-exchanged MMt samples was determined by elemental analysis. Structural formulae were calculated using the Mauguin method (Slaný et al., Reference Slaný, Jankovič, Matejdes, Žemlička and Madejová2025). The homoionic MMts used in this study were previously characterized by elemental analysis, structural formula calculation, dehydration thermodynamics and XRD, confirming the successful preparation of the homoionic forms (Kharroubi et al., Reference Kharroubi, Balme, Henn, Giuntini, Belarbi and Haouzi2009). Detailed compositional data are also available in Kharroubi et al. (Reference Kharroubi, Balme, Henn, Giuntini, Belarbi and Haouzi2009).
Glucose adsorption experiments
Analytical-grade glucose and deionized water were weighed separately with a precision of ±0.01 g to prepare the adsorption solutions. The adsorption kinetics of glucose onto the various alkali-exchanged MMt samples were investigated under controlled conditions. Briefly, 1.5 g of homoionic clay was dispersed in 120 mL of an aqueous glucose solution of initial concentration 2 g L–1 at pH 7. The suspensions were continuously stirred at room temperature to ensure homogeneous contact between the solid and liquid phases. At predetermined time intervals, aliquots were withdrawn and centrifuged at a relative centrifugal force of 3075 g for 10 min to separate the solid phase. The residual glucose concentration in the supernatant was determined using an enzymatic glucose oxidase assay kit (GAGO20; Sigma-Aldrich, n.d.). Absorbance measurements were performed with a JASCO V-570 UV–Vis spectrophotometer at a scanning rate of 1 nm s–1. The amount of adsorbed glucose at time t, qt (mg g–1), was calculated according to Equation 1:
 \begin{equation}{q_t} = \frac{{V\left( {{C_0} - {C_t}} \right)}}{m}\end{equation}
where C 0 and Ct (mg L–1) are the initial and time-dependent glucose concentrations, respectively, V (L) is the solution volume and m (g) is the mass of the adsorbent. The equilibrium adsorption amount, qe, was determined in the same way using the equilibrium concentration Ce. The reported adsorption values correspond to measurements performed under identical experimental conditions and were used for comparative analysis across the complete alkali series.
Characterization methods
Thermal analysis
DTA and thermogravimetric analysis (TGA) were performed using a Setaram Labsys™ differential scanning calorimetry instrument. Approximately 40 mg of sample was heated from 25°C to 900°C at a heating rate of 10°C min–1 under an air atmosphere.
X-ray diffraction
XRD measurements were carried out using a Philips X’Pert diffractometer equipped with Cu-Kα radiation (λ = 1.5406 Å). XRD traces were recorded in the 2θ range of 4°–70° using a step size of 0.02° and a counting time of 55 s per step. All measurements were performed at room temperature. The interlayer spacing (d 001) was calculated from the position of the basal reflection using Bragg’s law.
FTIR spectroscopy
FTIR spectra of the adsorbents and glucose-loaded samples were recorded in the range 4000–400 cm–1 using a PerkinElmer System 2000 FTIR spectrometer and the KBr pellet method. The KBr was previously dried to remove residual moisture. The sample–KBr mixture was finely ground and compressed under a pressure of 8 tons using a hydraulic press to form transparent pellets. Spectra were recorded immediately after pellet preparation to minimize atmospheric moisture interference.
Electrical conductivity measurements
Electrical measurements were obtained using a Novocontrol Broadband Dielectric Spectrometer (BDS 4000). Alternating current (AC) conductivity was recorded over the frequency range 10–2–106 Hz at various constant temperatures. DC conductivity values were extracted from the low-frequency plateau of the AC conductivity spectra. Pellets were prepared by uniaxial compaction (up to 5 tons) of the ≤2 μm homoionic alkali-exchanged MMt powders. Platinum electrodes (≈ 0.1 μm thickness) were deposited on both sides of the pellets by sputtering to ensure good electrical contact.
Prior to each measurement, the pellets were dried at 393 K for 2 h under dry N2 flow to minimize the contribution of weakly adsorbed water. The samples were then rapidly cooled to 173 K before data acquisition. These dehydration conditions are comparable to those reported previously (Kharroubi et al., Reference Kharroubi, Balme, Henn, Giuntini, Belarbi and Haouzi2009), where heating at 353–393 K for 2 h was shown to significantly reduce the amount of adsorbed water in homoionic MMt samples. For glucose-loaded samples, the same thermal pretreatment was applied prior to impedance measurements to maintain controlled dehydration conditions while remaining below the onset temperature of glucose caramelization. Therefore, the conductivity data reported here correspond to thermally conditioned glucose-containing samples under controlled, partially dehydrated conditions rather than to fully hydrated equilibrium states. Accordingly, the conductivity results discussed later should be interpreted as reflecting thermally conditioned interlayer transport environments rather than fully hydrated equilibrium transport behaviour.
Results and discussion
Adsorption kinetics
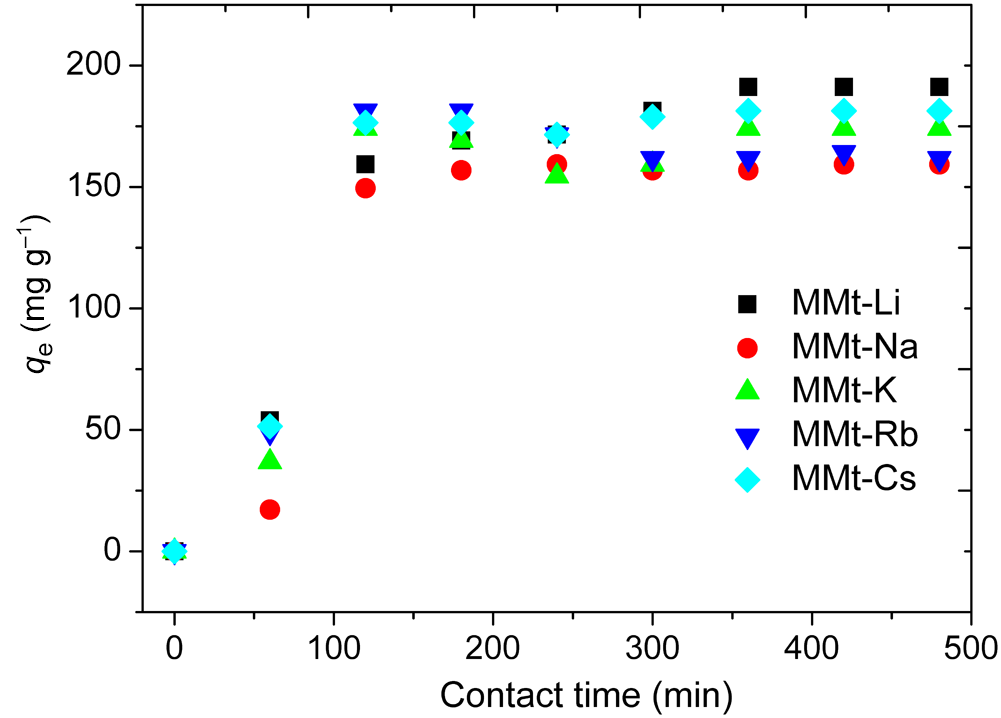
Figure 1 presents the adsorption kinetics of glucose in the series of homoionic MMt samples at an initial glucose concentration of 2 g L–1. A rapid increase in glucose uptake was observed during the early stage of contact, especially within the first 2 h, which may be attributed to the abundance of readily accessible adsorption sites. Thereafter, the adsorption rate gradually decreased as these sites became progressively occupied, and equilibrium was reached after ∼6 h. This contact time was therefore retained for the subsequent adsorption experiments. At equilibrium, the Li-form showed the highest glucose uptake, whereas the Na-form exhibited the lowest adsorbed amount under the investigated conditions. Importantly, the adsorption trend does not follow a simple monotonic evolution with cation radius, which already suggests that glucose uptake is governed by a combination of hydration, interlayer accessibility and host–guest interactions rather than by ionic size alone. The adsorption kinetic data were analysed using the pseudo-first-order (PFO) and pseudo-second-order (PSO) models to estimate the kinetic parameters and equilibrium adsorption capacities of the various homoionic MMt samples. These models are widely used to describe adsorption kinetics and to compare adsorption behaviour under various experimental conditions (Revellame et al., Reference Revellame, Fortela, Sharp, Hernandez and Zappi2020; Chu et al., Reference Chu, Hashim and A.A2026).
Effect of contact time on glucose adsorption onto alkali-exchanged homoionic MMt samples.

The PFO model assumes that the adsorption rate is proportional to the number of unoccupied sites, and it is often used to describe systems dominated by physisorption or external mass-transfer effects (Chu et al., Reference Chu, Bollinger and Kierczak2025). Its linear form is given by Equation 2:
 \begin{equation}\ln \left( {{{{q}}_{\textrm{e}}} - {q_t}} \right) = \ln {q_{\textrm{e}}} - {{{K}}_1}t\end{equation}
where q e (mg g–1) and qt (mg g–1) represent the amounts of glucose adsorbed per unit mass of adsorbent at equilibrium and at time t, respectively, and K1 (min–1) is the first-order rate constant. A plot of  $\ln \left( {{q_\textrm{e}} - {q_t}} \right)$ vs t yields a straight line whose slope gives K1.
The PSO model assumes that the adsorption rate depends on the square of the number of available sites. Its linear form is given by Equation 3:
 \begin{equation}\frac t{q_t}=\frac1{q_{\mathrm e}^2{\mathrm k}_2}+\frac t{q_\textrm{e}}\end{equation}
where q e (mg g–1) is the equilibrium adsorption capacity, qt (mg g–1) is the amount adsorbed at time t and k2 (g mg–1 min–1) is the PSO rate constant. The equilibrium capacity q e and k 2 can be obtained from the slope and intercept of the plot of t/qt vs t.
As shown in Fig. 2a,b & Table 1, the PSO model provided a better fit to the experimental data than the PFO model for all homoionic MMt samples. The higher R 2 values and the better agreement between experimental and calculated equilibrium adsorption amounts support the use of the PSO model as the most appropriate fitting framework under the investigated conditions. Nevertheless, adsorption kinetic models such as the PFO and PSO models should not be overinterpreted in mechanistic terms, as they mainly provide mathematical descriptions of the experimental rate data (Wang & Guo, Reference Wang and Guo2020; Vareda, Reference J.P2023). The important point here is therefore the robust cation-dependent difference in adsorption behaviour across the alkali series, with Li and Cs representing the highest-uptake end-members under identical experimental conditions. The present study was designed primarily as a comparative investigation across the complete alkali series under identical conditions rather than as a full adsorption thermodynamic study. Future work including extended adsorption isotherms would further clarify the respective roles of affinity, capacity and interlayer accessibility.
(a) PFO and (b) PSO kinetic plots for glucose adsorption onto homoionic MMt.

Figure 2 Long description
The image A showing a line graph labeled a). The horizontal axis label is Time (min), with values 0 to 600. The vertical axis label is ln(qe minus qt), with values negative 3 to 3. A legend lists MMt-Li-glucose, MMt-Na-glucose, MMt-K-glucose, MMt-Rb-glucose, MMt-Cs-glucose and Linear fit. The plotted markers for all listed MMt glucose samples follow downward-sloping linear fit lines as time increases. Marker shapes differ between the listed samples, matching the legend entries. The plotted time values appear between about 0 and 500 minutes. The image B showing a line graph labeled b). The horizontal axis label is Time (min), with values 0 to 600. The vertical axis label is t over qt, with values 0 to 3.5. A legend lists MMt-Li-glucose, MMt-Na-glucose, MMt-K-glucose, MMt-Rb-glucose, MMt-Cs-glucose and Linear fit. The plotted markers for all listed MMt glucose samples follow upward-sloping linear fit lines as time increases. Marker shapes differ between the listed samples, matching the legend entries. The plotted time values appear between about 0 and 500 minutes. Both images show the same set of MMt glucose sample labels and a Linear fit entry, with time on the horizontal axis in minutes.
Kinetic parameters derived from the PFO and PSO models for glucose adsorption onto homoionic MMt.

Table 1 Long description
Kinetic parameters for glucose adsorption are listed for five homoionic MMt samples (Li, Na, K, Rb, Cs) using two kinetic models, PFO and PSO, alongside the experimental equilibrium uptake. Experimental equilibrium uptake ranges from 159.32 milligrams per gram (Na) to 185.37 milligrams per gram (Li), with Cs also high at 181.37 milligrams per gram. The PSO model shows consistently excellent fit for all samples, with R squared values from 0.995 (K) to 0.999 (Li, Na, Rb, Cs), whereas the PFO model fits more weakly, with R squared from 0.800 (K) to 0.961 (Li). PSO calculated equilibrium uptake is closest to the experimental value for K (both 174.01) and Cs (185.18 versus 181.37), while PFO calculated values are generally lower than experimental, especially for Cs (125.03 versus 181.37) and Na (130.60 versus 159.32). PFO rate constants range from 0.010 to 0.020, with Na highest, but this does not correspond to a better PFO fit. PSO rate constants span from 1.11 times ten to the minus four (Li) to 1.01 times ten to the minus three (Na). Comparisons are limited to these model parameters and goodness of fit; they do not by themselves confirm adsorption mechanism without additional evidence.
q e cal = calculated values at equilibrium (mg g–1); q e exp = experimental values at equilibrium (mg g–1).
Thermal behavior
The DTA thermograms of the homoionic MMt samples before and after glucose adsorption are shown in Fig. 3, and the corresponding temperatures of the main thermal events are listed in Table 2. For all samples, two major thermal effects were observed. The first endothermic event, located at low temperature (∼88–92°C for the unloaded samples), is attributed to the loss of adsorbed and interlayer water. The second event, occurring at higher temperature (623–663°C), corresponds to the dehydroxylation of the clay structure.
DTA curves of homoionic MMt samples before and after glucose adsorption: (a) MMt-Li, (b) MMt-Na, (c) MMt-K and (d) MMt-Cs. The corresponding DTA curve for MMt-Rb is provided in the Supplementary Material.

Figure 3 Long description
The image A showing a line graph labeled a). X axis label: Temperature (degree Celsius). Range: 0 to 900. Y axis label: Heat flow (microvolt). Range: negative 10 to 10. Legend text: MMt Li; MMt Li glucose. Plotted elements: two lines. MMt Li glucose: (100, negative 10), (900, 9). MMt Li: (100, negative 4), (900, negative 3). The image B showing a line graph labeled b). X axis label: Temperature (degree Celsius). Range: 0 to 900. Y axis label: Heat flow (microvolt). Range: negative 10 to 10. Legend text: MMt Na; MMt Na glucose. Plotted elements: two lines. MMt Na glucose: (100, negative 9), (900, 9). MMt Na: (100, negative 4), (900, negative 4). The image C showing a line graph labeled c). X axis label: Temperature (degree Celsius). Range: 0 to 900. Y axis label: Heat flow (microvolt). Range: negative 6 to 12. Legend text: MMt K; MMt K glucose. Plotted elements: two lines. MMt K glucose: (100, negative 4), (900, 10). MMt K: (100, negative 3), (900, negative 2). The image D showing a line graph labeled d). X axis label: Temperature (degree Celsius). Range: 0 to 900. Y axis label: Heat flow (microvolt). Range: negative 6 to 8. Legend text: MMt Cs; MMt Cs glucose. Plotted elements: two lines. MMt Cs glucose: (100, negative 4), (900, 7). MMt Cs: (100, negative 2), (900, negative 2).
DTA data for homoionic MMt before and after glucose adsorption.

Table 2 Long description
The table lists two DTA peak temperatures, first peak and second peak, in degrees Celsius for five homoionic MMt samples measured without glucose and after glucose adsorption. Without glucose, first peaks cluster near 88 to 92 degrees, and second peaks range from about 624 to 663 degrees, highest for MMt-Na at 662.51 degrees. With glucose, second peaks decrease for every sample, falling to about 598 to 632 degrees, with the largest drop for MMt-Na from 662.51 to 610.48 degrees. First peaks increase for MMt-Li from 91.98 to 107.98 degrees and for MMt-Na from 88.87 to 109.28 degrees. In contrast, first peaks decrease for MMt-K from 89.46 to 98.63 degrees, MMt-Rb from 92.08 to 97.55 degrees, and MMt-Cs from 88.07 to 92.79 degrees. Overall, glucose adsorption consistently lowers the higher-temperature event across all cations, while its effect on the lower-temperature event depends on the cation. The table reports temperatures only and does not provide uncertainty or replicate counts, so the strength of these differences cannot be assessed from this data alone.
After glucose adsorption, the first thermal event shifted to a higher temperature for all samples. This behaviour suggests that glucose adsorption modifies the interlayer hydration environment and is associated with more thermally demanding water removal. The increase was particularly marked for the Li- and Na-exchanged samples, for which the first peak shifted from 91.98°C to 107.98°C and from 88.87°C to 109.28°C, respectively. Smaller shifts were observed for the K- and Cs-forms. These results suggest that glucose adsorption is associated with a stronger modification of the interlayer environment in Li- and Na-MMts, which may contribute to greater retention of interlayer water. In contrast, the weaker effect observed for K- and Cs-exchanged MMt may be related to their lower hydration and swelling tendency, which may limit the extent of interlayer rearrangement under the investigated conditions (Yotsuji et al., Reference Yotsuji, Tachi, Sakuma and Kawamura2021). The second thermal event shifted to a lower temperature after glucose adsorption for all samples. The dehydroxylation peak moved from 623.61°C to 597.86°C for MMt-Li, from 662.51°C to 610.48°C for MMt-Na, from 650.03°C to 632.42°C for MMt-K, from 650.03°C to 632.42°C for MMt-Rb and from 645.05°C to 624.57°C for MMt-Cs. These downward shifts suggest that glucose adsorption affects the structural environment of MMt and is associated with a decrease in the thermal stability of the dehydroxylation step. The magnitude of this effect depended on the nature of the exchangeable cation, with the largest decrease observed for MMt-Na and the smallest decrease observed for MMt-K.
Overall, the DTA results indicate that glucose adsorption affects both dehydration and dehydroxylation processes in homoionic MMt, with the extent of this depending on the exchangeable cation. The stronger thermal shifts observed for the Li- and Na-exchanged forms support the idea that glucose adsorption perturbs a more strongly hydrated interlayer environment in these systems, whereas the weaker response of the K-exchanged form points to more limited structural rearrangement under the investigated conditions. While the present study infers hydration effects from XRD, DTA and FTIR data, the direct quantification of interlayer water was not performed. Future studies targeting hydration states explicitly would further strengthen our mechanistic understanding. These thermal trends complement the adsorption data but do not mirror them exactly, again indicating that glucose uptake and structural response are controlled by several coupled factors rather than by a single parameter.
Structural evolution by XRD
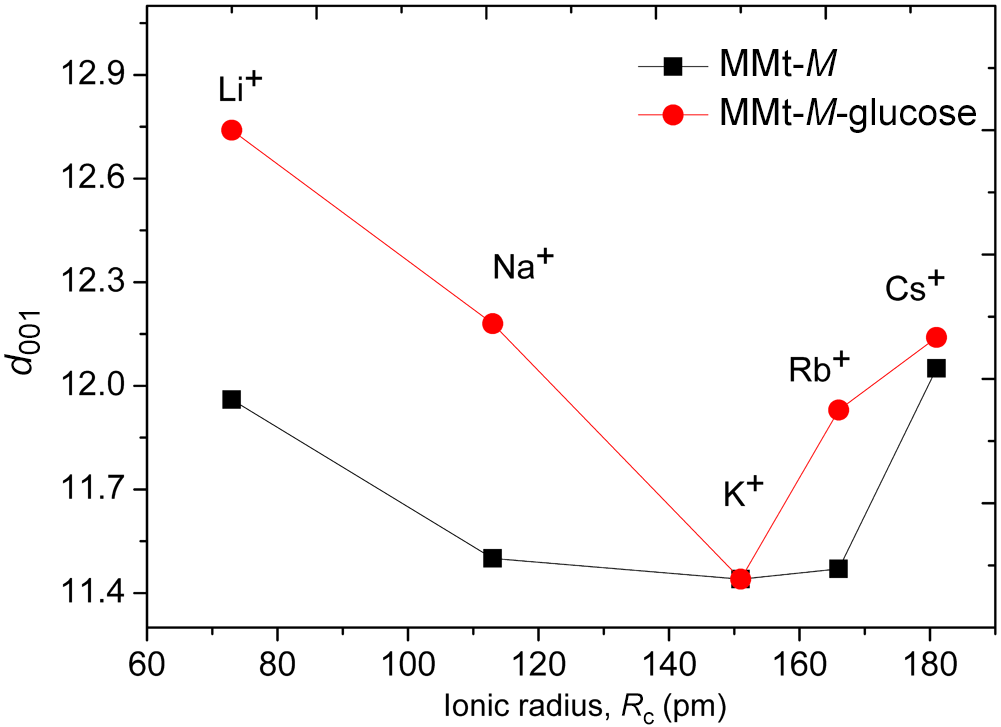
Figure 4a,b shows the XRD traces of the homoionic MMt samples before and after glucose adsorption. For all samples, the main structural modification concerns the basal (001) reflection, whose position shifts towards lower 2θ values after glucose loading. This displacement suggests an increase in the basal spacing and therefore suggests that glucose adsorption affects the interlayer organization of MMt through partial intercalation within the interlayer space. The d 001 values reveal that the extent of this structural change strongly depends on the nature of the exchangeable interlayer cation (Morodome & Kawamura, Reference Morodome and Kawamura2011). The Li- and Na-exchanged forms exhibit the largest basal expansions, with d 001 values of 12.75 and 12.18 Å, respectively, indicating a more pronounced opening of the interlayer space after glucose adsorption. In contrast, MMt-K shows the lowest d 001 value (∼11.4 Å), suggesting a more limited interlayer expansion and hence a lower degree of structural rearrangement. The Rb- and Cs-exchanged samples display intermediate behaviour, consistent with partial but less pronounced interlayer modification (Fig. 5).
XRD traces of the studied samples: (a) homoionic MMt (red curves) and homoionic MMt after glucose adsorption (black curves); (b) enlarged view of the diffraction region highlighting glucose–homoionic MMt interactions.

Figure 4 Long description
The image A showing a line graph with five stacked traces. The y-axis label is Intensity (a.u.). The x-axis label is 2 theta (Cu-Kalpha). The x-axis ranges from 0 to 70 with labeled ticks at 0, 10, 20, 30, 40, 50, 60 and 70. Each stacked trace has two overlaid lines. The right-side labels, from top to bottom, are MMt-Cs, MMt-Rb, MMt-K, MMt-Na and MMt-Li. The image B showing a line graph with five stacked traces. The y-axis label is Intensity (a.u.). The x-axis label is 2 theta (Cu-Kalpha). The x-axis ranges from 4 to 10 with labeled ticks at 4, 5, 6, 7, 8, 9 and 10. Each stacked trace has two overlaid lines. The right-side labels, from top to bottom, are MMt-Cs, MMt-Rb, MMt-K, MMt-Na and MMt-Li. The traces show broad peaks within the 6 to 9 range on the x-axis, with the peak positions differing between the two overlaid lines in each stacked trace.
Evolution of the basal spacing (d 001) of homoionic alkali-exchanged MMts under ambient conditions (black squares) and after glucose adsorption (red circles) as a function of the ionic radius (Rc; pm) of the exchangeable alkali cation. M denotes the exchangeable alkali cation (Li+, Na+, K+, Rb+ or Cs+).

These results suggest that the structural response to glucose adsorption is strongly influenced by the hydration and swelling properties associated with the compensating cation. Strongly hydrated cations such as Li+ and Na+ favour larger interlayer expansion, whereas less strongly hydrated cations, particularly K+, limit the opening of the interlayer region and reduce the extent of structural rearrangement (Bérend et al., Reference Bérend, Cases, François, Uriot, Michot and Thomas1995; Lepoitevin et al., Reference Lepoitevin, Jaber, Guégan, Janot, Dejardin, Henn and Balme2014; Li et al., Reference Li, Chai, Yang, Xin, Sun and Yan2023). The relatively restricted expansion observed for MMt-K is therefore consistent with a less favourable interlayer environment for glucose accommodation within the interlayer region. However, the evolution of basal spacing does not strictly parallel the adsorption trend. This distinction is important because it shows that the structural response of the interlayer region cannot be interpreted solely from adsorption amount differences. Instead, the results suggest that cation-dependent hydration, local organization and transport environment collectively contribute to the overall behaviour of glucose-loaded MMt systems. While the largest basal expansion is observed for MMt-Li and MMt-Na, the highest equilibrium glucose uptake under the investigated conditions is found for MMt-Li and MMt-Cs. This result suggests that glucose adsorption does not depend solely on swelling effects but is also influenced by cation-dependent hydration, interlayer accessibility and probably host–guest interactions within the confined interlayer environment. The XRD results nevertheless remain consistent with the thermal analyses, as samples exhibiting more pronounced basal expansion also show clearer thermal effects associated with glucose adsorption.
Overall, the XRD data indicate a significant but cation-dependent reorganization of the interlayer region after glucose adsorption in homoionic MMt. The key point is that the largest basal expansion does not systematically coincide with the highest adsorption amount, highlighting that interlayer opening alone cannot explain the adsorption behavior. This distinction is important for establishing the structure–property relationships discussed later.
FTIR study
The FTIR spectra of the homoionic MMt samples before and after glucose adsorption are presented in Fig. 6. In all cases, the spectra retain the characteristic absorption bands of MMt, indicating that the fundamental aluminosilicate framework remains preserved after glucose adsorption. However, noticeable changes in band intensity and, in some cases, band broadening are observed, suggesting that glucose adsorption modifies the local environment of interlayer water and surface hydroxyl groups.
FTIR spectra of homoionic MMt before and after glucose adsorption: (a) MMt-Li, (b) MMt-Na, (c) MMt-K and (d) MMt-Cs. The FTIR spectrum of MMt-Rb is provided in the Supplementary Material.

Figure 6 Long description
Four FTIR transmittance spectra plots for homoionic MMt samples with Li, Na, K and Cs, each comparing MMt alone versus MMt with glucose. The x-axis is labeled wavenumber in cm superscript -1, ranging from 4000 to 400 in increments of 500. The y-axis is labeled transmittance in arbitrary units. Each plot shows two lines: one for MMt and one for MMt with glucose. Key peaks are labeled at 3620, 3440, 1640, 1030 and 520 cm superscript -1. In all plots, the addition of glucose results in changes in peak intensity and, in some cases, band broadening. For MMt-Li, notable changes occur around 3440 and 1640 cm superscript -1. MMt-Na shows similar changes with additional shifts at 1030 cm superscript -1. MMt-K and MMt-Cs display intensity variations at 3620 and 520 cm superscript -1. These changes suggest modifications in the local environment of interlayer water and surface hydroxyl groups due to glucose adsorption.
The band located at ∼3640 cm–1 is assigned to the stretching vibration of structural Al–OH groups in the octahedral sheet of MMt (Madejová et al., Reference Madejová, Gates and Petit2017). After glucose adsorption, slight variations in intensity and weak broadening of this band are observed, suggesting that these hydroxyl groups may be involved, directly or indirectly, in hydrogen-bonding interactions associated with the adsorbed glucose molecules.
A broad absorption band in the 3420–3450 cm–1 region is attributed to the stretching vibration of interlayer and adsorbed water. Its modification after glucose loading suggests that the hydrogen-bonding environment of water molecules is affected by adsorption. In addition, the appearance or reinforcement of contributions near 3400 cm–1, together with the band observed at ∼2930 cm–1, assigned to C–H stretching vibrations of glucose (Longhi et al., Reference Longhi, Paterlini, Abbate, Ricard and Zerbi1986; Kačuráková & Mathlouthi, Reference Kačuráková and Mathlouthi1996; Buslov et al., Reference Buslov, Nikonenko, Sushko and R.G1999; Madejová, Reference Madejová2003), supports the presence of glucose in the clay samples after adsorption.
The band near 1640 cm–1, assigned to the bending vibration of molecular water, also shows intensity changes after glucose adsorption. This behaviour suggests a rearrangement of the interlayer water environment and is consistent with the idea that glucose adsorption affects the hydration environment associated with the exchangeable interlayer cations. The strong absorption band in the 1030–1060 cm–1 region is attributed mainly to Si–O stretching vibrations of the tetrahedral sheets of MMt (Madejová, Reference Madejová2003). Although no significant shift in band position is observed after glucose adsorption, slight intensity variations can be detected, indicating that glucose adsorption influences the local environment of the silicate surface without causing major structural alteration. Similarly, the bands located at ∼620, 536 and 470 cm–1, assigned to lattice vibrations involving Al–O–Si and Si–O–Si bending modes (Buslov et al., Reference Buslov, Nikonenko, Sushko and R.G1999; Madejová, Reference Madejová2003), remain essentially unchanged, further confirming that the clay framework is preserved.
The intensity of the glucose-related bands varies with the nature of the exchanged alkali cation, indicating that the interlayer response to glucose adsorption is cation-dependent. In particular, the Li- and Na-exchanged samples exhibit more pronounced changes in the OH- and water-related regions, consistent with a stronger modification of the hydrated interlayer environment, as also suggested by the DTA and XRD results. In contrast, the spectral changes observed for the K-form are less marked, in line with its more limited basal expansion and a weaker structural response to glucose adsorption under the investigated conditions.
Overall, the FTIR spectra indicate that glucose adsorption mainly perturbs the OH- and water-related vibrational regions, while the characteristic lattice bands of MMt remain essentially unchanged. These observations support a model in which glucose is accommodated within a cation-dependent hydrated interlayer environment without major disruption of the clay framework.
Ionic conductivity and activation energy
In solid-state ionic conductors, the total AC conductivity, σAC ( ${\unicode{x03C9}}$, T), results from the superposition of the DC conductivity,
 ${{{\unicode{x03C3} }}_{{\text{DC}}}}\left( T \right)$, and a frequency-dependent polarization contribution, σpol (
 ${\unicode{x03C9}}$, T), and this can be expressed as:
 \begin{equation}{{{\unicode{x03C3} }}_{{\text{AC}}}}\left( {{{ \unicode{x03C9} }},{ }T} \right) = {{{\unicode{x03C3} }}_{{\text{DC}}}}\left( T \right) + {{{\unicode{x03C3} }}_{{\text{pol}}}}\left( {{{\unicode{x03C9}}},{ }T} \right)\,\,\,\,\end{equation}
The DC conductivity,  ${{{\unicode{x03C3} }}_{{\text{DC}}}}\left( T \right)$, is associated with long-range ionic transport through the material, whereas σpol (
 ${\unicode{x03C9}}$, T) arises from localized ionic displacements and dielectric polarization processes. At low frequencies, the conductivity spectra may also be affected by electrode polarization due to charge accumulation at the interface between the ionically conducting pellet and the metallic electrodes. Therefore, measurements over a broad frequency range (Figs 7 & 8) are required to distinguish bulk and interfacial contributions and to determine reliable σDC values from the low-frequency plateau. According to the Arrhenius formalism, the temperature dependence of DC conductivity can be written as in Equation 5:
 \begin{equation}{\unicode{x03C3}}_\text{DC}=\frac{{\unicode{x03C3}}_0}T\text{exp}\left(-\frac{\Delta E_\text{DC}}{{\mathrm k}_{\mathrm B}T}\right)\end{equation}
Variation in the AC conductivity (σAC) as a function of frequency at various temperatures for (a) MMt-Li, (b) MMt-Na, (c) MMt-K and (d) MMt-Cs. The corresponding data for MMt-Rb are provided in the Supplementary Material.

Figure 7 Long description
A) The x-axis is labeled log(frequency (Hz)), ranging from minus 2 to 6. The y-axis is labeled log(sigma(ac) (ohm superscript minus 1 m superscript minus 1)), ranging from minus 10 to minus 3. A legend lists 393 K, 373 K, 353 K, 333 K, 313 K, 293 K, 273 K, 253 K, 233 K, 213 K. Multiple curves show a near-horizontal region at low x values and then increase toward the right. The highest curve is near about minus 4 at low x and approaches about minus 3 near x equals 6. The lowest curve is near about minus 9 at low x and rises to about minus 4 near x equals 6. B) The x-axis is labeled log(frequency (Hz)), ranging from minus 2 to 6. The y-axis is labeled log(sigma(ac) (ohm superscript minus 1 m superscript minus 1)), ranging from minus 10 to minus 3. A legend lists 393 K, 373 K, 353 K, 333 K, 313 K, 293 K, 273 K, 253 K, 233 K, 213 K. Multiple curves show a near-horizontal region at low x values and then increase toward the right. The upper curve is near about minus 4 at low x and approaches about minus 3 near x equals 6. The lowest curve is near about minus 9 at low x and rises to about minus 4 near x equals 6. C) The x-axis is labeled log(frequency (Hz)), ranging from minus 2 to 6. The y-axis is labeled log(sigma(ac) (ohm superscript minus 1 m superscript minus 1)), ranging from minus 9 to minus 4. A legend lists 393 K, 373 K, 353 K, 333 K, 313 K, 293 K. Six curves are shown. At low x values, the top curve is near about minus 7 and the bottom curve is near about minus 8.5. The curves bend upward and rise between about x equals 2 and x equals 6, reaching about minus 4.5 to minus 5 near x equals 6. D) The x-axis is labeled log(frequency (Hz)), ranging from minus 2 to 6. The y-axis is labeled log(sigma(ac) (ohm superscript minus 1 m superscript minus 1)), ranging from minus 11 to minus 4. A legend lists 393 K, 373 K, 353 K, 333 K, 313 K, 293 K. Six curves are shown. At low x values, the top curve is near about minus 6.5 to minus 7 and the bottom curve is near about minus 9.5 to minus 10. The curves rise steadily to the right, reaching about minus 4.5 to minus 6 near x equals 6.
Variation of the AC conductivity (σAC) as a function of frequency at various temperatures for (a) MMt-Li-glucose, (b) MMt-Na-glucose, (c) MMt-K-glucose and (d) MMt-Cs-glucose. The corresponding data for MMt-Rb-glucose are provided in the Supplementary Material.

Figure 8 Long description
A) A line graph with five data series and a legend listing 393 K, 373 K, 353 K, 313 K and 293 K. The x-axis label is log(frequency (Hz)). The y-axis label is log(sigmaac (S cm superscript -1)). The x-axis shows ticks at minus 2, 0, 2, 4 and 6. The y-axis shows ticks at minus 10, minus 9, minus 8, minus 7, minus 6, minus 5, minus 4 and minus 3. Each series increases from left to right. Near log(frequency) minus 2, the series are separated, with the 393 K series highest and the 293 K series lowest. From about log(frequency) 0 to 6, all series rise and move closer together, ending near the upper part of the axis by log(frequency) 6. B) A line graph with five data series and a legend listing 373 K, 353 K, 333 K, 313 K and 293 K. The x-axis label is log(frequency (Hz)). The y-axis label is log(sigmaac (S cm superscript -1)). The x-axis shows ticks at minus 2, 0, 2, 4 and 6. The y-axis shows ticks at minus 10, minus 9, minus 8, minus 7, minus 6, minus 5, minus 4 and minus 3. Each series increases from left to right. Near log(frequency) minus 2, the 373 K series is highest and the 293 K series is lowest. The curves rise gradually at lower x values and more steeply toward higher x values, approaching similar y values near log(frequency) 6. C) A line graph with five data series and a legend listing 393 K, 373 K, 353 K, 313 K and 293 K. The x-axis label is log(frequency (Hz)). The y-axis label is log(sigmaac (S cm superscript -1)). The x-axis shows ticks at minus 2, 0, 2, 4 and 6. The y-axis shows ticks at minus 11, minus 10, minus 9, minus 8, minus 7, minus 6 and minus 5. All series increase from left to right. Near log(frequency) minus 2, the 393 K series is highest and the 293 K series is lowest. The curves rise toward a high point near the right side of the plot, close to log(frequency) 6, with a slight downturn visible at the extreme right for some series. D) A line graph with five data series and a legend listing 393 K, 373 K, 353 K, 333 K and 313 K. The x-axis label is log(frequency (Hz)). The y-axis label is log(sigmaac (S cm superscript -1)). The x-axis shows ticks at minus 2, 0, 2, 4 and 6. The y-axis shows ticks at minus 11, minus 10, minus 9, minus 8, minus 7, minus 6 and minus 5. Each series increases from left to right. Near log(frequency) minus 2, the 393 K series is highest and the 313 K series is lowest. The curves rise and become closer together toward log(frequency) 6, where the highest values are near the top of the plotted range.
where  ${{\Delta }}{E_{{\text{DC}}}}$ is the activation energy for DC conduction,
 ${{{\unicode{x03C3}}}_0}$ is the pre-exponential factor and KB is the Boltzmann constant. By taking the logarithm, Equation 5 can be rewritten in linear form as in Equation 6:
 \begin{equation}\text{log}\left(\unicode{x03C3}_\text{DC}\times T\right)=\text{log}\left({\unicode{x03C3}}_0\right)-\frac{\Delta E_\text{DC}}{2.303{\mathrm k}_{\mathrm B}T}\end{equation}
Thus, a plot of log (σDC × T) vs  $1/T$ should yield a straight line whose slope is equal to
 $\left( { - \frac{{{{\Delta }}{E_{{\text{DC}}}}}} {{{{\text{k}}_{\text{B}}}}}} \right)$, allowing the activation energy to be determined.
The frequency dependences of σAC for the homoionic MMt samples before and after glucose adsorption are shown in Figs 7 & 8, respectively. For all samples, the conductivity spectra display the typical behaviour of disordered ionic conductors, with a low-frequency region tending towards a DC plateau and a high-frequency dispersive regime. The conductivity increases with temperature over the whole frequency range, indicating that ionic transport is thermally activated in both unloaded and glucose-loaded systems.
For the glucose-free homoionic MMt samples (Fig. 7), the Li- and Na-exchanged forms exhibit a more clearly defined low-frequency plateau, especially at high temperature, reflecting more effective long-range ionic transport through the interlayer region. By contrast, the K-, Rb- and Cs-exchanged forms show a less pronounced plateau and a broader dispersive regime, indicating a stronger contribution of localized hopping processes. This result confirms that the electrical response depends strongly on the nature of the exchangeable interlayer cation and on the corresponding interlayer organization.
After glucose adsorption (Fig. 8), the same general spectral behaviour is preserved, but significant changes are observed in both the conductivity level and the extent of the DC plateau. The Li- and Na-exchanged, glucose-loaded samples still display the clearest low-frequency plateau and the highest conductivity values, whereas the K-, Rb- and Cs-forms are dominated by a more extended dispersive regime. This indicates that long-range ionic transport is maintained more effectively in the Li- and Na-exchanged systems, while the K-, Rb- and Cs-exchanged systems are more strongly governed by localized ionic motion.
Comparison between the glucose-free and glucose-loaded samples further shows that glucose adsorption modifies the conductivity response in a cation-dependent manner. In particular, the conductivity decrease is more pronounced for the Li- and Na-exchanged forms, indicating that glucose adsorption is associated with a stronger perturbation of the interlayer transport environment in these systems. Because all measurements were performed after the same thermal pretreatment at 393 K, these differences are interpreted as reflecting changes in the thermally conditioned interlayer organization rather than the contribution of free adsorbed water alone. Accordingly, the conductivity behaviour discussed here should be interpreted within the framework of partially dehydrated, thermally conditioned systems rather than fully hydrated, equilibrium transport conditions. This interpretation is consistent with previous studies showing that the nature of the interlayer cation controls both the extent of organic intercalation and the hydration/swelling behaviour of MMt (Wang et al., Reference Wang, Wilson and Aristilde2024; Belhocine et al., Reference Belhocine, Haouzi, Phou, Maurin, Dieudonne-George, Bantignies and Henn2025).
The DC conductivity values extracted from the low-frequency plateaus were analysed using Equation 6, and the corresponding Arrhenius plots are presented in Fig. 9. In all cases, the good linearity of the  ${\text{log}}\left( {{{{\unicode{x03C3} }}_{{\text{DC}}}} \times T} \right)$ vs
 $1/T$ curves indicates that the conduction process is thermally activated and can be described by an Arrhenius-type hopping mechanism over the investigated temperature range.
Arrhenius plots of the DC conductivity for (a) alkali-exchanged MMt and (b) glucose-loaded alkali-exchanged MMt. The symbols represent the experimental data, while the solid lines correspond to the fits obtained using Equation 5.

Figure 9 Long description
The image A showing an Arrhenius scatter plot with straight fitted lines. Legend text: MMt-Li, MMt-Na, MMt-K, MMt-Rb, MMt-Cs, Linear fit. Marker shapes: MMt-Li uses square markers, MMt-Na uses upward triangle markers, MMt-K uses diamond markers, MMt-Rb uses left-pointing triangle markers, MMt-Cs uses circle markers. Horizontal axis label: 1000 over T (K). Tick labels shown: 2.5, 3.0, 3.5, 4.0, 4.5, 5.0. Vertical axis label: log base 10 of sigma subscript DC times T (ohm superscript negative 1 m superscript negative 1 K). Tick labels shown: negative 8, negative 7, negative 6, negative 5, negative 4, negative 3, negative 2, negative 1. All series form downward-sloping straight lines. Relative placement across the plotted range: MMt-Li is highest, MMt-Na is below MMt-Li, MMt-K is below MMt-Na, MMt-Rb is below MMt-K and MMt-Cs is lowest. The image B showing an Arrhenius scatter plot with straight fitted lines. Legend text: MMt-Li-Glucose, MMt-Na-Glucose, MMt-K-Glucose, MMt-Rb-Glucose, MMt-Cs-Glucose, Linear fit. Marker shapes: MMt-Li-Glucose uses square markers, MMt-Na-Glucose uses upward triangle markers, MMt-K-Glucose uses diamond markers, MMt-Rb-Glucose uses left-pointing triangle markers, MMt-Cs-Glucose uses circle markers. Horizontal axis label: 1000 over T (K). Tick labels shown: 2.4, 2.6, 2.8, 3.0, 3.2, 3.4, 3.6. Vertical axis label: log base 10 of sigma subscript DC times T (ohm superscript negative 1 m superscript negative 1 K). Tick labels shown: negative 7.5, negative 7.0, negative 6.5, negative 6.0, negative 5.5, negative 5.0, negative 4.5, negative 4.0. All series form downward-sloping straight lines. Relative placement across the plotted range: MMt-Li-Glucose is highest, MMt-Cs-Glucose is below MMt-Li-Glucose, MMt-K-Glucose is below MMt-Cs-Glucose, MMt-Na-Glucose is below MMt-K-Glucose and MMt-Rb-Glucose is lowest.
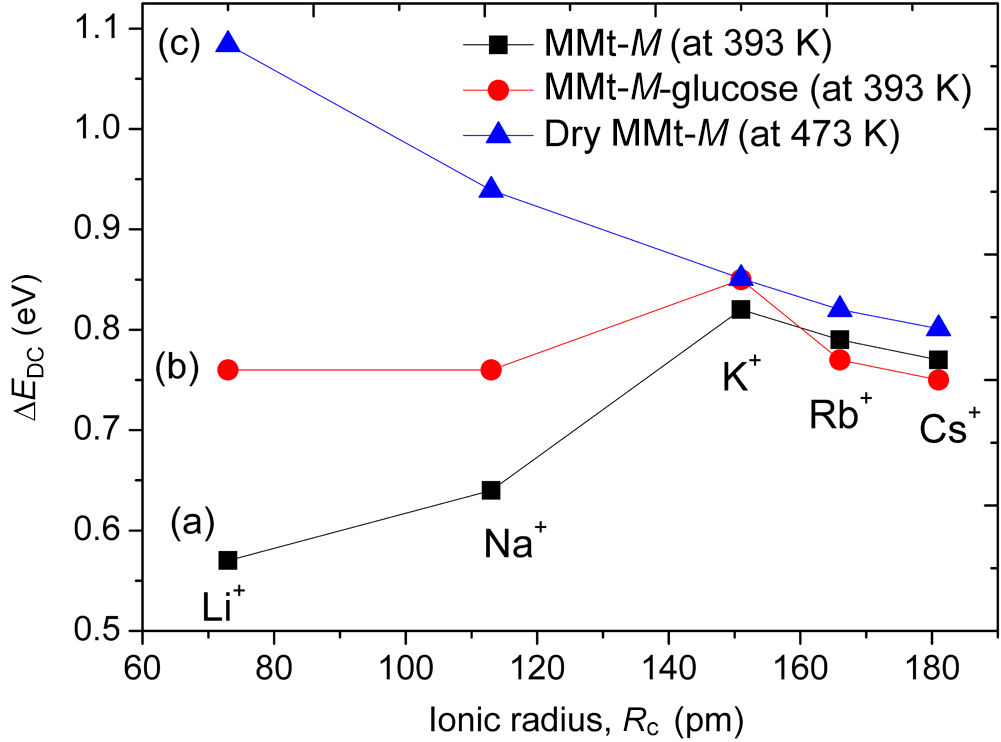
For the glucose-free homoionic MMt samples (Fig. 9a), the activation energy increases from Li+ to K+, then decreases slightly for Rb+ and Cs+. This non-monotonic behaviour shows that ionic transport is not governed solely by ionic radius but rather by a balance between electrostatic interaction with the negatively charged clay layers and the structural characteristics of the interlayer region. This interpretation is in agreement with earlier conductivity studies on dehydrated alkali-exchanged MMts, where the activation energy was shown to depend strongly on the alkali cation and to reflect the strength of cation-layer interactions (Haouzi et al., Reference Haouzi, Kharroubi, Belarbi, Devautour-Vinot, Henn and Giuntini2004).
After glucose adsorption (Fig. 9b), the Arrhenius behaviour is preserved, but the dependence of the activation energy on the nature of the exchangeable cation changes significantly. As summarized in Fig. 10, the glucose-loaded Li- and Na-forms exhibit relatively high and nearly constant activation energies, whereas the K-, Rb- and Cs-forms show lower or decreasing values. These results suggest that glucose adsorption, combined with cation-dependent hydration and interlayer organization, modifies the ionic transport pathways in MMt in a strongly cation-dependent way. In the Li- and Na-exchanged systems, the higher activation barriers are consistent with a more constrained cation–water–glucose arrangement within the interlayer region. In contrast, for larger cations, the weaker hydration and lower interlayer expansion may lead to a less structured glucose-containing environment and, consequently, to a lower effective activation barrier. This interpretation is also consistent with studies showing that interlayer cations strongly influence water distribution, swelling and the arrangement of guest molecules in MMt (Wang et al., Reference Wang, Wilson and Aristilde2024; Belhocine et al., Reference Belhocine, Haouzi, Phou, Maurin, Dieudonne-George, Bantignies and Henn2025). The comparison between hydrated, glucose-loaded and fully dehydrated samples (Fig. 10) is particularly informative. In the dehydrated state, the activation energy decreases more regularly with increasing ionic radius, indicating that, in the absence of interlayer water, Coulombic attraction becomes the dominant factor controlling ionic mobility. The deviation from this trend in the hydrated and glucose-containing systems suggests that interlayer water and glucose modify the conduction mechanism by affecting local coordination, available hopping pathways and the structural arrangement of the interlayer region (Haouzi et al., Reference Haouzi, Kharroubi, Belarbi, Devautour-Vinot, Henn and Giuntini2004).
DC conductivity activation energy, derived from Equation 5, as a function of the ionic radius (Rc, pm) of the exchangeable alkali cation for (a) homoionic MMt at 393 K, (b) homoionic MMt after glucose adsorption at 393 K and (c) fully dehydrated homoionic MMt at 473 K. M denotes the exchangeable alkali cation (Li+, Na+, K+, Rb+ or Cs+).

Overall, these results show that ionic transport in homoionic MMt is governed by a subtle interplay among cation size, hydration, interlayer spacing and molecular organization. Under the present measurement conditions, glucose adsorption does not induce a uniform conductivity response across the alkali series; instead, it reshapes the interlayer conduction environment in a strongly cation-dependent manner. This point is central to this research because it links adsorption and structural reorganization to transport behaviour rather than treating these properties independently. The combined adsorption, XRD, DTA, FTIR spectroscopy and conductivity results suggest a cation-dependent coupling between hydration, interlayer organization and ionic transport. For strongly hydrated cations such as Li+ and Na+, the interlayer region remains more expandable and structurally responsive to glucose adsorption, leading to larger basal spacing changes and more pronounced modifications of the transport environment. In contrast, less strongly hydrated cations such as K+, Rb+ and Cs+ generate a more restricted interlayer environment, limiting structural expansion despite significant glucose uptake in some cases. The results therefore indicate that glucose adsorption is governed not by a single parameter but by the combined effects of cation hydration, interlayer accessibility and local molecular organization within the MMt interlayer.
Conclusion
This study provides comparative evidence that glucose uptake and ionic transport in homoionic MMt are strongly influenced by the nature of the interlayer alkali cation. Under the investigated conditions, the Li- and Cs-exchanged forms exhibited the highest equilibrium glucose uptake, whereas the Na-exchanged form displayed the lowest adsorption amount. XRD, FTIR spectroscopy and thermal analyses collectively support partial accommodation of glucose within the interlayer region without major disruption of the aluminosilicate framework, while the magnitude of the structural response depends on cation hydration and swelling behaviour. Impedance spectroscopy further suggests that glucose adsorption modifies the interlayer conduction environment in a cation-dependent way and that adsorption amount, basal expansion and ionic mobility do not evolve in parallel. The main contribution of this work is therefore not limited to the comparison of glucose uptake alone but rather to the unified comparative analysis of adsorption behaviour, interlayer structural reorganization, thermal response and ionic transport across the complete alkali series, showing how interlayer cations couple adsorption, structural reorganization and ionic transport in glucose–MMt hybrid systems. These results offer a clearer basis for understanding saccharide–clay interactions and for designing clay-based hybrid materials with tuneable interlayer properties.
Supplementary material
The supplementary material for this article can be found at https://doi.org/10.1180/clm.2026.10051.
Author contributions
Mohamed Kharroubi: Conceptualization, Methodology, Investigation, Formal analysis, Data curation, Writing – original draft. Ali Harouache: Investigation, Visualization, Data curation.
Acknowledgements
The authors would like to express their sincere gratitude to Prof. F. Henn and Prof. S. Balme (University of Montpellier, France) for their valuable contributions to this work.
Financial support
The authors declare that they have no known competing financial interests or personal relationships that could have appeared to influence the work reported in this paper.
Competing interests
The authors declare none.