



1 Introduction
From ship propellers to cryogenic rocket motors, hydrodynamic partial cavitation can significantly alter the performance of hydraulic systems and turbo-machines as discussed in Brennen (Reference Brennen1995) and Franc & Michel (Reference Franc and Michel2006). In many cases, these cavities form from vaporization of the free-stream fluid when local flow pressure drops below vapour pressure near a flow boundary. Artificial (i.e. ventilated) partial and super cavities, which are composed primarily of non-condensable gas injected into the flow, have also been used to reduce friction drag on naval objects. Amromin & Minize (Reference Amromin and Minize2003), Kawakami & Arndt (Reference Kawakami and Arndt2011), Wosnik & Arndt (Reference Wosnik and Arndt2013), Karn, Arndt & Hong (Reference Karn, Arndt and Hong2016) examined the use of artificial cavities for drag reduction, along with Lay et al. (Reference Lay, Yakushiji, Mäkiharju, Perlin and Ceccio2010), Mäkiharju et al. (Reference Mäkiharju, Elbing, Wiggins, Schinasi, Vanden-Broeck, Perlin and Ceccio2013a ) and Zverkhovskyi (Reference Zverkhovskyi2014). Ceccio (Reference Ceccio2010) provides a recent review. However, fewer studies investigate vapour cavities that have the addition of non-condensable gas into a natural cavity, and this is important mainly in the context of shedding of vapour clouds.
For a general cavity flow, it is useful to divide the cavity pressure into the contribution that is due to the presence of non-condensable gas and the fraction due to vapour pressure. When the non-condensable gas pressure is much higher than the vapour pressure, the cavity is ventilated or artificial. Conversely, when the contribution to the cavity pressure due to the presence of non-condensable gas is small compared to the vapour pressure, then it is natural. The difference between the cavity pressure and the vapour pressure is often referred to as the cavity compliance (Young et al. Reference Young, Harwood, Miguel Montero, Ward and Ceccio2017) since the presence of non-condensable gas can lead to changes in the mechanism of condensation and gas entrainment at the cavity closure hence, altering the topology and dynamics of the cavity. Recently, Ganesh, Mäkiharju & Ceccio (Reference Ganesh, Mäkiharju and Ceccio2016) reported the presence of propagating bubbly shock waves as a dominant mechanism of partial natural cavity shedding on a wedge. The properties of the shock wave depend significantly on the void fraction flow field and cavity pressure. The role of non-condensable gas in influencing the cavity dynamics, particularly on the vapour production rate and hence also on shock induced shedding, is yet to be understood. Such an understanding would help in the active control of shedding dynamics, and hence enable improved performance by non-condensable gas injection.
Vaporous cavities with injection of small volume fluxes (relative to volume flow rate of liquid) of non-condensable gas (e.g. air) have been most often studied in the context of dam spillway aeration (Chanson Reference Chanson1994) and recently Tomov et al. (Reference Tomov, Khelladi, Ravelet, Sarraf, Bakir and Vertenoeuil2016) examined the effect of introducing non-condensable gas to modify the cavitating flow in a Venturi. However, the behaviour of cavities composed of mostly non-condensable gas versus those composed solely of vapour can be quite different. Young et al. (Reference Young, Harwood, Miguel Montero, Ward and Ceccio2017) provide a recent review of cavities forming on lifting surfaces and the effect of ventilation. This can be contrasted with the behaviour of natural cavities, as discussed in Franc & Michel (Reference Franc and Michel2006).
In recent decades the advances in experimental techniques, especially ones pertaining to void fraction measurement, have enabled study of the dynamics of partial cavities in greater detail, as exemplified by the work of Stutz & Reboud (Reference Stutz and Reboud1997) utilizing optical probes and Stutz & Legoupil (Reference Stutz and Legoupil2003) utilizing one-dimensional X-ray densitometry. While the flows of interest are highly time dependent and three-dimensional, the recent progress in time-resolved two-dimensional void fraction measurements with a system developed by Mäkiharju et al. (Reference Mäkiharju, Gabillet, Paik, Chang, Perlin and Ceccio2013b ) enabled Ganesh et al. (Reference Ganesh, Mäkiharju and Ceccio2016) to experimentally identify that, for natural partial cavities, bubbly shock propagation can be the mechanism for sheet-to-cloud transition. In the present study, we focus further on the dynamics of the cavity forming in the apex region of the wedge used by Ganesh et al. (Reference Ganesh, Mäkiharju and Ceccio2016), specifically vapour production rates, and examine whether non-condensable gas injection can alter these mechanisms for cases where the gas injection volume flow rate is at most of the order of the vapour production rate of the natural cavity. Thus, the cavities under examination are closer to natural cavities than fully ventilated flows
The goal of the present work is to further study the dynamics of these shedding partial cavities with bubbly shocks, its sensitivity to small perturbations in pressure and dissolved gas contents and most importantly the effects of non-condensable gas injection when the volume rate of injection is less than or of the order of the vaporization rate of the non-injection cavity flow. The previously utilized experimental set-up of Ganesh et al. (Reference Ganesh, Mäkiharju and Ceccio2016) was modified to allow for non-condensable gas injection and for additional simultaneous measurements of cavity pressures at two locations. Our observations suggest that the baseline (non-injection) cavity flow is insensitive to changes in the amount of dissolved gas over the parameter range examined. However, it was found that injection of even limited amounts of non-condensable gas at rates that are a fraction of the natural vaporization rate can significantly alter the formation and dynamics of the partial cavity by reducing the overall vapour production rate and therefore the average cavity void fraction. Additionally, the bubbly shock mechanism can be altered even if the total void fraction is not significantly reduced, as the speed of sound in the mixture and shock speed can be influenced via gas injection. Consequently, in some cases the shedding mechanism appears to shift from propagation of bubbly shocks to the one dominated by the classic re-entrant liquid jet. Both reduction of vapour production and altered cavity dynamics were related to the increases in the mean cavity pressure at the suction peak and within the cavity itself. This increase in pressure was a consequence of gas injection.
While the previous study discussed the bubbly shock mechanism and effect of cavitation number over a wide range at cavity lengths, in the present study we will focus on vapour production rates within the cavity, and particularly the effect of gas injection on the strongly shedding condition that resulted from a bubbly shock formation and propagation. The experimental set-up in described in § 2, and in § 3 we present our results on the dynamics of natural cavitation, including the influence of dissolved gas content. Next, results for cavitating flows with non-condensable gas injection are presented in §§ 4 and 5. A discussion and conclusions are presented in § 6.
2 Experimental set-up
The experiments were conducted at the University of Michigan 9-inch water tunnel using a set-up similar to that described in Ganesh et al. (Reference Ganesh, Mäkiharju and Ceccio2016), but with modifications that permitted gas injection. The test model consists of a nominally two-dimensional wedge placed in the 76 mm
 $\times$
76 mm reduced water tunnel test section. The wedge makes an angle of
 $22.1^{\circ }$
to the incoming flow, and has a downstream angle of
 $8.1^{\circ }$
, making a contraction ratio at the wedge apex of
 $2/3$
. An additional static pressure transducer and two rows of gas injection holes were added to the wedge, and the dynamic pressure transducer locations were modified to accommodate the gas injectors. Figure 1 shows the schematics of the present experimental set-up and table 1 lists the locations of the gas injectors and transducers. The
 $s$
-axis is oriented tangential to the wedge surface downstream of the apex and parallel to the mean flow direction and the
 $n$
-axis is oriented normal to the wedge surface, as shown in the figure. The length of the wedge,
 $L_{w}=178$
mm, was used to normalize locations in
 $s$
and
 $n$
. The height of the wedge,
 $H_{w}=25.4$
mm, was used to normalize the streamwise,
 $x$
, and normal,
 $y$
, coordinates when presenting two-dimensional void fraction distributions. The reference velocity,
 $U_{0}$
, and static pressure,
 $p_{0}$
, were measured 76 cm upstream of the wedge apex.
Schematic diagram of the cavity and experimental set-up (a). Flow is from right to left, and reference pressure,
 $p_{0}$
, and velocity,
 $U_{0}$
, are measured 76 cm upstream of the wedge. The red arrows indicate gas injection locations. Note that the wedge apex is the origin of both sn- and xy-coordinate systems, however, the arrows indicating the orientation of the xy-axis are shifted for clarity. (b) Wedge surface downstream of the apex as viewed along the
 $n$
-axis showing the transducers and injector whose precise locations are given in table 1.

The locations of the gas injectors and instrumentation location on the wedge surface, in wedge coordinates.

Gas was injected across two spanwise locations
 $s/L_{w}=0.004$
and 0.134 downstream from the wedge apex, denoted hereafter as the ‘apex’ injection location and the ‘cavity’ injection location, respectively. Each gas injector consisted of a row of 72 holes spaced 1.02 mm apart at a
 $45^{\circ }$
angle with respect to the wedge surface and with 0.51 mm diameter. The injected gas flow rate was measured for up to
 $2\times 10^{-5}~\text{kg}~\text{s}^{-1}$
(1 slpm) with an Omega Engineering FMA-6707 and for fluxes higher than this, up to
 $2\times 10^{-4}~\text{kg}~\text{s}^{-1}$
(10 slpm), using an Omega Engineering FMA-5520 mass flow meter with manufacturer specified accuracies of
 $\pm 1\,\%$
and
 $\pm 1.5\,\%$
of full scale, respectively. During the experiments 15 s were allowed from beginning of gas injection at pre-set flow rate before gathering of data to ensure the gas flow rate had reached steady state.
The static pressure was measured at two locations on the surface of the wedge via 0.8 mm diameter taps. The first tap, denoted as the ‘apex’ pressure tap, was located at
 $s/L_{w}=0.013$
to measure pressure
 $p_{A}$
. The second, denoted as the ‘cavity’ pressure tap, was located at
 $s/L_{w}=0.0147$
to measure the pressure
 $p_{C}$
. The pressure from each tap was measured by an Omega Engineering PX20-05A5V 0–36 kPa transducer with accuracy of
 $\pm 0.08\,\%$
of full scale.
The unsteady pressure on the wedge surface was measured using two flush mounted surface pressure sensors PCB 138M101 connected to a signal conditioner (ICP Sensor 480CO2) with combined accuracy of
 $\pm 2\,\%$
of reading. The unsteady pressure signals were sampled at a frequency of 500 kHz using a National Instruments PCI-MIO-16E-4 DAQ card triggered using the common time base with the X-ray measurement system. The locations of the sensors are given in table 1, and the pressures are denoted as
 $p_{D1}(t)$
and
 $p_{D2}(t)$
for the upstream and downstream transducers, respectively.
The instrumentation used to measure tunnel inlet flow velocity, inlet pressure, static and dynamic pressure on the wedge, as well as to record the high-speed video, are described in Ganesh et al. (Reference Ganesh, Mäkiharju and Ceccio2016) and the cinemagraphic X-ray system is described in Mäkiharju et al. (Reference Mäkiharju, Gabillet, Paik, Chang, Perlin and Ceccio2013b
). In the present study, the inlet flow velocity was fixed at
 $U_{0}=8.0\pm 0.05~\text{m}~\text{s}^{-1}$
and the inlet static pressure for the nominal conditions was fixed at
 $p_{0}=70\pm 0.5$
kPa. Hence, the cavitation number
 $$\begin{eqnarray}\unicode[STIX]{x1D70E}_{0}=\frac{p_{0}-p_{V}}{\frac{1}{2}\unicode[STIX]{x1D70C}U_{0}^{2}}\end{eqnarray}$$
was fixed at
 $\unicode[STIX]{x1D70E}_{0}=2.03\pm 0.01$
, when the water temperature is taken to be nominally constant at
 $20\pm 1\,^{\circ }$
C, and consequently the vapour pressure to be a constant
 $p_{V}=2.3\pm 0.2$
kPa and the water density
 $\unicode[STIX]{x1D70C}=998\pm 0.5~\text{kg}~\text{m}^{-3}$
. We also will define two cavitation numbers based on apex and cavity mean static pressures,
 $p_{A}$
and
 $p_{C}$
:
 $$\begin{eqnarray}\unicode[STIX]{x1D70E}_{A}=\frac{p_{A}-p_{V}}{\frac{1}{2}\unicode[STIX]{x1D70C}U_{0}^{2}}\end{eqnarray}$$
and
 $$\begin{eqnarray}\unicode[STIX]{x1D70E}_{C}=\frac{p_{C}-p_{V}}{\frac{1}{2}\unicode[STIX]{x1D70C}U_{0}^{2}}.\end{eqnarray}$$
The dissolved oxygen content was varied using a closed loop deaeration system, and the free-stream value was measured using an Orion Start A113 dissolved oxygen meter to a precision of
 $\pm 2\,\%$
. The dissolved oxygen values during the experiment varied from 30 % to 75 % of saturation at standard temperature and pressure (STP), and here the dissolved oxygen is assumed to be a suitable proxy for the total dissolved gas content, as discussed by Lee et al. (Reference Lee, Mäkiharju, Ganesh and Ceccio2016).
3 Natural shedding partial cavity and the influence of dissolved gas contents
We will begin with further examination of the natural cavitation occurring for the strongly shedding condition. We do this (i) to better characterize the uncertainty in the baseline flow before reporting on the results with gas injection and (ii) to determine any influence that variation in the dissolved as content may have on the cavity dynamics. The physical reasoning that prompts the exploration of (ii) is given below. Dissolved gas within the water channel can influence the free-stream nuclei population as discussed in Ceccio & Brennen (Reference Ceccio and Brennen1991). In addition, dissolved gas within the bulk flow gas can be exchanged with a partial cavity, as discussed recently by Lee et al. (Reference Lee, Mäkiharju, Ganesh and Ceccio2016). Typically, the liquid near the cavity may be supersaturated with dissolved gas, and mass transfer will take place into the cavity at the gas–liquid cavity interface (Parkin & Ravindra Reference Parkin and Ravindra1991) or at the interfaces of the bubbly mixture that forms the cavity (Yu & Ceccio Reference Yu and Ceccio1997; Lee et al. Reference Lee, Mäkiharju, Ganesh and Ceccio2016). The question arises as to the effect that such gas diffusion may have on the gross dynamics of a shedding cavity, mainly in the context of changing the behaviour of the bubbly flow, and this will be discussed here.
3.1 The flow cycle of the shedding cavity
For the nominal flow condition of
 $\unicode[STIX]{x1D70E}_{0}=2.0$
and
 $U_{0}=8~\text{m}~\text{s}^{-1}$
we observe a periodically shedding cavity, as shown in time series recorded with visible light shown in figure 2 and with X-ray in figure 3. The top and side views with visible light were recorded simultaneously, and the X-ray data were recorded at a different time. While the conditions were nominally the same for data (from high-speed recordings) shown in figures 2 and 3, limitations in repeatability of conditions and cycle-to-cycle variations, discussed in § 3.3, cause a minor, but noticeable, discrepancy when comparing data from different shedding cycles. The sharp discontinuity in void fraction (i.e. the bubbly shock front) can be readily observed in figure 3, and the nature of this flow feature was extensively discussed in Ganesh et al. (Reference Ganesh, Mäkiharju and Ceccio2016). In summary, a cavity shedding cycle occurs when the separated flow region formed at the wedge apex fills with a bubbly mixture as vapour is produced near the suction peak at the wedge apex. As the void fraction of the vapour–liquid mixture within cavity increases, the sound speed of the mixture decreases to values much lower than that of either the liquid or vapour alone. With a reduction in cavitation number, the Mach number (i.e. the ratio of the speed of flow to local speed of sound) of the bubbly flow becomes supersonic, leading to the formation of a well-defined condensation shock front that propagates upstream with a speed (as measured in the laboratory frame) of the order of half the free-stream speed. When this front impinges on the region of cavity detachment, a large-scale cloud of vapour it shed and convects downstream. Then, the growth cycle begins anew. A similar condensation shock was recently observed also by Wu, Maheux & Chahine (Reference Wu, Maheux and Chahine2017), whose test section geometry and flow conditions lend the presence of the shock to also be inferable from the visible light high-speed video.
Top and side view time series of the periodically shedding cavity (
 $\unicode[STIX]{x1D70E}_{0}=2.0$
and
 $U_{0}=8~\text{m}~\text{s}^{-1}$
), with
 $t_{cycle}\approx 42$
ms. The images show the growth, pinch off and shedding of a vapour cloud from the cavity near the separation line at the wedge apex. Flow is from right to left.

X-ray densitometry images showing the void fraction fields of a periodically shedding cavity (
 $\unicode[STIX]{x1D70E}_{0}=2.0$
and
 $U_{0}=8~\text{m}~\text{s}^{-1}$
), with
 $t_{cycle}\approx 42$
ms. While recorded at different times, the panels approximately match the phases of the shedding cycle shown in figure 2. The shedding results from the propagation of a void fraction discontinuity front (highlighted in e). Flow is from right to left.

3.2 Cavity length and thickness
Ganesh et al. (Reference Ganesh, Mäkiharju and Ceccio2016) reported the average length and thickness of the partial cavities as a function of cavitation number. Additional measurements were conducted in the present study to determine the sensitivity of the cavity geometry to the free-stream dissolved oxygen (DO) content. Figures 4(a) and 4(b) present the cavity length and thickness based on time-averaged 10 % void fraction contour,
 $L_{C10\%}$
and
 $T_{C10\%}$
, respectively. As noted for figure 4(a), for
 $\unicode[STIX]{x1D70E}_{0}<2$
the cavity grew outside the region imaged and only thickness could be directly measured. Hence, based on data of cavity thickness-to-length ratio for
 $\unicode[STIX]{x1D70E}_{0}<2$
, in the rest of this paper it is assumed
 $L_{C10\%}\sim 7.6T_{C10\%}$
. Data are presented for DO
 ${>}50\,\%$
(65 % or 75 %),
 $\text{DO}\sim 50\,\%$
and DO
 ${<}50\,\%$
(30 % or 32 %). The error bars signify the measurement. For cavitation number, as noted in § 2, propagation of uncertainty for measured quantities alone suggests usage of
 $\pm 0.01$
may be appropriate. However, due to observed variability in parameters measured during the experiments, a more conservative
 $\pm 0.03$
was taken to be the uncertainty of the cavitation number. Based on the spatial resolution of the X-ray measurements (nominally 1 mm), potential smearing of cavity closure caused by non-parallel beam paths (Mäkiharju et al.
Reference Mäkiharju, Gabillet, Paik, Chang, Perlin and Ceccio2013b
), sensitivity over average cavity dimensions to which segment of data was used and erring on the conservative side, 5 mm and 2 mm were taken to be the uncertainties in cavity length and height based on average 10 % void fraction contour. In all cases, the variation of cavity dimensions with respect to the dissolved gas content are small, and generally fall within the uncertainty bounds of the data.
(a) The cavity length based on time-averaged 10 % void fraction contour,
 $L_{C10\%}$
, and (b) the maximum cavity thickness,
 $T_{C10\%}$
, normalized by the wedge height as a function of cavitation number,
 $\unicode[STIX]{x1D70E}_{0}$
. We exclude the length data where the length was near or beyond the field of view, which occurred for
 $\unicode[STIX]{x1D70E}_{0}<2$
. The error bars signify the uncertainty described in the text.

(a) The time-averaged void fraction distribution with outlines shown for two regions of interest (ROI) (the first ROI is rectangular and the second is based on the time-averaged 5 % void fraction contour). Time series of spatially averaged void fraction (b) and gas volume (c) within the two ROIs (outlined in (a)) for the baseline shedding cavity at
 $\unicode[STIX]{x1D70E}_{0}=2.0$
and
 $U_{0}=8~\text{m}~\text{s}^{-1}$
.

The vapour production rate,
 $Q_{V}$
, as a function of time for
 $\unicode[STIX]{x1D70E}_{0}=2.0$
and
 $U_{0}=8~\text{m}~\text{s}^{-1}$
. The solid lines show the mean peak rates of vapour production,
 $Q_{V,max}$
, and reduction; the dashed lines are one standard deviation away from the mean.

(a) The average maximum vapour production rate
 $Q_{V,max}$
as a function of
 $\unicode[STIX]{x1D70E}_{0}$
; (b) the scaled flow coefficient
 $C_{V,max}=Q_{V,max}/U_{0}L_{C10\%}b$
, where the cavity length is defined by the 10 % void fraction contour.
 $U_{0}=8~\text{m}~\text{s}^{-1}$
.

(a) Schematic diagram of the flow over the wedge with a red dashed line at
 $n=2$
mm above the surface along which the void fraction was recorded; (b) the space–time (s–t) diagram of the void fraction. This diagram was used for the determination of the bubbly shock speed as described by Ganesh et al. (Reference Ganesh, Mäkiharju and Ceccio2016). The black line in the
 $s$
–
 $t$
diagram shows the propagation of the void fraction shock. Note the rapid cavity growth phase is discernible in this figure as the smoother discontinuity (within the white rectangle) trending up and toward the left.

The propagation speed of the bubbly shock in the laboratory frame,
 $U_{FL}/U_{0}$
, as a function of
 $\unicode[STIX]{x1D70E}_{0}$
for the non-injection conditions and with varying dissolved gas content.
 $U_{0}=8~\text{m}~\text{s}^{-1}$
. The horizontal error bars signify the uncertainty of cavitation number as described in the text and the vertical error bars show the standard deviation of measured shock speeds.

3.3 The natural vapour production rate
With measurements of time series of void fraction, we can determine the time evolution of the spanwise-averaged volume of vapour,
 $V_{gas}(t)$
, in any region of interest for the strongly shedding condition, and use it to determine the volumetric vapour production rate
 $Q_{V}=\text{d}V_{gas}(t)/\text{d}t$
. The cavity growth takes place in approximately
 $10^{-2}$
s, and we can measure the overall vapour production rate by taking differences in our 1 kHz time series of void fraction images. For simplicity, we will assume that during the initial cavity growth the production rate of vapour significantly exceeds the condensation rate, as pressure in region near suction peak is near vapour pressure, and that there is negligible advection of vapour out of the control volume, as no significant outflow of gas is observable in visible light or X-ray. Note the rectangular control volume (‘region of interest’, ROI) around the cavity defined in figure 5(a). We will also consider ROIs that are defined by boundary of the time-averaged void fraction (e.g.
 $\unicode[STIX]{x1D6FC}>5\,\%$
) in the analysis below.
Figure 5(b) shows the average void fraction within a control volume and the average void fraction,
 $\unicode[STIX]{x1D6FC}$
, rises and falls during the shedding cycle. Two curves are shown here, with the first presenting the void fraction in the rectangular ROI, and the second showing the void fraction defined by a ROI enclosing the region of the cavity with mean void fraction greater than 5 %. The trends for both curves are similar, but the peak void fractions are, of course, larger for the smaller control volume defined by the
 $\unicode[STIX]{x1D6FC}>5\,\%$
curve. Figure 5(c) presents the total gas volume,
 $V_{gas}$
, which is nearly insensitive to the choice of control volume since both enclose the bulk of the vapour.
The first time derivative of the vapour volume can now be used to compute the volumetric vapour production rate,
 $Q_{V}$
. The average maximum (i.e. average of all peaks detected in the recording) vapour production rate during the cavity growth,
 $Q_{V,max}$
, is approximately
 $1.7\times 10^{-3}~\text{m}^{3}~\text{s}^{-1}$
as seen in figure 6. An algorithm utilizing the frequencies based on the dynamic pressure transducer and void fraction data was utilized to automatically identify the peaks (which are numbered in the figure) associated with each cycle. We can note that even in this nominally periodic case, there is significant cycle-to-cycle variation that may be due to both the underlying shedding process, which is also highly three-dimensional as evidenced by figure 2, and variation in the free-stream conditions. We have characterized the uncertainty in the incoming free-stream speed and pressure, and these may be sufficient to produce some variation in the behaviour of the cavitation. Also, as reported by Duttweiler & Brennen (Reference Duttweiler and Brennen2002), the presence of shedding partial cavitation can interact with the acoustic modes and compliance of a water tunnel, and lead to coupled behaviour. And, such interactions are difficult to manage in a recirculating water channel.
Interestingly, the observed minor cycle-to-cycle variation caused ‘smearing’ in simply phase-averaged data (see supplementary movies 8 and 9 available at https://doi.org/10.1017/jfm.2017.569), and the smeared time series often resembled more what one would expect to see in a cycle with a re-entrant jet. A re-entrant jet would appear smeared as the vapour along most of the cavity height would not condense while a thin liquid jet travels upstream underneath the cavity. The distinction of re-entrant jet and condensation shock was further discussed by the authors in Ganesh et al. (Reference Ganesh, Mäkiharju and Ceccio2016).
We can examine the vapour production rates for a range of cavitation numbers and dissolved oxygen contents, and the data are presented in figure 7.
 $Q_{V,max}$
is, as it was in figure 6, the average peak vapour production rate, if we assume negligible condensation or advection during the vapour production portion of the cavity filling cycle. As shown in figure 7(a),
 $Q_{V,max}$
increases with decreasing cavitation number, as does the cavity length. Following Stutz & Reboud (Reference Stutz and Reboud1997), we can define the flow coefficient of vapour
 $$\begin{eqnarray}C_{V,max}=\frac{Q_{V,max}}{U_{0}L_{C10\%}b},\end{eqnarray}$$
where
 $L_{C10\%}$
is cavity length based on the 10 % void fraction boundary as determined by the X-ray measurement, and
 $b$
is the span of the model. These data are shown in figure 7(b). The normalized maximum flow coefficient ranges from 0.01
 ${<}C_{V,max}<0.04$
. Any influence of the dissolved air content is not readily discernible from the data. We can also note that the time-averaged normalized vapour production rate when defined as in Stutz & Reboud (Reference Stutz and Reboud1997), and taking velocity profile to be same as in that reference, was found to be
 $\overline{C_{V}}\sim 0.01$
, which is similar to the values reported by Stutz & Reboud (Reference Stutz and Reboud1997) based on optical bubble probe measurement.
3.4 Bubbly shock speed
The void fraction discontinuity (i.e. bubbly shock speed in most cases),
 $U_{FL}$
, is the speed measured in the tangential directions along the wedge surface taken with respect to the laboratory frame of reference.
 $U_{FL}/U_{0}$
was determined based on the slope of the (space–time)
 $s$
–
 $t$
diagram generated by plotting the void fraction at
 $n=2$
mm (i.e. 2 mm away from the surface), as shown in figure 8. Owing to variability from cycle-to-cycle, as well as measurement uncertainty arising from determination of the slope itself, the measured shock speed had measurable variability amongst cycles at the same flow conditions. These data were used to compute the speed of the front in the laboratory frame and are presented in figure 9 as a function of the cavitation number. The uncertainty in cavitation number is determined as discussed in connection to figure 4, and vertical error bars were used to show the standard deviation of measured shock speed. The values and trends are similar to those reported by Ganesh et al. (Reference Ganesh, Mäkiharju and Ceccio2016). As in the case for the cavity geometry and vapour production rate, changes in the dissolved oxygen content did not affect the observed shock speed within the uncertainty of the data.
3.5 Void fraction upstream and downstream of the bubbly shock
The values of void fraction upstream of the shock,
 $\unicode[STIX]{x1D6FC}_{1}$
, are taken to be same as void fraction in the ‘core’ of the cavity,
 $\unicode[STIX]{x1D6FC}_{core}$
, and are shown in figure 10 as a function of the cavitation number. Value of
 $\unicode[STIX]{x1D6FC}_{core}$
is defined based on the highest nominally uniform void fraction region, such as observable in figure 8(b) immediately below the black line showing the slope that indicates shock speed and also see clearly to the right of the shock in figure 3(e). As could have been expected, the void fraction in the cavity sharply decreases as the cavitation number is increased. Also, as could be found for example from figure 8(b), and similarly to figure 30 of Ganesh et al. (Reference Ganesh, Mäkiharju and Ceccio2016), the void fraction after the shock for all conditions was approximately a constant
 $\unicode[STIX]{x1D6FC}_{2}\approx 0.22$
. Again, changes in the dissolved oxygen content did not alter the upstream volume fraction.
The void fraction upstream of the bubbly shock (at the highest nearly uniform void fraction ‘core’ within the cavity),
 $\unicode[STIX]{x1D6FC}_{core}$
, as a function of
 $\unicode[STIX]{x1D70E}_{0}$
and with varying dissolved gas content.
 $U_{0}=8~\text{m}~\text{s}^{-1}$
.

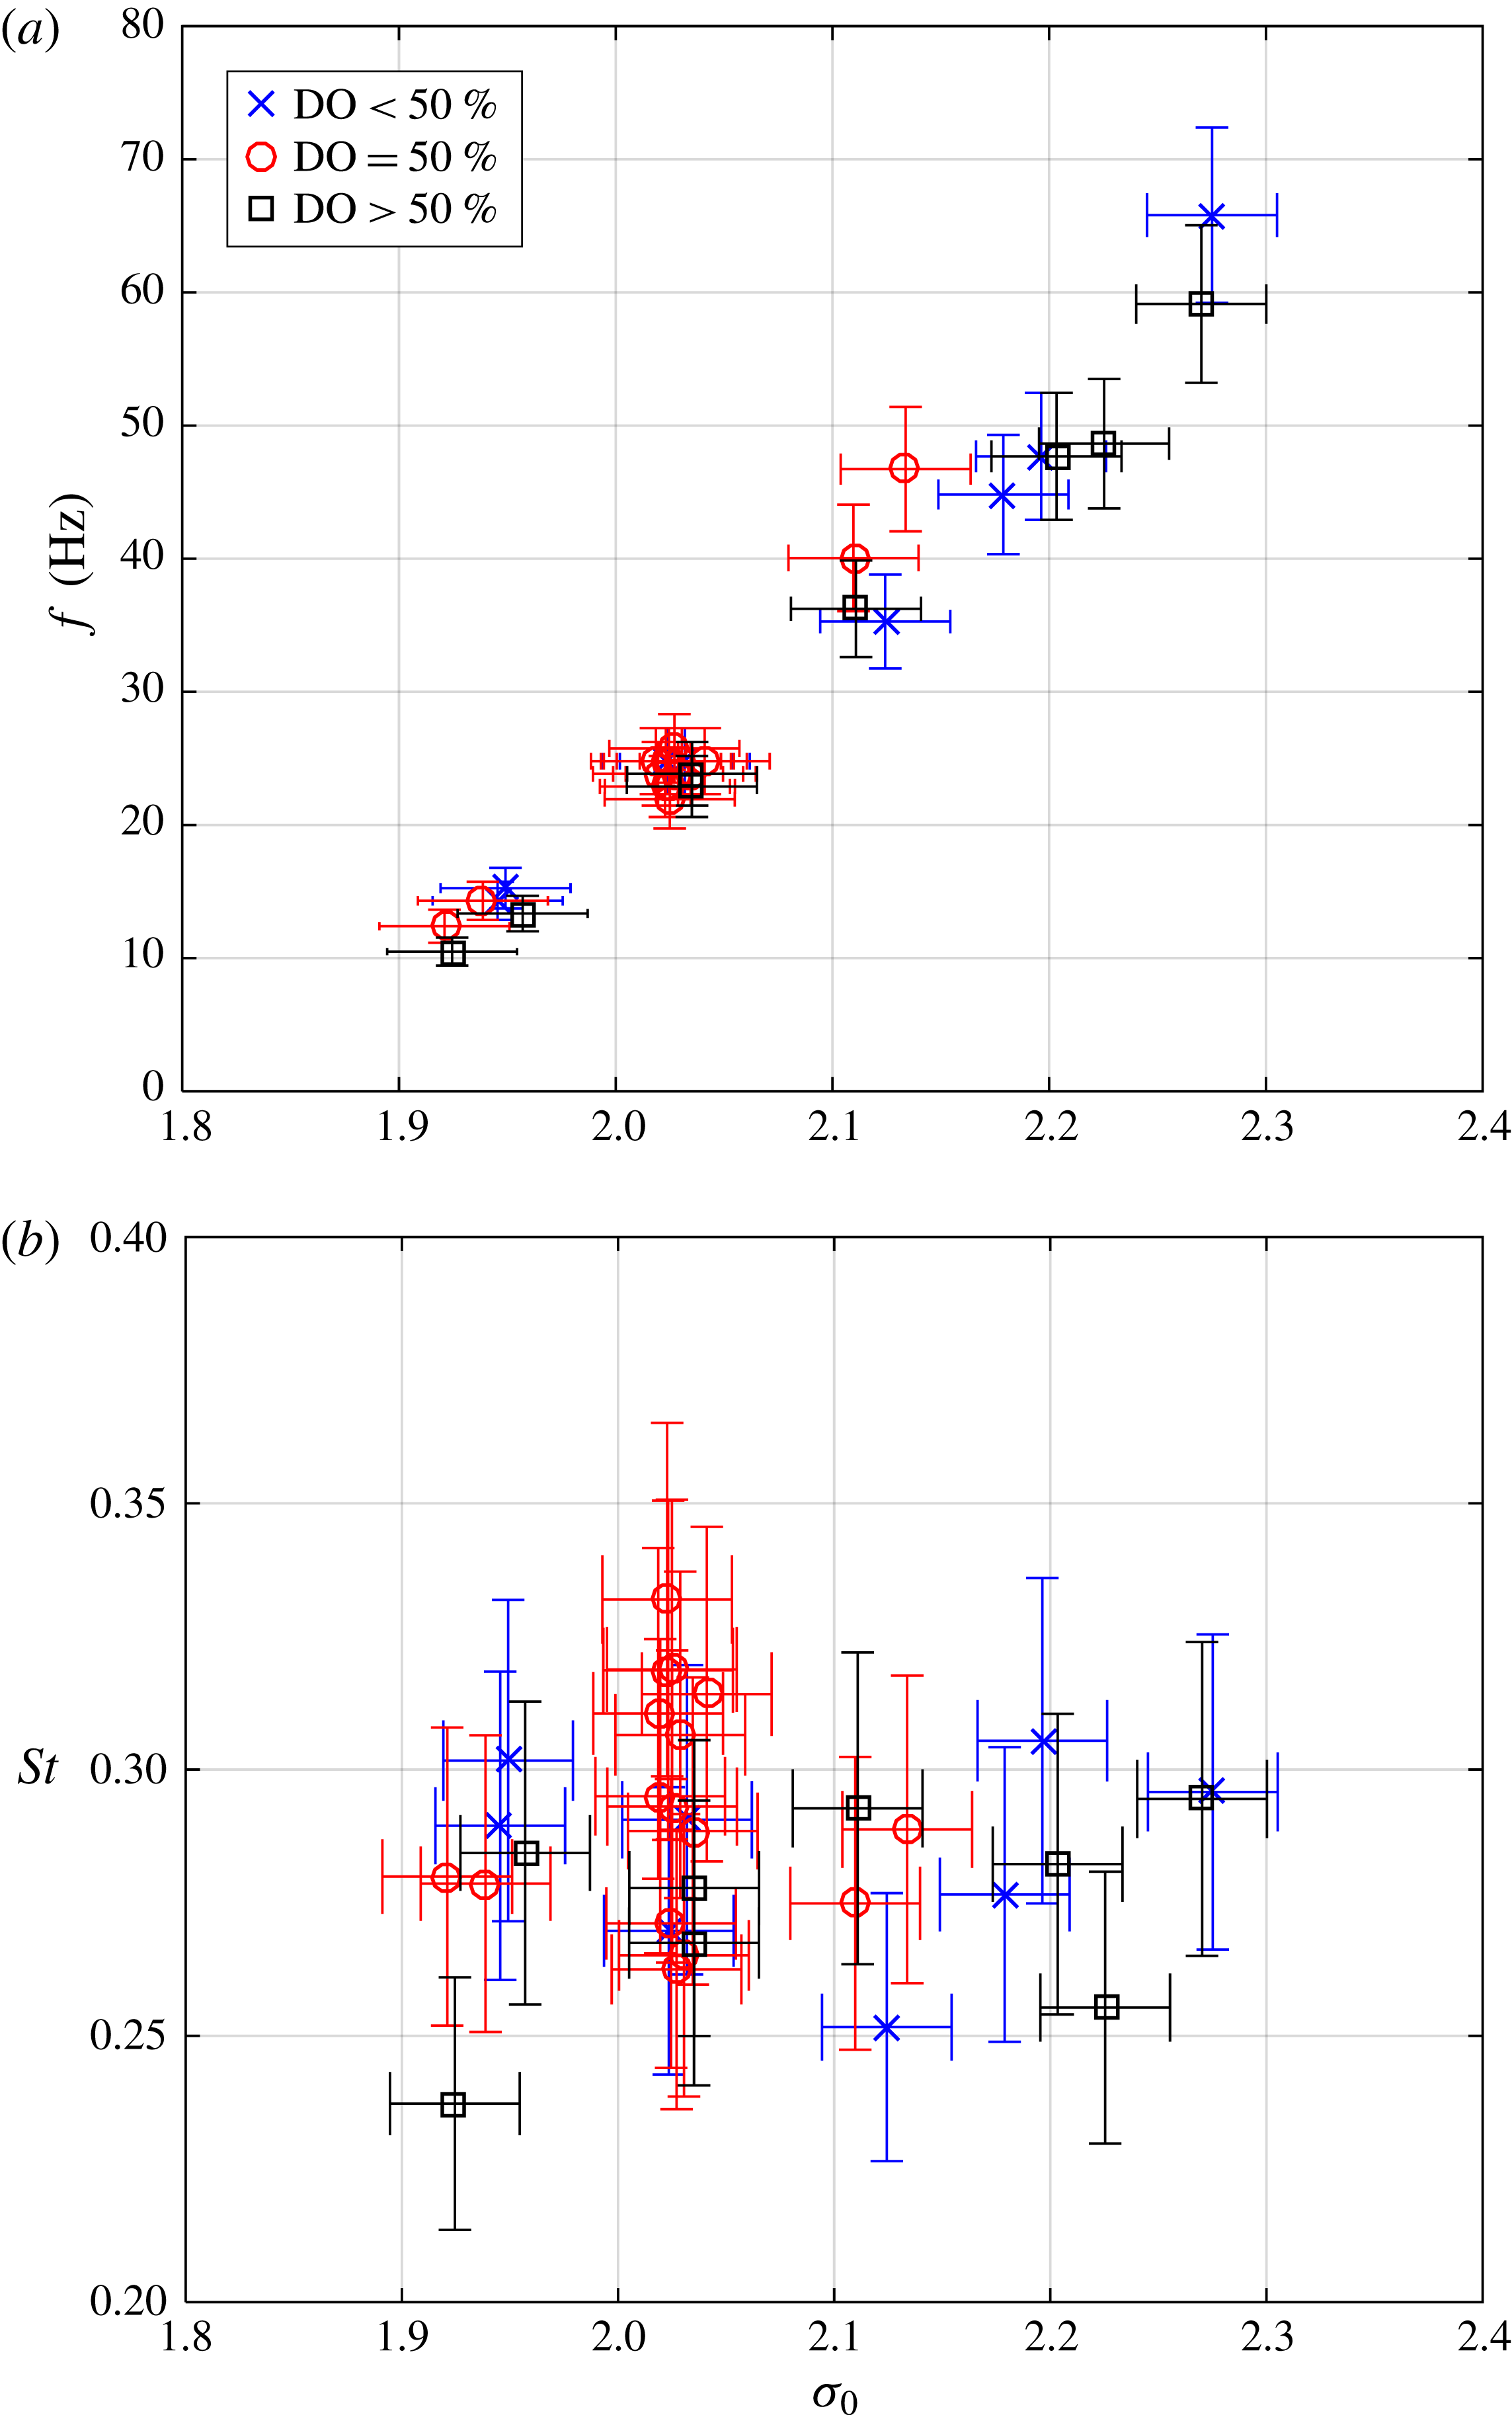
(a) The frequency and (b) Strouhal number,
 $St=fL_{C10\%}/U_{0}$
, as a function of
 $\unicode[STIX]{x1D70E}_{0}$
and with varying dissolved gas content.
 $U_{0}=8~\text{m}~\text{s}^{-1}$
.
3.6 Cavity shedding frequency
The cavity shedding frequency could be determined based on fast Fourier transform of data from one of the two dynamic pressure transducers, or based on void fraction data. Frequencies based on each were generally found to agree, and as the dynamic pressure transducers had higher temporal sampling frequency, for the rest of the paper we base the shedding frequency,
 $f$
, on the upstream dynamic pressure transducer data,
 $p_{d1}$
(
 $t$
). Figure 11(a) shows the measured frequencies. The Strouhal number based on cavity length (assuming
 $L_{C10\%}\sim 7.6T_{C10\%}$
as discussed in § 3.2) is defined as
 $$\begin{eqnarray}St=\frac{fL_{C10\%}}{U_{0}}.\end{eqnarray}$$
As shown in figure 11(b), the Strouhal number was found to be
 ${\sim}0.28$
and exhibited no significant dependence on the dissolved oxygen contents of the water.
4 Effect of gas injection on cavity topology, void fraction and vapour production rate
As we discuss the results of gas injection into the cavity, it is useful to compare the injected gas volume flux to the volumetric rate of water vapour production for the natural cavity. We will again focus on the baseline shedding condition of
 $\unicode[STIX]{x1D70E}_{0}=2.0$
and
 $U_{0}=8~\text{m}~\text{s}^{-1}$
. For this case the average peak vapour production rate
 $Q_{V,max}=1.7\pm 0.5\times 10^{-3}~\text{m}^{3}~\text{s}^{-1}$
. We can compare this vapour production rate with the volume flux of the injected non-condensable gas,
 $Q_{I}$
, where the volume flux is computed for a given injected gas mass flux assuming that the gas is at the average temperature and pressure (
 ${\sim}5$
kPa) of the cavity flow. In the present experiments, the injection rate was varied to span
 $0.01<Q_{I}/Q_{V,max}<1.2$
, and this range was chosen such that the injected gas flux may interact with, but in most cases not overwhelm, the baseline natural cavity flow.
At this point, we should also evaluate whether the method by which the gas was injected is likely to significantly affect the flow. We can use a simple scaling to assess the importance of the momentum flux imparted by the injected gas by comparing the momentum flux of the gas relative to the momentum flux of the bubbly shock front. As the combined area of the gas injection holes was approximately
 $1.5\times 10^{-5}~\text{m}^{2}$
, highest mass flow rate of gas injected
 $2\times 10^{-4}~\text{kg}~\text{s}^{-1}$
(10 slpm) and cavity pressure at apex measured on average to be as low as 5 kPa, the gas momentum flux parallel to the surface was
 ${\dot{m}}_{gas}U_{gas}\,\text{cos}\,\unicode[STIX]{x1D703}_{gas,injection}\sim 0.03$
N. We can compare this with to the momentum of the bubbly shock front if we assume that the flow has a density half that of the pure liquid and a speed of approximately
 $4~\text{m}~\text{s}^{-1}$
, yielding a value of
 ${\dot{m}}_{shock}U_{shock}\sim 6$
N. Hence, the momentum of the gas injected was always less than 0.5 % of the momentum of the bubbly shock front, and we can assume that the injected gas momentum flux does not play a determinative role in the cavity dynamics.
4.1 Cavity void fraction and topology with gas injection
Figure 12 presents images of the time average (a) and root-mean-square deviation (RMSD) (with latter multiplied by two to enable use of common colour bar) of the void fraction (b) for minimal rates of gas injection,
 $0<Q_{I}/Q_{V,max}<0.16$
from the apex injector. We can observe the significant reduction in both time-averaged void fraction and void fractions RMSD with increasing minimal gas injection, with void fraction minima observed at
 $Q_{I}/Q_{V,max}\approx 0.07$
. After the minima, the average void fraction begins to increase owing to volume of non-condensable gas. As the cavity with reduced condensable vapour contents is more stable, even as the average void fraction begins to increase again after the minima at
 $Q_{I}/Q_{V,max}\approx 0.07$
, the void fraction fluctuations remain significantly reduced. (Note: The local minima in void fraction, as evident in figure 12, is also evident in figure 18 discussed later.)
The images for mid-cavity injection are shown in figure 13 for minimal gas injection with
 $0<Q_{I}/Q_{V,max}<0.16$
. Here, the effect of the gas injection is much less pronounced. Then, with further increases in gas injection flux
 $Q_{I}/Q_{V,max}$
up to 1.20, as shown in figure 14, where the first two rows show results from repeating conditions shown by first and last rows of figure 13. At the highest injected gas flux the gas fills the region from injector to apex, and a gas jet emanating from the apex is observed. In is interesting to note that the region of the suction peak near the apex becomes filled with gas, and at the highest injection rates remains constantly filled as evident by dramatic drop in the void fraction RMSD in the suction peak region seen in the last two rows. i.e. locally the void fraction RMSD drops as some regions remain filled with gas and the flow no longer has a clear shedding cycle. And, the shedding cycle gradually becomes harder to define as
 $Q_{I}/Q_{V,max}$
exceeds 0.48. By the time
 $Q_{I}/Q_{V,max}$
reached 1.20, no clearly discernible cycle can be observed. At the highest gas injection rates, the volume of the injected non-condensable gas surpasses that of the vapour, as expected.
Supplementary movies 1–7 showing sample datasets, some corresponding to cases from figures 12–14, further shed light on how the changes in average and RMSD void fraction manifest in the dynamics of the cavity.
(a) The time average and (b) root-mean-square deviation (RMSD)
 $\times 2$
(multiplied to enable sharing of the colour scale) of the void fraction fields for increasing rates of gas injection from the apex
 $Q_{I}/Q_{V,max}=0$
, 0.02, 0.05, 0.07, 0.12 and 0.16 increasing from top to bottom;
 $\unicode[STIX]{x1D70E}_{0}=$
2.0 and
 $U_{0}=8~\text{m}~\text{s}^{-1}$
. Results from three experiments nominally at the same conditions are averaged and shown here to reduce effect cycle-to-cycle variation may have.

(a) The time average and (b) RMSD
 $\times 2$
(multiplied to enable sharing of the colour scale) of the void fraction fields for increasing rates of gas injection into the mid-cavity
 $Q_{I}/Q_{V,max}=0$
, 0.02, 0.05, 0.07, 0.12 and 0.16 increasing from top to bottom;
 $\unicode[STIX]{x1D70E}_{0}=$
2.0 and
 $U_{0}=8~\text{m}~\text{s}^{-1}$
.

(a) The time average and (b) RMSD
 $\times 2$
(multiplied to enable sharing of the colour scale) of the void fraction fields for increasing rates of gas injection into the mid-cavity
 $Q_{I}/Q_{V,max}=0$
, 0.16, 0.32, 0.48, 0.80 and 1.20 increasing from top to bottom;
 $\unicode[STIX]{x1D70E}_{0}=2.0$
and
 $U_{0}=8~\text{m}~\text{s}^{-1}$
.

Apex gas injection with
 $Q_{I}/Q_{V,max}=0.07$
(a–c) and 0.16 (d–f); (a,d) the time-averaged void fraction distribution with outlines shown for two regions on interest (ROI); (b,e) time series of the spatially averaged void fraction and (c,f) gas volume.
 $\unicode[STIX]{x1D70E}_{0}=2.0$
and
 $U_{0}=8~\text{m}~\text{s}^{-1}$
.

Cavity gas injection with
 $Q_{I}/Q_{V,max}=0.07$
(a–c) and 0.16 (d–f); (a,d) the time-averaged void fraction distribution with outlines shown for two regions on interest (ROI); (b,e) time series of the spatially averaged void fraction and (c,f) gas volume.
 $\unicode[STIX]{x1D70E}_{0}=2.0$
and
 $U_{0}=8~\text{m}~\text{s}^{-1}$
.

The average maximum vapour production rate
 $C_{V,max}=Q_{V,max}/U_{0}L_{C10\%}b$
, as a function of
 $Q_{I}/Q_{V,max}$
;
 $\unicode[STIX]{x1D70E}_{0}=2.0$
and
 $U_{0}=8~\text{m}~\text{s}^{-1}$
. The vertical bars indicate the standard deviation of the vapour production peak values.

4.2 Influence of gas injection on averaged void fraction and vapour production rate
Here we will first focus on cases of limited gas injection, where
 $Q_{I}/Q_{V,max}<0.16$
. Figure 15(a) presents the time-averaged void fraction distribution with outlines shown for the rectangular and 5 % time-averaged void fraction contour ROIs for apex injection at two gas fluxes of
 $Q_{I}/Q_{V,max}=0.07$
(figure 15
a–c) and 0.16 (figure 15
d–f). Compared to figure 5 we see that apex injection leads to a decrease in the cavity gas volume for increasing
 $Q_{I}/Q_{V,max}$
up to a point, as well as a remarkable reduction in the unsteadiness.
 $Q_{I}/Q_{V,max}\sim 0.07$
was the gas flux that led to the largest reduction in the average void fraction, as the non-condensable gas flux was sufficient to reduce vapour production, but not a significant contribution to it. The physical explanation for the decreased cavity gas volume and reduction in unsteadiness is that gas injection altered the cavity flow in two basic ways. First, injection of gas could suppress the formation of vapour. And this effect is pronounced for injection at the apex, where the injected gas would increase the local pressure in the suction peak region and could also alter the turbulent flow of the separating shear layer. Secondly, after vapour condenses more remains of bubbles containing non-condensable gas. Both of these can contribute to decrease in unsteadiness.
Figure 16 presents similar data for two cases of mid-cavity injection, with
 $Q_{I}/Q_{V,max}=0.07$
(figure 16
a–c) and 0.16 (figure 16
d–f). Again, compared to figure 5 the shedding cycle appears perturbed (i.e. it tends to be more irregular than without gas injection), and from these data it appears limited injection into the cavity produces an initial decrease in the total volume, but then an increase at higher injected fluxes, as also evident from later discussion and data shown in figure 18.
The normalized maximum gas production rate during injection,
 $C_{V,max}$
determined in the rectangular control volume is shown in figure 17 for increasing
 $Q_{I}/Q_{V,max}$
. (Compare to figures 6 and 7.) Note here that measured gas production rate is a combination of both water vaporization and non-condensable gas injection. Given that the non-condensable gas is injected steadily, we do not expect that the limited introduction of gas would modify the peak rate of gas production during a shedding cycle. Yet, the data suggest that limited gas injection does lead to a suppression of the peak gas production rate as evident from reduction in average peak vapour production rate. Also, the standard deviation (signified by the vertical error bars) is noticeably reduced for
 $Q_{I}/Q_{V,max}>\sim \!0.05$
. And, the reduction in average peak production rate is more significant for the case of gas injection from the apex.
The suppression of the gas production rate can be illustrated in another way by examining the amount of gas within the ROI for varying
 $Q_{I}/Q_{V,max}$
. If the ROI is a fixed control volume, and the mean flow is in equilibrium, we can assume that flux of non-condensable gas injected into the cavity will be equal to the flux at exit. If we assume that the average velocity of the exiting gas is a fraction of the free-stream velocity,
 $\unicode[STIX]{x1D705}U_{0}$
, (
 $\unicode[STIX]{x1D705}=0.5$
) and density of gas based on pressure averaged between apex and downstream pressure taps, then the volume balance in a ROI that encloses the mean cavity yields the following relationship between the volume of injected gas in the ROI,
 $V_{I}$
, as a function of the volumetric injection rate,
 $Q_{I}$
, with normalization based on the natural vapour production rate:
 $$\begin{eqnarray}V_{I}=\frac{Q_{I}L_{ROI}}{\unicode[STIX]{x1D705}U_{0}},\end{eqnarray}$$
where
 $L_{ROI}$
is the length of the region of interest over which volume is measured, and through which gas is assumed to move through at average velocity of
 $\unicode[STIX]{x1D705}U_{0}$
. This mass balance does not include the natural vapour production, so we can use it to compare the measured amount of vapour to the amount we would expect just from injection alone. Figure 18 plots the measured volume of gas,
 $V_{gas}$
, and scaled injected volume,
 $V_{I}$
, as a function of
 $Q_{I}/Q_{V,max}$
. At the low values of
 $Q_{I}/Q_{V,max}$
, natural vapour production dominates. However, as
 $Q_{I}/Q_{V,max}\rightarrow 1$
and beyond, the volume of the injected gas begins to comprise the majority of the gas in the cavity.
Examining time series of spanwise-averaged void fraction distribution (see supplementary movies 3–6), the influence of the gas injection location on cavity fluctuations can be more drastic than is made clear from previous figures. If we seek to define a single parameter that better captures the suppression of fluctuations, we can define the time average of the gas volume when the instantaneous void fraction is between chosen low (L) and high (H) threshold values
 $\unicode[STIX]{x1D6FC}_{L}$
and
 $\unicode[STIX]{x1D6FC}_{H}$
:
 $$\begin{eqnarray}\overline{V_{[\unicode[STIX]{x1D6FC}_{L},\unicode[STIX]{x1D6FC}_{H}]}}=\frac{1}{T}\int _{0}^{T}V(\unicode[STIX]{x1D6FC}_{L}<\unicode[STIX]{x1D6FC}<\unicode[STIX]{x1D6FC}_{H},t)\,\text{d}t.\end{eqnarray}$$
Comparing this quantity with two sets of thresholds,
 $\unicode[STIX]{x1D6FC}_{L1}$
and
 $\unicode[STIX]{x1D6FC}_{H1}$
, versus two different thresholds,
 $\unicode[STIX]{x1D6FC}_{L2}$
and
 $\unicode[STIX]{x1D6FC}_{H2}$
, we can scale the volume fraction fluctuations as
 $\overline{V_{[\unicode[STIX]{x1D6FC}_{L1},\unicode[STIX]{x1D6FC}_{H1}]}}/\overline{V_{[\unicode[STIX]{x1D6FC}_{L2},\unicode[STIX]{x1D6FC}_{H2}]}}$
. To avoid averaging over incomplete shedding cycles,
 $T$
is taken to be the cycle time multiplied by the largest integral multiple of full shedding cycles in the recorded data set. The data are presented in figure 19 for
 $\unicode[STIX]{x1D6FC}_{L1}=50\,\%$
,
 $\unicode[STIX]{x1D6FC}_{H1}=60\,\%$
,
 $\unicode[STIX]{x1D6FC}_{L2}=20\,\%$
, and,
 $\unicode[STIX]{x1D6FC}_{H2}=30\,\%$
for the apex and mid-cavity injection. The chosen threshold values provide a clear distinction between cases that, based on a video seen by a human observer, are easy to label as distinct. However, within a range
 $O(10\,\%)$
, other threshold values would also enabled similar distinction to be made. The ratio for mid-cavity injection falls from
 ${\sim}0.25$
to
 ${\sim}0.10$
with increasing gas injection, and this indicates that the relative periods of higher gas volume are reduced. The influence of apex injection is even more drastic, as increasing gas flux drives the relative period of high gas volume to almost zero.
4.3 Effect of gas injection on the mean cavity static pressure
Gas injection directly influences the mean static pressure in the region of flow separation (i.e. near the location of the suction peak) and within the cavity itself. Figure 20(a) presents the apex cavitation number
 $\unicode[STIX]{x1D70E}_{A}$
for
 $0<Q_{I}/Q_{V,max}<1.2$
. The data show that gas injection at the apex will approximately double
 $\unicode[STIX]{x1D70E}_{A}$
from
 ${\sim}0.08$
to
 ${\sim}0.17$
(
 $p_{A}$
from
 ${\sim}5$
kPa to
 ${\sim}8$
kPa) over the range of
 $0<Q_{I}/Q_{V,max}<0.2$
. A similar trend is observed for injection into the cavity, although about 1.5 times gas injection volume is needed to produce the same effect. Higher gas volumes injected into the cavity lead to further increases in pressure, but the effect saturates for
 $Q_{I}/Q_{V,max}>0.8$
. This result can be contrasted with the change in the downstream cavity pressure resulting from injection at either location. Figure 20(b) presents
 $\unicode[STIX]{x1D70E}_{C}$
for the same conditions. In this case the change is much less drastic, suggesting that the injection location in not an important factor.
Re-examining the data in figure 17, we see that at
 $Q_{I}/Q_{V,max}\sim 0.06$
for apex injection,
 $C_{V,max}$
has been reduced to
 ${\sim}0.01$
from a non-injection value of
 ${\sim}0.03$
. This would correspond to an increase in the cavitation number from
 $\unicode[STIX]{x1D70E}_{0}=2.0$
to a value of
 ${\sim}2.3$
for the non-injection (e.g. baseline) flow, if we consider the data of figure 7. The data from figure 20(a) suggest that injection at
 $Q_{I}/Q_{V,max}\sim 0.06$
increases the apex cavitation number by
 ${\sim}0.05$
. Thus, the increase in apex pressure due to injection can account for some of the suppression of the gas production, but not all. While the increase in mean pressure near the cavity detachment is likely to be the most direct effect that gas injection has on the vapour production, suppressing the liquid tension that results from the separated flow near the suction peak, the injection of gas into the turbulent shear layer may also depress the turbulent pressure fluctuations that can lead to vapour production (Gopalan & Katz Reference Gopalan and Katz2000; Iyer & Ceccio Reference Iyer and Ceccio2002; Chang et al.
Reference Chang, Ganesh, Yakushiji and Ceccio2011).
A plot the total gas (i.e. vapour and air) volume,
 $V_{gas}$
, and scaled amount of injected gas (i.e. air) vapour
 $V_{I}=Q_{I}L_{ROI}/\unicode[STIX]{x1D705}U_{0}$
as a function of
 $Q_{I}/Q_{V,max}$
, where
 $\unicode[STIX]{x1D705}=0.5$
. The similarity of slope between the observed and scaled injected gas volumes implies that
 $\unicode[STIX]{x1D705}\approx 0.5$
, i.e. the gas would be exiting the control volume with a speed of approximately half that of the free stream. At the low values of
 $Q_{I}/Q_{V,max}$
, natural vapour production dominates. However, as
 $Q_{I}/Q_{V,max}\rightarrow 1$
and beyond, the volume of the injected gas begins to dominate the flow.
 $\unicode[STIX]{x1D70E}_{0}=2.0$
and
 $U_{0}=8~\text{m}~\text{s}^{-1}$
.

The scaled volume fraction fluctuations
 $\overline{V_{[\unicode[STIX]{x1D6FC}_{L1},\unicode[STIX]{x1D6FC}_{H1}]}}/\overline{V_{[\unicode[STIX]{x1D6FC}_{L2},\unicode[STIX]{x1D6FC}_{H2}]}}$
for
 $\unicode[STIX]{x1D6FC}_{L1}=50\,\%$
,
 $\unicode[STIX]{x1D6FC}_{H1}=60\,\%$
,
 $\unicode[STIX]{x1D6FC}_{L2}=20\,\%$
and
 $\unicode[STIX]{x1D6FC}_{H2}=30\,\%$
for the apex and mid-cavity injection.
 $\unicode[STIX]{x1D70E}_{0}=2.0$
and
 $U_{0}=8~\text{m}~\text{s}^{-1}$
.

(a) The apex cavitation number,
 $\unicode[STIX]{x1D70E}_{A}$
, and (b) the cavity cavitation number,
 $\unicode[STIX]{x1D70E}_{C}$
, as a function of
 $Q_{I}/Q_{V,max}$
for apex and cavity injection. The vertical bars indicate standard deviation of the measured cavitation number;
 $\unicode[STIX]{x1D70E}_{0}=2.0$
and
 $U_{0}=8~\text{m}~\text{s}^{-1}$
.

The
 $s$
–
 $t$
diagram (at
 $n=2$
mm) for the apex injection case (same as that shown in figure 15
a–c) with
 $Q_{I}/Q_{V,max}=0.07$
,
 $\unicode[STIX]{x1D70E}_{0}=2.0$
and
 $U_{0}=8~\text{m}~\text{s}^{-1}$
. The scale bar on the right indicates void fraction and corresponding colour.

The
 $s$
–
 $t$
diagram (at
 $n=2$
mm) for the cavity injection case (same as that shown in figure 16
a–c) with
 $Q_{I}/Q_{V,max}=0.07$
,
 $\unicode[STIX]{x1D70E}_{0}=2.0$
and
 $U_{0}=8~\text{m}~\text{s}^{-1}$
.

Time traces of dynamic pressure at
 $p_{d1}$
and
 $p_{d2}$
and their fast Fourier transforms (FFTs) without gas injection. (Same case as shown in figures 5 and 8
b.)
 $Q_{I}/Q_{V,max}=0.00$
,
 $\unicode[STIX]{x1D70E}_{0}=2.0$
and
 $U_{0}=8~\text{m}~\text{s}^{-1}$
. The units of averages and standard deviations listed in the titles are (kPa) and (Hz).

Time traces of dynamic pressure at
 $p_{d1}$
and
 $p_{d2}$
, and their FFTs. With apex injection. (Same case as shown in figures 15
a–c and 21.)
 $Q_{I}/Q_{V,max}=0.07$
,
 $\unicode[STIX]{x1D70E}_{0}=2.0$
and
 $U_{0}=8~\text{m}~\text{s}^{-1}$
. The units of averages and standard deviations listed in the titles are (kPa) and (Hz).

Time traces of dynamic pressure at
 $p_{d1}$
and
 $p_{d2}$
and their FFTs. With cavity injection. (Same case as shown in figures 16
a–c and 22.)
 $Q_{I}/Q_{V,max}=0.07$
,
 $\unicode[STIX]{x1D70E}_{0}=2.0$
and
 $U_{0}=8~\text{m}~\text{s}^{-1}$
. The units of averages and standard deviations listed in the titles are (kPa) and (Hz).

The void fraction upstream of the shock (i.e. in the ‘core’ of the cavity) as a function of
 $\unicode[STIX]{x1D70E}_{A}$
for gas injection and the baseline case;
 $U_{0}=8~\text{m}~\text{s}^{-1}$
.

The speed of sound of the bubbly mixture for varying void fraction and pressure assuming the homogeneous frozen model and neglecting bubble dynamics.

The propagation speed in the laboratory frame of the void fraction discontinuity (which at high gas injection rates may no longer be a bubbly shock),
 $U_{FL}/U_{0}$
, as a function of
 $Q_{I}/Q_{V,max}$
for apex and cavity injection;
 $\unicode[STIX]{x1D70E}_{0}=2.0$
and
 $U_{0}=8~\text{m}~\text{s}^{-1}$
.

Variation of void fraction discontinuity propagation Mach number in laboratory frame for varying gas injection rates. Also shown are the expected shock speeds based on equation (5.2) (when
 $p_{B}>1.05p_{A}$
), with pressure downstream of shock assumed to be
 $p_{B}$
corrected by fraction of time it was covered by cavity (taken to be
 ${\sim}2/3$
of the time).

5 Effect of gas injection on the cavity shedding and bubbly shock formation
The above data reveal that gas injection into the cavity, even for limited relative injection rates, has a demonstrable effect on the average amount of gas within the cavity and the rate at which vapour is produced during the cavity growth and shedding cycle. Such gas injection also influences the dynamic behaviour of the cavity. At the baseline condition, the formation of the shock front is regular and occurs for almost every growth and shedding cycle. This cyclical regularity is somewhat reduced with mid-cavity injection at low fluxes and at high fluxes (
 $Q_{I}/Q_{V,max}\sim O(1)$
) the gas overwhelms the vapour. However, with apex injection, shock formation became much more irregular and could be suppressed completely even at relatively low
 $Q_{I}/Q_{V,max}\sim O(0.05)$
.
5.1 Space–time diagrams of the cavity flow with gas injection
Part of an approximately repeating
 $s$
–
 $t$
diagram for the non-injection cavity was presented in figure 8(b), and from such diagrams we determined the bubbly shock speed and the void fraction upstream of the shock (figures 9 and 10). We can compare these data to those for two injection cases to illustrate the effect of gas injection on shock formation. Figure 21 presents the
 $s$
–
 $t$
diagram for the apex injection case
 $Q_{I}/Q_{V,max}\sim 0.07$
, and figure 22 presents the
 $s$
–
 $t$
diagram for the mid-cavity injection case
 $Q_{I}/Q_{V,max}\sim 0.07$
. For the case of cavity injection, the cyclic nature of the shedding is modified but still present. But, for apex injection, the strong cyclical shedding has ceased. For both injection cases, the void fraction has been reduced by gas injection, and this suggests that the mechanisms responsible for vapour production are being suppressed by injection.
These same trends can be observed in the unsteady pressure measurements taken on the surface of the wedge. Figures 23–25 correspond to the conditions shown above. Here, the upstream unsteady pressure,
 $p_{d1}(t)$
, and
 $p_{d2}(t)$
are plotted in (a) and (b), and the spectrum of each is presented in (c). Limiting apex gas injection significantly reduces the amplitude of the pressure fluctuations, which is consistent with the observation of reduced void fraction fluctuations. Mid-cavity injection had less of an effect, with the cavity dynamics still present, but somewhat reduced.
5.2 Void fraction upstream of the bubbly shock
From figure 10, we have shown that the void fraction upstream of the shock front in the baseline condition varies with the cavitation number, and it ranges from
 $0.5<\unicode[STIX]{x1D6FC}_{core}<0.9$
. The variation of the maximum (i.e. core) void fraction with the surrounding pressure is an important observation, as we have shown above that the process of gas injection can significantly change the static pressure at the apex. We would expect that apex injection would lead to an increase in static pressure and, therefore a decrease in the core void fraction. And, this is the case, as shown in figure 26. The baseline (no gas injection) data from figure 10 are plotted as a function of
 $\unicode[STIX]{x1D70E}_{A}$
for varying
 $\unicode[STIX]{x1D70E}_{0}$
along with the core void fraction measured during gas injection at the apex injection for fixed
 $\unicode[STIX]{x1D70E}_{0}=2.0$
. The relationship between the core void fraction and apex pressure is similar whether apex pressure changes due to gas injection or reference pressure.
5.3 Modification of speed of sound of gas mixture with gas injection
The speed of sound in a bubbly mixture can be estimated form an approximate relationship derived by Brennen (Reference Brennen2005), and subsequently experimentally confirmed by Shamsborhan et al. (Reference Shamsborhan, Coutier-Delgosha, Caignaert and Nour2010). Ignoring the bubble dynamics, mass transfer and assuming a homogeneous equilibrium model, the speed of sound in a bubbly flow is given by Brennen (Reference Brennen2005) as
 $$\begin{eqnarray}\frac{1}{c^{2}}=[\unicode[STIX]{x1D70C}_{L}(1-\unicode[STIX]{x1D6FC})+\unicode[STIX]{x1D70C}_{G}\unicode[STIX]{x1D6FC}]\left[\frac{\unicode[STIX]{x1D6FC}}{kp}+\frac{1-\unicode[STIX]{x1D6FC}}{\unicode[STIX]{x1D70C}_{L}c_{L}^{2}}\right].\end{eqnarray}$$
Where for water vapour the polytropic index,
 $k$
, is 1.3 for an adiabatic process, and 1 for an isothermal process. For the following sections, an adiabatic process is assumed. (It can be noted that for this simple model, based data from Brennen (Reference Brennen2005) and Shamsborhan et al. (Reference Shamsborhan, Coutier-Delgosha, Caignaert and Nour2010), the difference this assumption makes for the present case is insignificant in comparison to uncertainty of the experimental data we are discussing.) As evident from (5.1), increasing the cavity mixture pressure (whether by reference pressure change or gas injection) increases the speed of sound, and it is possible conditions become less favourable for shocking, as discussed in Ganesh et al. (Reference Ganesh, Mäkiharju and Ceccio2016). Speed of sound upstream of the shock
 $c_{1}$
can be obtained from (5.1) by using the mean cavity pressure,
 $p_{A}$
, and the averaged void fraction upstream of the shock
 $\unicode[STIX]{x1D6FC}_{1}$
. The variation of speed on sound of this type of bubbly mixture is shown in figure 27. Brennen (Reference Brennen2005), Shamsborhan et al. (Reference Shamsborhan, Coutier-Delgosha, Caignaert and Nour2010), Budich, Schmidt & Adams (Reference Budich, Schmidt and Adams2016) present a useful discussion concerning the different approaches that can be used to determine the speed of sound in a bubbly mixture, including the ‘frozen’ model used here, compared to the ‘equilibrium’ model that can allow for phase transition.
5.4 Modification of the bubbly shock propagation with gas injection
Ganesh et al. (Reference Ganesh, Mäkiharju and Ceccio2016) also discussed how a simple model for the shock speed is useful in interpreting the observed results. Again, ignoring the effects of bubble dynamics and assuming an isothermal flow, we may develop the following relationship for the expected propagation speed of the condensation front:
 $$\begin{eqnarray}U_{1}^{2}=\frac{p_{2}-p_{1}}{\unicode[STIX]{x1D70C}}\frac{(1-\unicode[STIX]{x1D6FC}_{2})}{(1-\unicode[STIX]{x1D6FC}_{1})(\unicode[STIX]{x1D6FC}_{1}-\unicode[STIX]{x1D6FC}_{2})},\end{eqnarray}$$
where
 $\unicode[STIX]{x1D6FC}_{1}$
and
 $p_{1}$
and
 $\unicode[STIX]{x1D6FC}_{2}$
and
 $p_{2}$
are the void fraction and static pressures upstream and downstream of the front, taking as
 $\unicode[STIX]{x1D6FC}_{1}\approx \unicode[STIX]{x1D6FC}_{core}$
that was given in figure 10. We will similarly assume that
 $U_{1}\approx U_{FL}$
, the discontinuity front speed measured with X-ray visualization in the laboratory frame of reference. (At higher gas fluxes, based on observed dynamics we refer to a discontinuity front to be more general, as this may no longer be a shock.) The void fraction discontinuity propagation speed
 $U_{FL}/U_{0}$
is shown in figure 28 as a function of
 $Q_{I}/Q_{V,max}$
. For both apex and mid-cavity gas injection, the introduction of non-condensable gas reduced the observed discontinuity front speed.
We can use the relationship between the expected shock speed (5.2), pressure and void fraction to discern how gas injection can modify the shock speed, and perhaps eventually eliminate shocks. There are two primary mechanisms through which injection can have an effect. First, the injection of gas will change the void fraction of the cavity flow; and second, gas injection will modify the local cavity pressure. The data presented above show that even limited gas injection can decrease the core void fraction and increase the cavity pressure.
A decrease in the pressure difference across the shock will decrease the shock speed. However, examination of (5.2) indicates that the shock speed may be reduced or increased through modification of the maximum void fraction within the cavity. Setting the derivative of (5.2) with respect to cavity void fraction upstream of the shock, (
 $\unicode[STIX]{x2202}U_{1}/\unicode[STIX]{x2202}\unicode[STIX]{x1D6FC}_{1}$
), equal to zero, we define the critical void fraction
 $\unicode[STIX]{x1D6FC}_{1,cr}=(1+\unicode[STIX]{x1D6FC}_{2})/2$
. When
 $\unicode[STIX]{x1D6FC}_{1}<\unicode[STIX]{x1D6FC}_{1,cr}$
, a decrease in the core void fraction upstream of the front will lead to an increase in the shock speed. While, with
 $\unicode[STIX]{x1D6FC}_{1}>\unicode[STIX]{x1D6FC}_{1,cr}$
, a decrease in the core void fraction will lead to a decrease shock speed. The void fraction downstream of the shock was almost constant, with
 $\unicode[STIX]{x1D6FC}_{2}\approx 0.22$
. This would make
 $\unicode[STIX]{x1D6FC}_{1,cr}\approx 0.61$
. The data in figure 26 show that the void fraction upstream of the shock is typically greater than 0.6. Hence, we would expect that, all else being equal, decreases in the core void fraction would contribute to a decrease in the shock speed, which was observed.
The reduction in the core void fraction from 0.9 to 0.6 would lead to a reduction in the sound shock speed
 $U_{FL}/U_{0}$
by around
 $2/3$
with all else held constant. From figure 28, we see that the shock speed has decreased by around a factor of
 $1/4$
. Therefore, we expect gas injection to decrease the pressure difference (
 $p_{2}-p_{1}$
) equal to a factor of
 $(3/8)^{2}\approx 0.14$
. A proxy for the pressure difference across the shock is the difference between the cavity and apex static pressure. Examining figure 20 and raw data, we can see that limited injection leads to a doubling of the apex pressure and a 50 % increase in the cavity pressure, which would substantially reduce the pressure difference. Indeed, when
 $Q_{I}/Q_{V,max}\approx 0.2$
, the pressure difference is almost eliminated. Ganesh et al. (Reference Ganesh, Mäkiharju and Ceccio2016) showed that the measured pressure across the shock front for the baseline flow is of the order of 4 kPa. Therefore, an increase in (
 $p_{2}-p_{1}$
) of only one or two kPa would be sufficient to slow the speed of the shock, and this amount is well within the pressure rises caused by gas injection.
Based on the discontinuity propagation speeds in the laboratory frame shown in figure 28, and the speed of sound upstream of the discontinuity shown in figure 27, the Mach number of the discontinuity front propagation can be estimated, and these data are shown in figure 29. As the injection rates increases, the void fraction discontinuity tends to propagate sub-sonically, at least in the laboratory frame. That is, if it is truly sub-sonic, it can no longer be a shock, thus supporting the interpretation of time series recordings that the shedding mechanism may have switched to one dominated by a re-entrant jet. Furthermore, for many cycles the roll up of the vapour cavity occurred whilst propagation of a sharp thick region of condensation was not observable in the X-ray recording, which would be consistent with transition of the shedding mechanism to a re-entrant jet type.
5.5 Shedding frequency
The introduction of gas reduced the dominant shedding frequency,
 $f$
, as shown in figure 30(a). The Strouhal number based on the cavity length was also modified by gas injection, and this is presented in figure 30(b). Recall that the length of the cavity decreases with increasing volume flux. Therefore, St remains roughly constant with increasing gas flux for mid-cavity injection, even though the shedding frequency is reduced. We note that in case of the apex injection, or injection at a high gas flux
 $Q_{I}/Q_{V,max}\sim O(1)$
, the cavity became only weakly periodic, and the definition of dominant frequency is not necessarily comparable to the dynamics associated with cavity shedding.
6 Conclusions
In the present work, we extend the observations of partial cavity flows reported by Ganesh et al. (Reference Ganesh, Mäkiharju and Ceccio2016). We examine how dissolved gas might influence the cavity dynamics, and we observed how limited non-condensable gas injection into the cavity could alter the cavity topology and dynamics. For the range of dissolved gas contents examined, variation of the free-stream dissolved gas content (as determined based on the dissolved oxygen content) did not change any measured property of the cavity flow within the limits of our measurement uncertainty. This is not to say that free-stream gas content can never play a role in partial cavity inception and dynamics. Rather, we conclude here that any mass transfer of dissolved non-condensable gas into the developed partial cavity with a strongly enforced separation line did not have any appreciable influence. This is also implied by the results of Lee et al. (Reference Lee, Mäkiharju, Ganesh and Ceccio2016), who examined diffusion into limited cavities on the same geometry. From their results, we would expect the maximum rate of gas mass diffusion into the cavity to be of the order of
 $10^{-6}~\text{kg}~\text{s}^{-1}$
, which would occur at the highest dissolved gas content. This would lead to a volume flow rate of
 $Q_{DO}\approx 2\times 10^{-5}~\text{m}^{3}~\text{s}^{-1}$
, or
 $Q_{DO}/Q_{V,max}\approx 10^{-2}$
, which is almost an order of magnitude smaller that the limiting rates on gas injection needed to measurably influence the baseline cavity flow. We should also note that this insensitivity to water quality differs from the observation of Kawakami, Arndt & Qin (Reference Kawakami, Arndt and Qin2005) who found a significant effect of spectra of the cavitation. In their study, the lack of available dissolved and free gas (nuclei) supressed the re-growth of a periodically shedding cavity forming near the leading edge of a two-dimensional hydrofoil. In the present study, the cavity formed at the sharp separation line of the wedge apex and was accompanied by a strong suction peak. Unlike Kawakami et al. (Reference Kawakami, Arndt and Qin2005), we did not observe a complete re-wetting of the cavitating surface during the cavity shedding cycle. This suggests that the rate of vapour production may be an important consideration when assessing the relative importance of dissolved gas content on the dynamics of partial cavitation. Similarly, the presence of many free gas nuclei can modify the boundary layers that occur on smooth flow surfaces upstream of cavity detachment, resulting in the modification or elimination of sheet cavitation, as discussed by Briançon-Marjollet, Franc & Michel (Reference Briançon-Marjollet, Franc and Michel1990) and Li & Ceccio (Reference Li and Ceccio1996). This is another way that free gas content can alter the inception and development of sheet cavitation, but it is not applicable with the cavity forming on the wedge apex. Interestingly, numerical studies discussing similar effects of free nuclei and nucleation on hydrofoils were conducted by Ma, Hsiao & Chahine (Reference Ma, Hsiao and Chahine2015) and Hsiao, Ma & Chahine (Reference Hsiao, Ma and Chahine2017) and, as observed in present study, show relative insensitivity to free stream nuclei contents, which in present study is related to dissolved gas contents.
(a) The shedding frequency and (b) Strouhal number (
 $L_{10\%}\sim 7.6T_{10\%}$
) as a function of gas injection rate. Note that in case of the apex injection the cavity became only weakly periodic, and the definition of dominant frequency is not necessarily meaningful.

Injection of non-condensable gas into the cavity from both the apex and the mid-cavity did lead to significant changes in the cavity flow, even for cases of limited gas injection with
 $Q_{I}/Q_{V,max}\approx 10^{-1}$
. Gas injection altered the cavity flow in two basic ways. First, injection of gas could suppress the formation of vapour, leading to the curious observation that the injection of gas could reduce the mean volume fraction in the cavity. This effect was most pronounced for injection at the apex, where the injected gas would increase the local pressure in the suction peak region and could alter the turbulent flow of the separating shear layer. Injection of gas at the mid-cavity also led to increases in the mean cavity pressure and a reduction in vapour production, however, to a significantly lower degree.
By altering the cavity volume fraction and pressure, gas injection led to significant changes in the overall cavity dynamics. The formation of bubbly shock waves is a fundamental process for cavity shedding of the baseline flow. Gas injection suppressed (or even eliminated) shock formation. When the shocks formed, they were often slower than the non-injection conditions. This change was related to modification of both the maximum (pre-shock) void fraction and the local cavity pressure. Therefore, these results suggest that non-condensable gas injection can supress cavity shedding that results from bubbly shock formation. This would then allow re-entrant shedding re-emerge as the dominant mechanism.
Acknowledgements
This work was sponsored by the Office of Naval Research under grant N00014-14-1-0292, Dr K.-H. Kim program manager.
Supplementary movies
Supplementary movies are available at https://doi.org/10.1017/jfm.2017.569.



