


Sixty years ago, in what has become one of the most widely cited articles in the study of political behavior, Philip Converse argued that the American public was not ideological ([1964] Reference Converse2006). He demonstrated that many people’s attitudes toward political issues changed readily over time and their attitudes toward different issues were not consistently liberal or conservative. In other words, Americans’ attitudes were not stable or ideologically constrained.Footnote 1
Characterizing stability and constraint in issue attitudes has been a central goal for scholars of political behavior in the years that have followed Converse’s essay. Although explanations vary, the field has coalesced around an account that centers on cues from political elites: people attentive to politics form issue attitudes based on signals from the party or ideological leaders they prefer (Converse Reference Converse2006; Freeder, Lenz, and Turney Reference Freeder, Lenz and Turney2019; Hetherington Reference Hetherington2001; Lenz Reference Lenz2012; Zaller Reference Zaller1992). In this account, which has primarily focused on partisan cues, political elites’ signals are the main source of stability and constraint in Americans’ attitudes; for the sizable portion of the public that does not receive these cues, attitudes remain unstable and unorganized.
However, in a less-referenced portion of his 1964 essay, Converse suggested another explanation: attitudes toward prominent nonparty social groups could provide stability and constraint in Americans’ issue attitudes.Footnote 2 Noting the durability and interconnectedness of attitudes toward racial issues, he argued that attitudes toward core social groups could structure attitudes toward a network of related policies. For example, the interconnectedness of attitudes toward crime, school busing, and civil rights could boil down to a single question: “Are you sympathetic to [African-Americans] as a group?” (Converse Reference Converse2006, 38). However, Converse writes, “we have no direct empirical evidence supporting this illustration” (Converse Reference Converse2006, 39). Despite being central to Converse’s influential theory of belief systems in the mass public, and related to a rich literature on social groups (Achen and Bartels Reference Achen and Bartels2017; Ahler and Sood Reference Ahler and Sood2018; Mason Reference Mason2018; Tajfel and Turner Reference Tajfel, Turner, Austin and Worchel1979), this prospect has not yet been empirically explored.
We show that attitudes toward social groups, coupled with knowledge of what policies those social groups support and oppose, structure political belief systems. Knowledge about where social groups stand on political issues is widespread—in some cases, more widespread than knowledge about where the major parties stand. In the 1970s, for example, African Americans were generally more supportive of economic redistribution than white Americans, and 68% of people knew this fact. However, only 51% knew that Democrats were more supportive of economic redistribution than Republicans.
Because of this widespread knowledge, social groups can fill a role much like that of party or other political elites in theories of social learning (Converse Reference Converse2006; Lenz Reference Lenz2012; Zaller Reference Zaller1992): when people know where a preferred social group stands on an issue, they can form an issue attitude aligned with their group preference. Knowledge of social group positions shapes Americans’ attitudes much like—and sometimes more powerfully than—knowledge of party positions. Due to the nature of the data available on this topic, the evidence we present here is focused on knowledge about racial groups; future work may take up the question of how this theory applies to other important social groups.
Knowledge of nonparty social group positions explains substantial variation in two features of public opinion scholars have studied for decades: response instability over time and constraint between issue attitudes. People who know which social groups support or oppose a policy are more likely to maintain the same attitude toward the policy months and years later. We argue this stability arises from the fact that people’s attitudes toward social groups are quite stable (e.g., Converse Reference Converse2006; Sears and Funk Reference Sears and Funk1999; Tesler Reference Tesler2014). When an issue is linked to a social group, a stable attitude toward the linked social group generates more consistent evaluations of the issue.
Similarly, when people associate a social group with multiple political issues, social group attitudes create what Converse calls constraint: people who know which policies a group supports and opposes hold consistently liberal or conservative positions across issues related to that group. Attitudes toward policies linked to the same group are correlated due to their common source; negative (positive) attitudes toward a group foster negative (positive) attitudes toward an array of policies associated with that group.
The importance of social group placement knowledge varies over time. Throughout the 1970s, social group knowledge was the dominant source of stability and constraint in Americans’ issue attitudes, but today party position knowledge has supplanted it. What might explain this variation? Building on a rich literature on social identity, social sorting, and affective polarization (e.g., Iyengar et al. Reference Iyengar, Lelkes, Levendusky, Malhotra and Westwood2019; Mason Reference Mason2018), we find that party position knowledge is most powerful when people’s social identities and group affect align with their party membership. Social group knowledge best explains stability and constraint when people’s attitudes toward party-aligned groups are at odds with their partisanship (e.g., a racially conservative Democrat). As more people have come to belong to parties that match their group memberships or identities (an increase in what Mason [Reference Mason2016] calls social sorting), party knowledge has become more important in structuring belief systems. These findings extend a nascent scholarship on the interaction between affective polarization and issue attitudes (Dias and Lelkes Reference Dias and Lelkes2021; Orr and Huber Reference Orr and Huber2020).
The account presented here offers a new way—or rather, new evidence on an old way—of understanding how Americans organize their political beliefs. Research has long shown that many Americans explain their feelings about parties and candidates by referencing nonparty social groups (Converse Reference Converse2006; Lewis-Beck et al. Reference Lewis-Beck, Norpoth, Jacoby and Weisberg2008). Our evidence that social groups are central to belief systems echoes the accounts citizens have long offered for their own attitudes. By measuring the kinds of knowledge many voters say they use to make sense of politics, we can better understand which voters have the information they need to form stable and constrained political attitudes (Lupia Reference Lupia2006).
Social Groups and Belief Systems
Social groups structure political behavior in myriad ways. A robust scholarship documents that social groups—including, but certainly not limited to partisan groups—are core to how people evaluate parties (Achen and Bartels Reference Achen and Bartels2017; Ahler and Sood Reference Ahler and Sood2018), candidates (Crowder-Meyer et al. Reference Crowder-Meyer, Gadarian, Trounstine and Vue2020; Teele, Kalla, and Rosenbluth Reference Teele, Kalla and Rosenbluth2018), and issues (Conover and Feldman Reference Conover and Feldman1984; Sears, Hensler, and Speer Reference Sears, Hensler and Speer1979; Tesler Reference Tesler2014). When these group memberships are internalized as a social identity, they can powerfully affect how people define their interests and view those inside and outside the group (Tajfel and Turner Reference Tajfel, Turner, Austin and Worchel1979). More broadly, the race, class, and gender groups people belong to equip them with norms and values that shape how they engage with politics (see Anoll Reference Anoll2018; White and Laird Reference White and Laird2020, for example).
Recent work on affective polarization has underscored the primacy of group-related attitudes and emotions in political behavior.Footnote 3 Though this is an area of ongoing research, growing evidence suggests that group-related partisan considerations are more important to Americans’ political behavior than their positions on policy issues (Dias and Lelkes Reference Dias and Lelkes2021; Huddy, Mason, and Aarøe Reference Huddy, Mason and Aarøe2015; Huddy and Yair Reference Huddy and Yair2021; but see Orr and Huber Reference Orr and Huber2020). These findings raise questions about the extent to which issue positions, a primary building block for theories of democratic accountability, are tied up with—and perhaps causally subsequent to—social group attitudes.
Building on this work, we ask what a social group-focused account of political attitudes can contribute to the field’s long-standing quest to characterize belief systems in public opinion. If deep-seated prejudices against and favor toward social groups are tied to how Americans think about so many political objects, how might we expect people to organize their political beliefs? Prior work has documented the importance of party to belief systems. We argue that nonpartisan social groups also act as central elements for stabilizing and unifying attitudes toward an array of political issues related to social groups.
Americans’ Knowledge of Social Group Attitudes
Our central claim is that when people associate nonparty social groups with a political issue, they form attitudes toward the issue that are more durable over time (attitude stability) and more consistent with their attitudes toward other policies associated with those groups (constraint). Knowledge of groups’ positions links political issues to group attitudes, and this linkage generates stability and constraint.
The starting point of this theory is knowledge: for nonparty social group attitudes to affect policy attitudes, people must know (or have beliefsFootnote 4) about linkages between social groups and policies. Many policies in American politics are linked, both in political discourse and in public opinion, to a small set of groups. It is not necessary or realistic that people know the position of every social group on every issue. Instead, we suggest that people associate any given policy with a particular group or set of groups, often groups who demand or oppose the policy.
These group–policy links are clearest in the case of policies that directly benefit a particular constituency: the legalization of gay marriage is associated with LGBT people, and food stamps are associated with the poor. Other policies are associated with the kinds of people who demand them. Feminists demand equal pay for women, business groups demand industry deregulation, and environmentalists demand environmental policy. Though explicitly political groups (e.g., Republicans, liberals) are of course linked to policies, we focus here on nonpartisan social groups, as these groups’ links to policy have been less explored in work on belief systems.
Groups become linked to policies when they are paired, explicitly or implicitly, in communications from media and political elites. Elites sometimes explicitly communicate the kinds of people they wish the public to associate with a policy—that is, the policy’s “target population”—by describing the group memberships and personal attributes of people the policy harms or helps (Schneider and Ingram Reference Schneider and Ingram1993). But often, explicit linkages are unnecessary. People can associate policies with groups by inferring from context the kinds of people who might benefit or by observing the kinds of people who are linked to the policy in their lives or in media. In an example of the latter, Gilens (Reference Gilens2009) demonstrates that media images of Black, rather than white, poverty have forged an association between African Americans and welfare policy.
Like all forms of political knowledge, knowledge about the groups who demand or benefit from policies is unevenly distributed in the populace. We expect that for many important policies, however, this knowledge will extend beyond the most politically engaged citizens and into portions of the public who pay little attention to party politics and political news. People can passively absorb information about the groups associated with a policy through exposure to political messages, interpersonal conversations, or media portrayals that make these linkages clear. Mere exposure, incidental or otherwise, to discussion of a policy should often be sufficient to link it to a relevant social group.
When people know the groups linked to a policy, their attitudes toward the groups can affect their attitude toward the policy.Footnote 5 For example, elites can damage the popularity of policies they dislike by pairing the policies with stigmatized groups (Schneider and Ingram Reference Schneider and Ingram1993). Stereotypes of those stigmatized groups spill over onto evaluations of policies associated with them. Thus, group affect may influence policy attitudes through prejudice and negative associations. Positive group-related attitudes can also matter, as when someone supports a policy because they learn it benefits a group they like (Tesler and Sears Reference Tesler and Sears2010).Footnote 6
There is ample evidence that people’s attitudes toward social groups affect their attitudes toward political objects associated with those groups, from diverse literatures on symbolic politics (Sears, Hensler, and Speer Reference Sears, Hensler and Speer1979), heuristic use (Petersen et al. Reference Petersen, Slothuus, Stubager and Togeby2011), media effects (Gilens Reference Gilens2009), issue framing (Nelson and Kinder Reference Nelson and Kinder1996), and the origins of ideological beliefs (Conover and Feldman Reference Conover and Feldman1981; Kerlinger Reference Kerlinger1967). However, this prior work generally has not described the mass public’s knowledge of what policies are associated with what groups. Returning to the case of welfare policy and African Americans illustrates this point. Gilens (Reference Gilens2009) finds that priming the recipients of welfare as Black rather than white decreases support for welfare spending among whites. Gilens, among others, has also found that public opinion surveys show an observational relationship between racial resentment and support for welfare and other economic programs (Gilens Reference Gilens2009; Kinder and Mendelberg Reference Kinder and Mendelberg2000, 56). Combining this evidence, it seems that people’s welfare attitudes reflect underlying racial resentment because African Americans and welfare have been linked in the public’s mind.
Yet, to our knowledge, there has been no exploration of how many people associate welfare policies with African Americans absent researcher intervention. This leaves open the question of how common knowledge of groups and associated policies is “in the wild”–that is, how much of the public knows which groups are associated with important policies, absent any researcher intervention. Answering this question can help us understand why, and for whom, group attitudes structure public opinion.
Social Group Knowledge Increases Attitude Stability and Constraint
In his influential account of ideology in the mass public, Philip Converse argues that many Americans do not hold well-thought-out policy positions that are linked to an underlying ideological predisposition; instead, their attitudes are “idiosyncratic.” Idiosyncratic attitudes have two markers: they change over time, and they are not organized into liberal or conservative issue bundles (Converse Reference Converse2006; 44–8). For example, Converse reports in his essay that he asked a set of respondents whether the federal government should provide funding to needy school districts. He then asked those same respondents the same question two years later and found that many gave much different answers. Furthermore, answers about school funding were only weakly related to positions on other issues; knowing a respondent’s opinion about education spending, for example, conveyed little about how the respondent felt toward privatizing infrastructure.
Converse took these idiosyncratic—that is, unstable and unconstrained—issue positions as evidence that “large portions of an electorate do not have meaningful beliefs, even on issues that have formed the basis for intense political controversy among elites for substantial periods of time” (Converse Reference Converse2006, 50–1).
However, Converse also suggested that attitudes toward issues associated with nonparty social groups may be less idiosyncratic than other issue attitudes. Comparing the stability of attitudes toward several issues, “the items that stand out as most stable,” he said, “are those that have obvious bearing on a population grouping” (Converse Reference Converse2006, 46–67; see also Sears and Funk Reference Sears and Funk1999; Tesler Reference Tesler2014). And when discussing the associations between attitudes toward different issues, he noted that less-informed people may have interrelated attitudes toward multiple policies that concern African Americans—more interrelated, even, than attitudes toward those same issues among the highly informed (38–41). We explore this possibility here.
Knowledge of the groups that support and oppose a policy promotes stable attitudes because it provides a consistent way to evaluate the policy. A primary reason that issue attitudes fluctuate over time is that people judge issues based on different criteria at different times, depending on what information is salient (Zaller Reference Zaller1992). Judging policies by the groups that demand or benefit from them is a common and cognitively easy shortcut (Petersen et al. Reference Petersen, Slothuus, Stubager and Togeby2011), perhaps because of the centrality of social groups to political thought (see, e.g., Achen and Bartels Reference Achen and Bartels2017; Conover and Feldman Reference Conover and Feldman1984). Attitudes toward social groups are relatively stable over time (Sears and Funk Reference Sears and Funk1999), so policy positions consistently based on social group attitudes should be stable as well. People knowledgeable about an issue’s group linkages therefore ought to have more stable attitudes toward the issue than people who do not have this information.
Knowledge of group–policy links promotes constraint in a similar way. When a group attitude serves as the basis for judging a single issue consistently over time, the result is attitude stability; when a group attitude serves as the basis for judging multiple issues across domains, the result is attitude constraint. We consider someone’s attitudes to be “constrained” if their attitude toward policy issue X correlates with their attitude toward policy issue Y through a common cause. We expect that when people perceive or know two policies to be linked to the same group, they are more likely to hold consistently liberal or conservative positions on those issues.
Constraint between issue attitudes arises naturally from a process in which attitudes toward policies are based on attitudes toward those who support or oppose the policy: attitudes toward policies linked to the same group will be correlated due to their common source. For example, the racialization of both welfare and crime and punishment (e.g., Mendelberg Reference Mendelberg2001) would mean that support or opposition to each of these policies is linked to affect toward African Americans.
Because we expect social group placement knowledge to be widespread in the mass public, we also expect stability and constraint based on social group attitudes to be more pervasive than Converse’s analysis would suggest. If people across the spectrum of political sophistication know the issue positions of social groups, this knowledge can serve as a source of organization in the belief systems of many in the mass public.
Group Knowledge in a Partisan Context
Recent work on the structure of belief systems centers on the effects of political parties. This scholarship argues that voters who learn their party’s position on an issue adopt that position, creating both stability and constraint (Achen and Bartels Reference Achen and Bartels2017; Freeder, Lenz, and Turney Reference Freeder, Lenz and Turney2019; Lenz Reference Lenz2012). The role we attribute to social groups in this paper mirrors the effect other scholars attribute to party and ideological leaders: when people know where social groups they favor or disfavor stand on an issue, they adopt an attitude toward the issue that aligns with that of favored groups. We think of following parties and social groups not as competing explanations, but as natural complements, with social groups and partisanship varying in relative importance between individuals and over time.
We expect knowledge about issue-group linkages to be most influential when the parties’ positions on an issue are undifferentiated, unclear, or recently taken. For any number of reasons, partisan elites may not send clear signals about where they stand on an issue, and less politically attentive people may not receive the signals party leaders do send. However, policies rarely become salient without demanders and beneficiaries. The group memberships of these advocates can be ubiquitous in discussions of a policy, even when party positions are absent. In the time between an issue becoming salient and its partisan implications becoming clear, even the most partisan voters may rely on the issue’s group ties in forming attitudes toward it.
Even when parties’ positions are clearly broadcast and widely received, knowledge of those positions should matter more for some people than others. Recent work on the growing importance of partisanship suggests that party (and therefore, party positions) should matter most to people who are “socially sorted”—that is, people with social group memberships and attitudes that match their party identification (Mason Reference Mason2018; Wronski, Kane, and Mason Reference Wronski, Kane and Mason2021). People who are not sorted are likely to be cross-pressured by their partisan and social group attachments and therefore should be less likely to rely solely on party position knowledge, even in an era when that knowledge is at a record high (Freeder, Lenz, and Turney Reference Freeder, Lenz and Turney2019).
Moving beyond particular issues and subgroups, the importance of partisanship to political behavior has grown substantially over the past 30 years. Americans increasingly see partisanship as a social identity, as evidenced by their growing preference for in-party members over the out-party (Iyengar et al. Reference Iyengar, Lelkes, Levendusky, Malhotra and Westwood2019; Iyengar, Sood, and Lelkes Reference Iyengar, Sood and Lelkes2012). Work in this area has documented the effects of affective polarization on outcomes related to intergroup relations, like discrimination (Iyengar and Westwood Reference Iyengar and Westwood2015), emotions (Huddy, Mason, and Aarøe Reference Huddy, Mason and Aarøe2015), and social distance (Huber and Malhotra Reference Huber and Malhotra2017). In other words, partisan groups have come to play a role more like what racial or cultural groups have played for decades, shaping attitudes and behavior toward in-group and out-group members. However, to our knowledge, this literature has not focused on the effect increasing partisan identity has had on partisan cue taking or attitude stability and constraint.
If our predictions are borne out, racial and cultural groups play another important role: they allow people to build coherent belief systems by forming attitudes based on their knowledge of where these groups stand on political issues. As partisan groups have come to play a more similar psychological role to that of other salient social groups, we expect they have come to shape belief systems in a more similar way as well. Freeder, Lenz, and Turney (Reference Freeder, Lenz and Turney2019) provide evidence consistent with this: knowledge of parties’ positions has grown alongside polarization, leading more Americans to form stable, party-aligned issue attitudes. Otherwise, though, the implications of the increasingly group-like role of party for belief systems remain unexplored.
Analysis and Results
Data and Measures
To test our hypotheses about the role of group position knowledge in public opinion, we first draw on data from the American National Election Studies (ANES). These data consist of surveys of nationally representative samples of the American public, carried out in election years since the 1950s. In particular, we draw on two sets of studies. The first is the 1972, 1974, and 1976 ANES, which includes both a cross-sectional and panel component. The second is the 1992–1997 panel study, which interviewed combinations of fresh and repeated respondents in eight waves over these six years.Footnote 7 We use these studies because they are the only years in which the ANES includes questions about where people think nonparty social groups (e.g., racial groups) stand on political issues, which we use to measure knowledge of social group–policy links.
Because the ANES has not asked respondents to place social groups on policies since 1997, we supplement these data with a nationally representative cross section recruited through NORC-Amerispeak during March–April 2021 (N = 565) and a two-wave panel of respondents recruited through YouGov during March–April 2021 (N = 451 in wave 1; N = 347 in wave 2). NORC-Amerispeak maintains a probability-sampled nationally representative panel of respondents, and YouGov’s online panel is a highly regarded data source for academic surveys (Stoker and McCall Reference Stoker, McCall, Fisher, Fieldhouse, Franklin, Gibson, Cantijoch and Wlezien2017). In these 2021 studies we, as closely as possible, replicate the question wording used in the ANES. For simplicity in presentation, we combine our 2021 samples.Footnote 8
The American National Election Studies survey asks respondents their positions on a range of political issues each year. They also ask respondents where they believe the Democratic and Republican party stand on issues and, in some years, where they believe social groups like “most Black people” and “most white people” stand on various issues. For example, respondents are often asked whether they believe that the “government in Washington should see to it that every person has a job and a good standard of living … or if the government should just let each person get ahead on his own.” Respondents place their own attitudes on a 1–7 scale. On that same 1–7 scale, respondents then rate where they believe “most whites” and “most Blacks” would place themselves on that scale, where the Republican party stands, and so on.
We use these questions to measure respondents’ knowledge about the associations between social groups and political issues. We code a respondent as correctly placing racial groups if they perceive that most whites hold more conservative preferences on the policy than most Blacks. (Across each of the policies in our sample, whites do have more conservative preferences than Blacks [Brady and Sniderman Reference Brady and Sniderman1985, 1064], though we detail two instructive exceptions in our results section.) Likewise, in the case of party (and ideological) groups, we code the respondent as correctly placing the parties if the respondent perceives the Republican party (or conservatives) to be more conservative than the Democratic party (or liberals). Respondents who place the parties or racial groups in reverse positions, at the same point, or indicate that they “don’t know,” are labeled as not knowing.Footnote 9
Racial and partisan groups are the only groups asked about in both the 1970s and 1990s, so much of our analysis focuses on knowledge of racial and partisan positions. However, in 1976 the ANES asked respondents where they believe “most businessmen” and “most poor people” stand on three economic policies; where “most men” and “most women” stood on a question of gender equality; and in 1997, where respondents believe “most Christian Fundamentalists” and “most Gays and Lesbians” stood on a question of gender equality. As above, we label that someone “knows” the groups’ positions if they place the more conservative group (businessmen, Christian Fundamentalists, men) to the right of the more liberal group (poor people, LGBT people, women) on the group-related policy question.Footnote 10
By comparing respondents’ placements of different groups on an issue, we can identify which respondents know that one group supports a policy more than a comparison group does. Though measuring knowledge of relative group support does not capture all the ways in which policies can be linked to particular groups, we expect the measure to capture most respondents who are aware that particular groups demand or benefit from each policy.
The analysis that follows focuses on the role of racial group position knowledge, except where explicitly noted in the section describing levels of social group knowledge. Only racial group questions are included in both ANES periods, and over-time comparison is important to our analysis. To ensure our contemporary data is comparable with these earlier surveys, our 2021 studies also focus on racial group knowledge.Footnote 11 We view race as an especially useful social category to study because racial groups are linked to a range of different policy areas (racial, economic, crime), which is valuable in studying constraint. However, Section 6 in the Supplementary Information replicates the results for the analyses that are possible with other social groups (class, gender, and culture war issues); the results are consistent with those presented below.
Americans’ Knowledge of Social Group Preferences
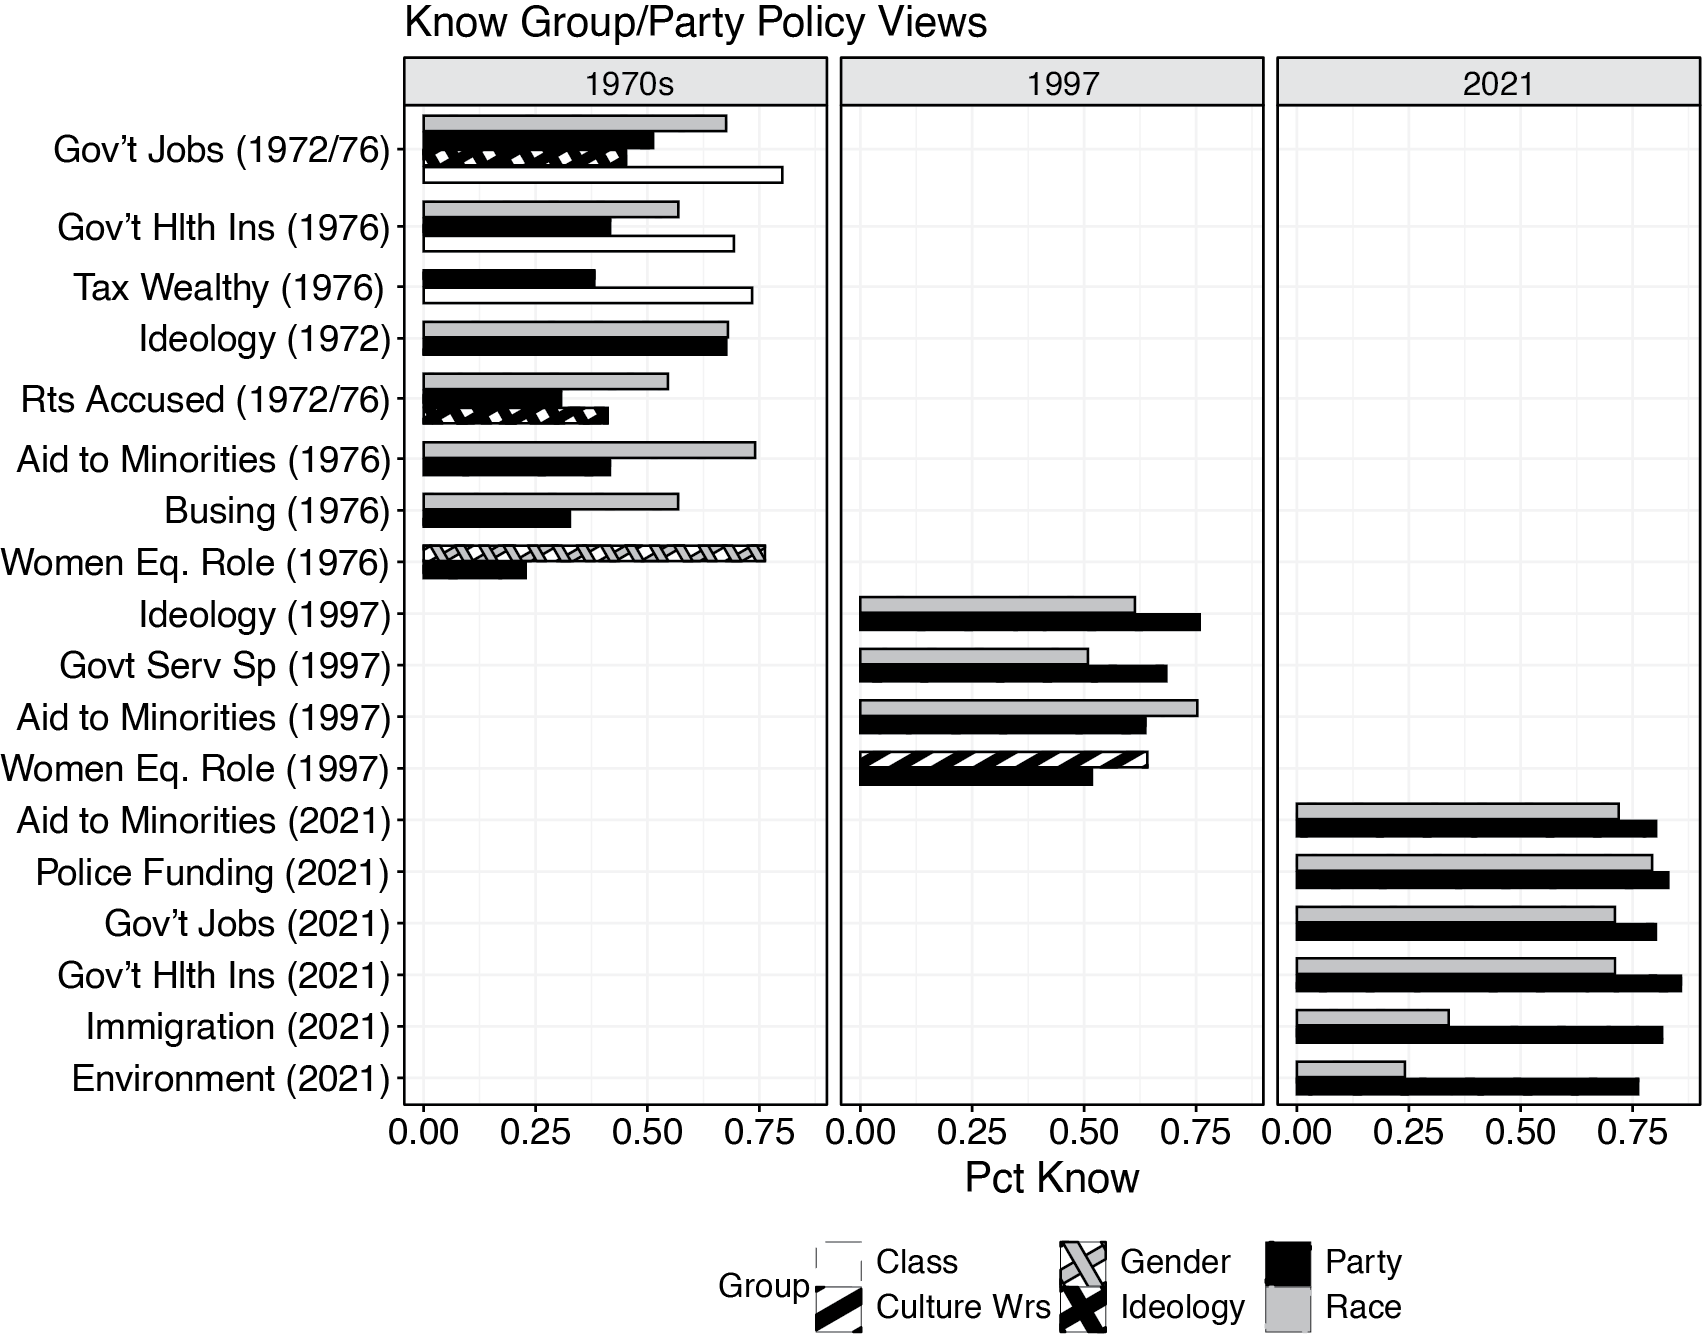
We first document levels of knowledge in the American public about the positions various social groups hold on political issues. Using the questions described above, we calculate the percentage of Americans who correctly place social groups—and, for comparison, parties and ideological groups—on a variety of political issues. Figure 1 presents levels of knowledge about the positions of partisan and social groups on all the issues for which placement questions were included on the ANES or our contemporary surveys. We find that many people have a rich knowledge of where various social groups stand.
Party and Social Group Position Knowledge
Note: The graph shows the proportion of respondents who correctly place white people to the right of Black people (gray bars), Republicans to the right of Democrats (black bars), conservatives to the right of liberals (black crossed bars), businessmen to the right of poor people (white bars), men to the right of women (gray crossed bars), and evangelical Christians to the right of LGBT people/feminists (black striped bars) for each policy position. Data are from the 1972 and 1976 ANES cross sections, the 1997 ANES pilot study, our 2021 NORC cross section, and wave 1 of our YouGov study. For questions included in both 2021 surveys, we take an average. Because group knowledge is asked on government guarantee of jobs and rights of the accused in 1972 and 1976, we combine and then average the knowledge. Data are weighted; see Footnote footnote 8 for description.

The results in the left-hand panel of Figure 1 are striking. In the 1970s, people generally had a weak sense of where the parties stood on policy issues. Even on economic policy, on which the parties had clearly differed for decades and which consumed much of the political agenda at the time, fewer than 50% of respondents perceived Republicans to be less supportive of redistribution than Democrats. On race-related policies, party knowledge falls even lower—despite the Democratic Party clearly emerging as the leftward party on civil rights in the 1960s.Footnote 12
Knowledge of where racial groups stood on various policy issues in the 1970s is much higher. Unsurprisingly, people can often identify where racial groups stand on racial issues. But even on economic issues, respondents in the 1970s had a good sense of where racial groups stood—particularly when compared with their knowledge of party positions. Knowledge of class groups’ positions on economic issues is even higher than knowledge of racial groups’. Finally, the proportion placing women to the left of men on the issue of women’s equality far outstrips the proportion placing Democrats to the left of Republicans.Footnote 13
By 1997 respondents had become more knowledgeable about the parties’ positions on racial and economic issues; knowledge of party positions on these issues met or surpassed knowledge of racial group positions, and levels remained similar in 2021. However, 1997 respondents’ knowledge of the parties’ views on gender-related issues lagged slightly behind their knowledge of relevant social groups’ positions, perhaps a sign that parties’ positions on these issues were not yet clear.
We take these results as evidence that voters learn links between groups and group-related policies from their political context. However, it could be that people are simply knowledgeable about where social groups stand on all issues regardless of those groups and issues being paired together in discourse. To test this, we included two policy questions on our 2021 survey—general immigration levels and environmental protection—which lacked an obvious connection to racial groups (the environment) or in which Black and white respondents actually held similar positions (immigration levels), so we would not expect respondents to be accurate at identifying the relative positions of Black and white people. Indeed, this is what we find: knowledge of racial groups’ positions on these issues is far lower than for the issues linked to race in public discussion.Footnote 14
Taken together, these results suggest that knowledge about the social groups that support and oppose important political issues is common in the American public. At least half of respondents are able to place social groups correctly on any given social-group-related issue, a proportion that is largely unchanged over the past 50 years. However, Americans’ ability to place parties on issues has grown quickly over this period. Although group placement knowledge used to be far more common than party placement knowledge on many issues, both are now about equally common: even on policies like government assistance to minority groups, knowledge of parties’ positions is as high or higher than knowledge of racial groups’ positions.
Social Group Knowledge Generates Attitude Stability
We next turn to the topic of attitude stability. The results in the previous section suggest that many voters know which social groups support and oppose relevant policy issues. For these people, we argue, group attitudes can serve as a consistent basis for evaluation of an issue, leading to stable preferences over time. This section tests the prediction that people who know an issue’s supporters and opponents have more stable attitudes toward the issue.
We test this proposition using data from the 1972-1974-1976 ANES panel, the 1992–1997 ANES panel, and a two-wave panel of respondents recruited on YouGov in Spring 2021. To measure attitude stability for each respondent, we take the standard deviation of each person’s responses to an issue question across each of the three survey waves (two waves for YouGov; we rescale all policy variables to range 0–1).Footnote 15 For ease of interpretation, we multiply this number by 100. People who have stable attitudes will have scores closer to 0, whereas people who have less stable attitudes will have higher scores.Footnote 16
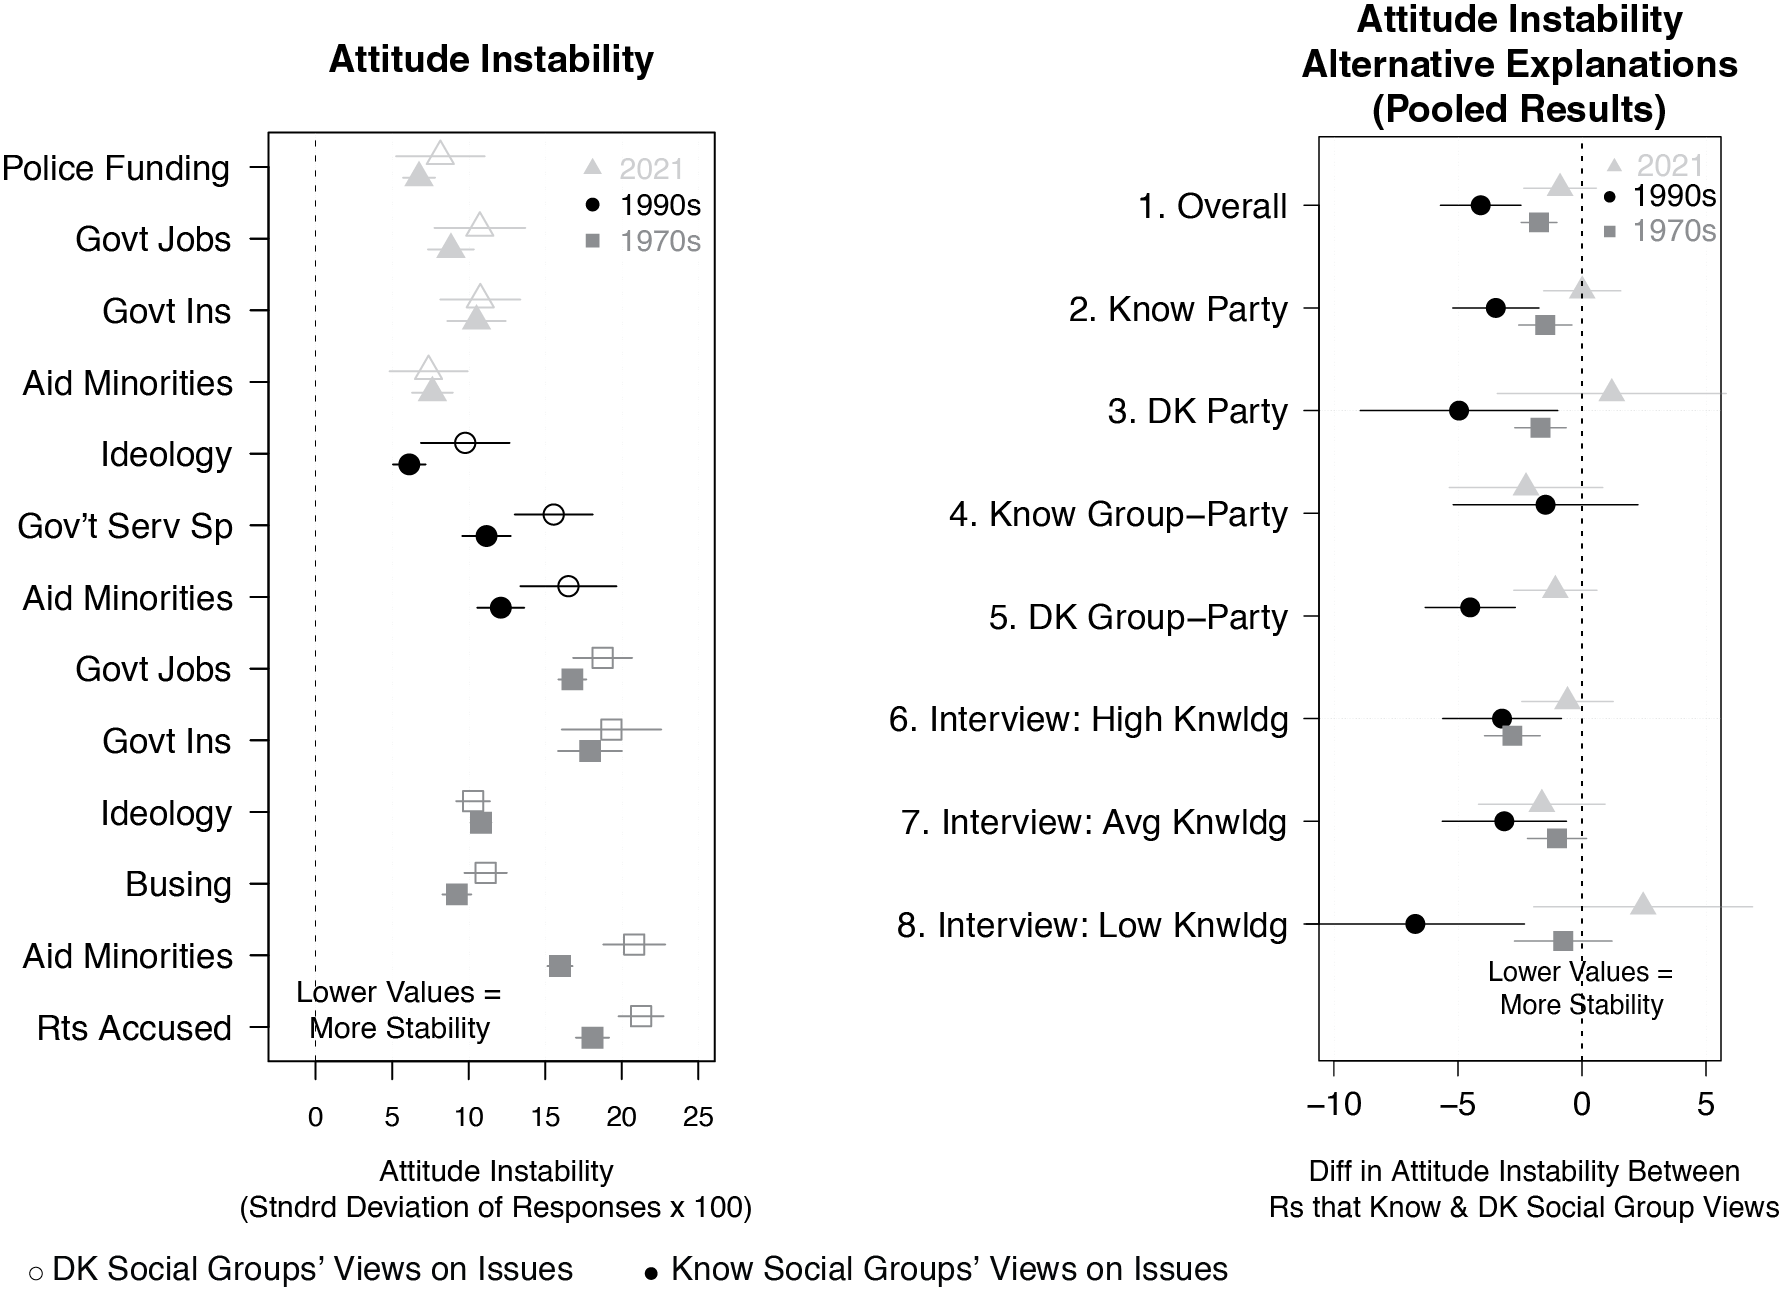
We compare levels of issue attitude stability between respondents who do and do not place the racial groups correctly on each issue. The left-hand panel of Figure 2 shows that people who know where the social groups stand on issues have more stable attitudes, albeit to varying degrees, across each question in the 1970s and 1990s surveys.Footnote 17 By 2021, however, this relationship has weakened.
Attitude Instability by Knowledge of Social Group Policy Views
Note: Left Panel: Lower values represent more stable attitudes over time. Point estimates represent the average standard deviation of a respondent’s attitudes across survey waves. Closed shapes include respondents who know the racial social group’s position; open shapes represent those who do not know the social group’s position. Right Panel: Each coefficient represents the average difference in stability between respondents who know and do not know the social groups’ policy views. For example, the top gray square (1970s) in the right-hand panel represents the average difference (precision weighted) of each set of gray squares (1970s) in the left-hand-panel. Data are weighted; see Footnote footnote 8 for description of weighting. For full results as regression tables, see section 9 of the secondary appendix.

The first line of the right-hand panel of Figure 2 then presents precision-weighted averages, across all issues, of the difference in attitude stability between respondents who do and do not know the groups’ positions on each issue. For example, the top gray square in the right-hand panel represents the average difference in attitude instability between those that know and do not know the racial groups’ policy views across all the issues in the 1970s panel. (This equals the average difference between each of the pairs of gray squares in the left-hand panel.) By 2021, people who can accurately place racial groups do not have appreciably more stable attitudes than those who cannot. However, in the earlier periods, people who know the groups’ positions have more stable attitudes than those who do not. This pattern is consistent with our argument that knowledge of social group positions produces stability in issue attitudes.
The remaining rows of Figure 2’s right panel test three alternative explanations for higher stability among people who know where racial groups stand. All three relate to the notion that people who know where racial groups stand are more likely to know more about other aspects of politics as well. First, it could be that knowledge of party positions explains the association between group knowledge and stability. People who know where the parties stand on important issues tend to share their party’s positions, and these positions tend to be stable (Freeder, Lenz, and Turney Reference Freeder, Lenz and Turney2019; Lenz Reference Lenz2012). Knowledge about the parties’ positions, if correlated with knowledge of groups’ positions, could explain the levels of stability among those with high social group knowledge. If the effect of group knowledge on issue attitudes were reducible to party knowledge, group knowledge would have no effect among people who do not know where the parties stand.
To test this alternative explanation, we divide respondents into groups based on whether they know the parties’ positions on each issue. For both groups, we then plot the relationship between group placement knowledge and attitude stability in the second and third lines of Figure 2. In each year, respondents who do and do not know the parties’ positions look similar: within both groups, respondents who know which social groups support a policy have more stable attitudes than those who do not. Knowledge of party positions cannot fully explain the relationship between group knowledge and issue stability.
A related possibility is that people know that African Americans are allied with the Democratic party and whites tend toward the Republican party. This knowledge could link racial attitudes to issue attitudes through the intermediate step of party.Footnote 18 The 1997 ANES and 2021 YouGov survey contain questions that allow us to measure whether respondents know which social groups are aligned with which party.
Lines 4 and 5 of Figure 2 compare results among respondents who do and do not know which parties the social groups in question support. In 2021, the effect of social group knowledge on stability is similar in both groups. In 1997, the relationship is stronger among people who do not know the group–party alignments—the opposite of what we would expect if group–party alignment knowledge explained the effect of social group position knowledge. These results suggest that knowledge of social groups’ party alignments is not responsible for the relationship between group-policy knowledge and stable attitudes.
A third alternative explanation is that the effect of social group knowledge is reducible to the effect of general knowledge; that is, people who know where the racial groups stand simply know more about politics and are therefore more likely to have stable attitudes (Ansolabehere, Rodden, and Snyder Reference Ansolabehere, Rodden and Snyder2008). To test this, we split the sample into three groups based on how the ANES interviewer judged each respondent’s overall political knowledge: above average, average, or below average.Footnote 19 Lines 6–8 divide respondents by their level of interviewer-rated political knowledge. Across all three levels, respondents who know the groups’ positions have more stable attitudes than those who do not. Again, other forms of political knowledge cannot explain the relationship between social group knowledge and attitude stability.
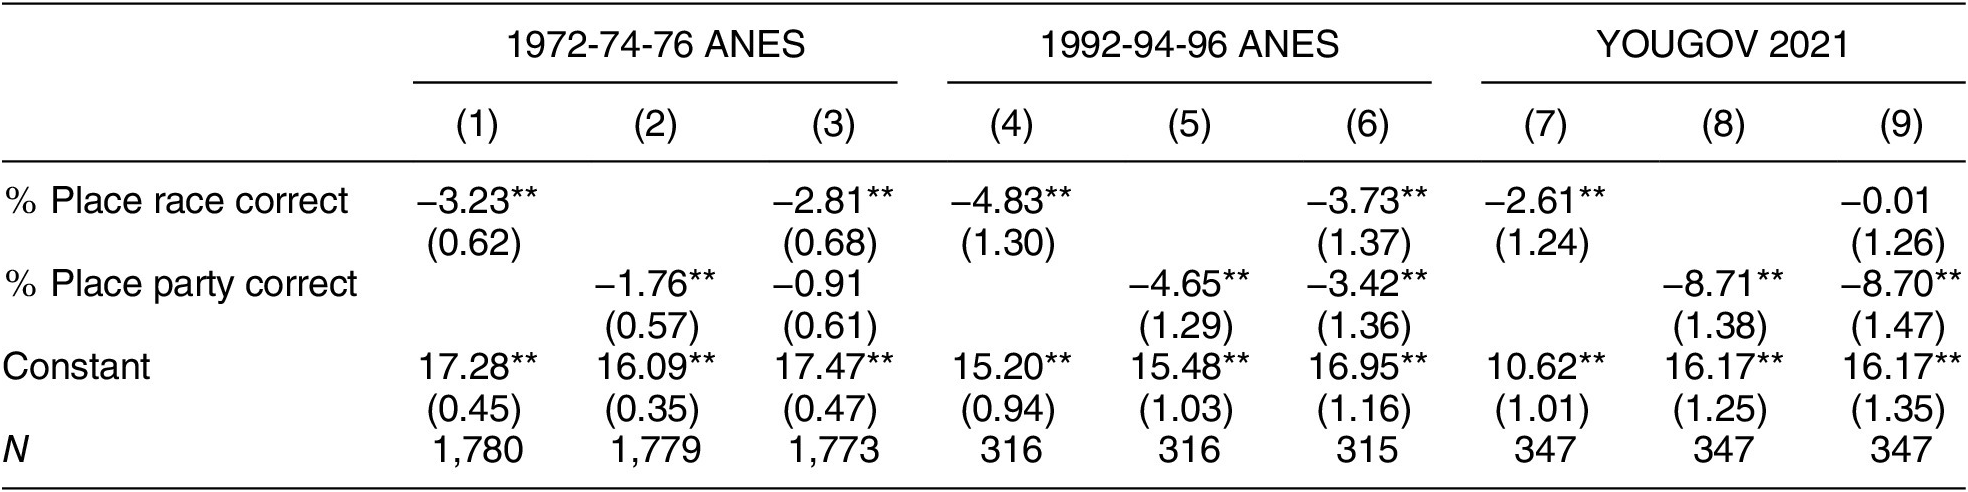
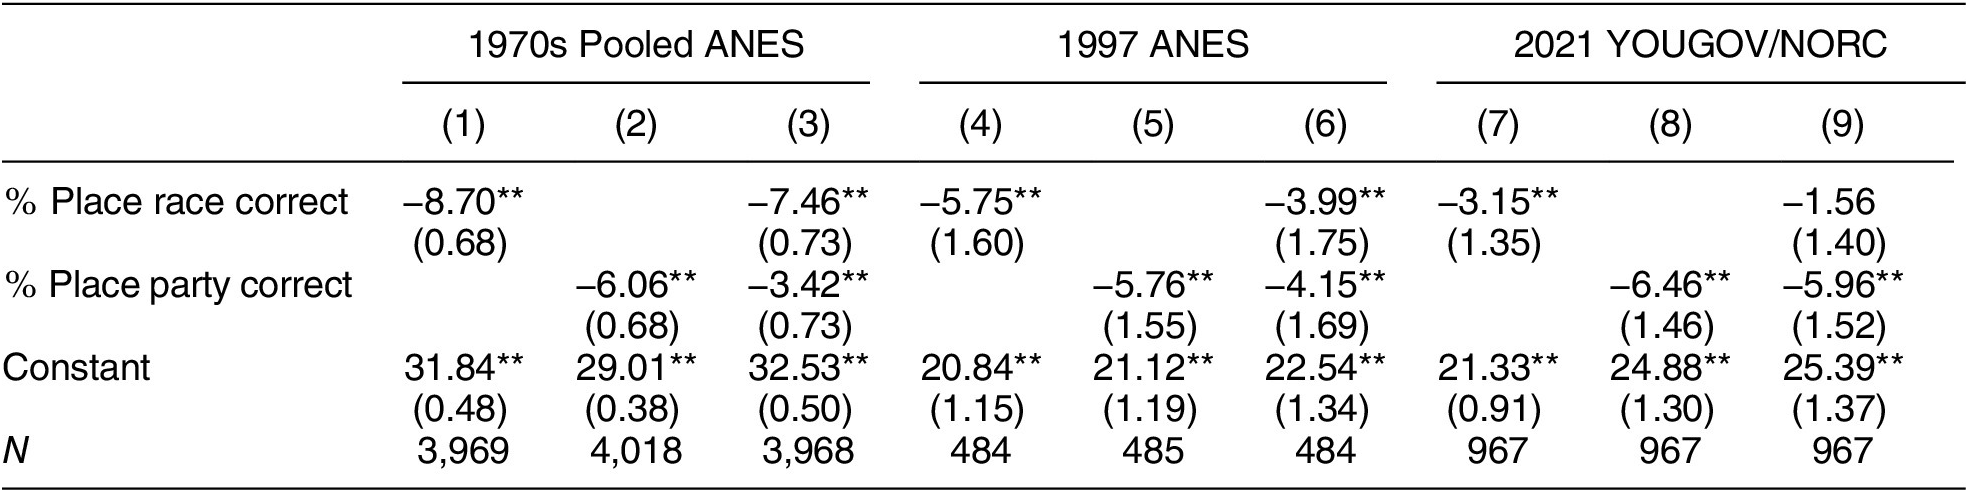
Next, we investigate the possibility that the relative importance of knowledge about nonparty social groups and party groups’ positions to attitude stability has changed over time. As discussed above, partisanship has grown stronger over the period from our earliest data to our most recent; we therefore compare the relationship between attitude stability, party placement knowledge, and group placement knowledge over time. To do this, we first create an index measure of stability by averaging the stability measure across all issues for each respondent and, as in the earlier results, multiply this value by 100. We regress this stability measure on the percentage of policies on which respondents place groups correctly, the percentage of policies on which they place the parties correctly, and then both. We expect that as voters are able to correctly place parties and groups on more policies, the standard deviations in their attitudes over time will decrease—that is, they will hold more stable attitudes.
Table 1 shows the relationship between attitude stability and group placement knowledge. In all bivariate models, race and party position knowledge predict more stable attitudes.Footnote 20
Attitude Stability: Comparing Social Group Knowledge and Partisan Cues. Standard errors in parentheses; average standard deviation 1970s × 100 = 15; average standard deviation 1990s × 100 = 12; average standard deviation 2021 × 100 = 9.

Note: The outcome is the average standard deviation of a respondent’s attitudes across each issue (measured at different points) multiplied by 100. A value of zero means that a respondent gave the same answer to policy X in each survey wave. Lower values equal more over-time stability; % Place race correct is scaled 0–1 and represents the percentage of times a respondent correctly places white people to the right of Black people across each policy. % Place party correct is scaled analogously for the placement of Republicans to the right of Democrats. Data are weighted; see Footnote footnote 8 for description. Standard errors in parentheses; average standard deviation 1970s × 100 = 15; average standard deviation 1990s × 100 = 12; average standard deviation 2021 × 100 = 9. *p < 0.10, **p < 0.05.
When the two types of knowledge are pitted against one another, we find that in the 1970s, racial group knowledge is a stronger predictor of attitude stability than is party knowledge. In the 1990s, party and racial group knowledge are similarly strong predictors. This is striking: for decades after Converse wrote, social groups generated stable preferences as much or more than partisan knowledge. By 2021, however, it appears that the effect of party knowledge dominates. As party has generally become more influential in Americans’ political behavior, its power to structure issue attitudes has grown.
Social Group Knowledge Generates Ideological Constraint
We next turn to ideological constraint. If, as we argue, people form policy attitudes based on their attitudes toward the groups that demand or benefit from the policy, constraint should arise naturally among attitudes toward issues that relate to the same group. That is, if a social group (e.g., African Americans, Evangelical Christians, feminists) is associated with multiple issues, attitudes toward those issues ought to be related due to their shared group basis. However, we expect this to happen only, or much more strongly, among people who are aware of the group–issue associations. As in the previous section, we focus on racial group knowledge for reasons of data availability.Footnote 21 For these analyses, we use data from the 1972 and 1976 cross section, the 1997 pilot (cross section), our 2021 NORC sample, and wave 1 of our 2021 YouGov sample.
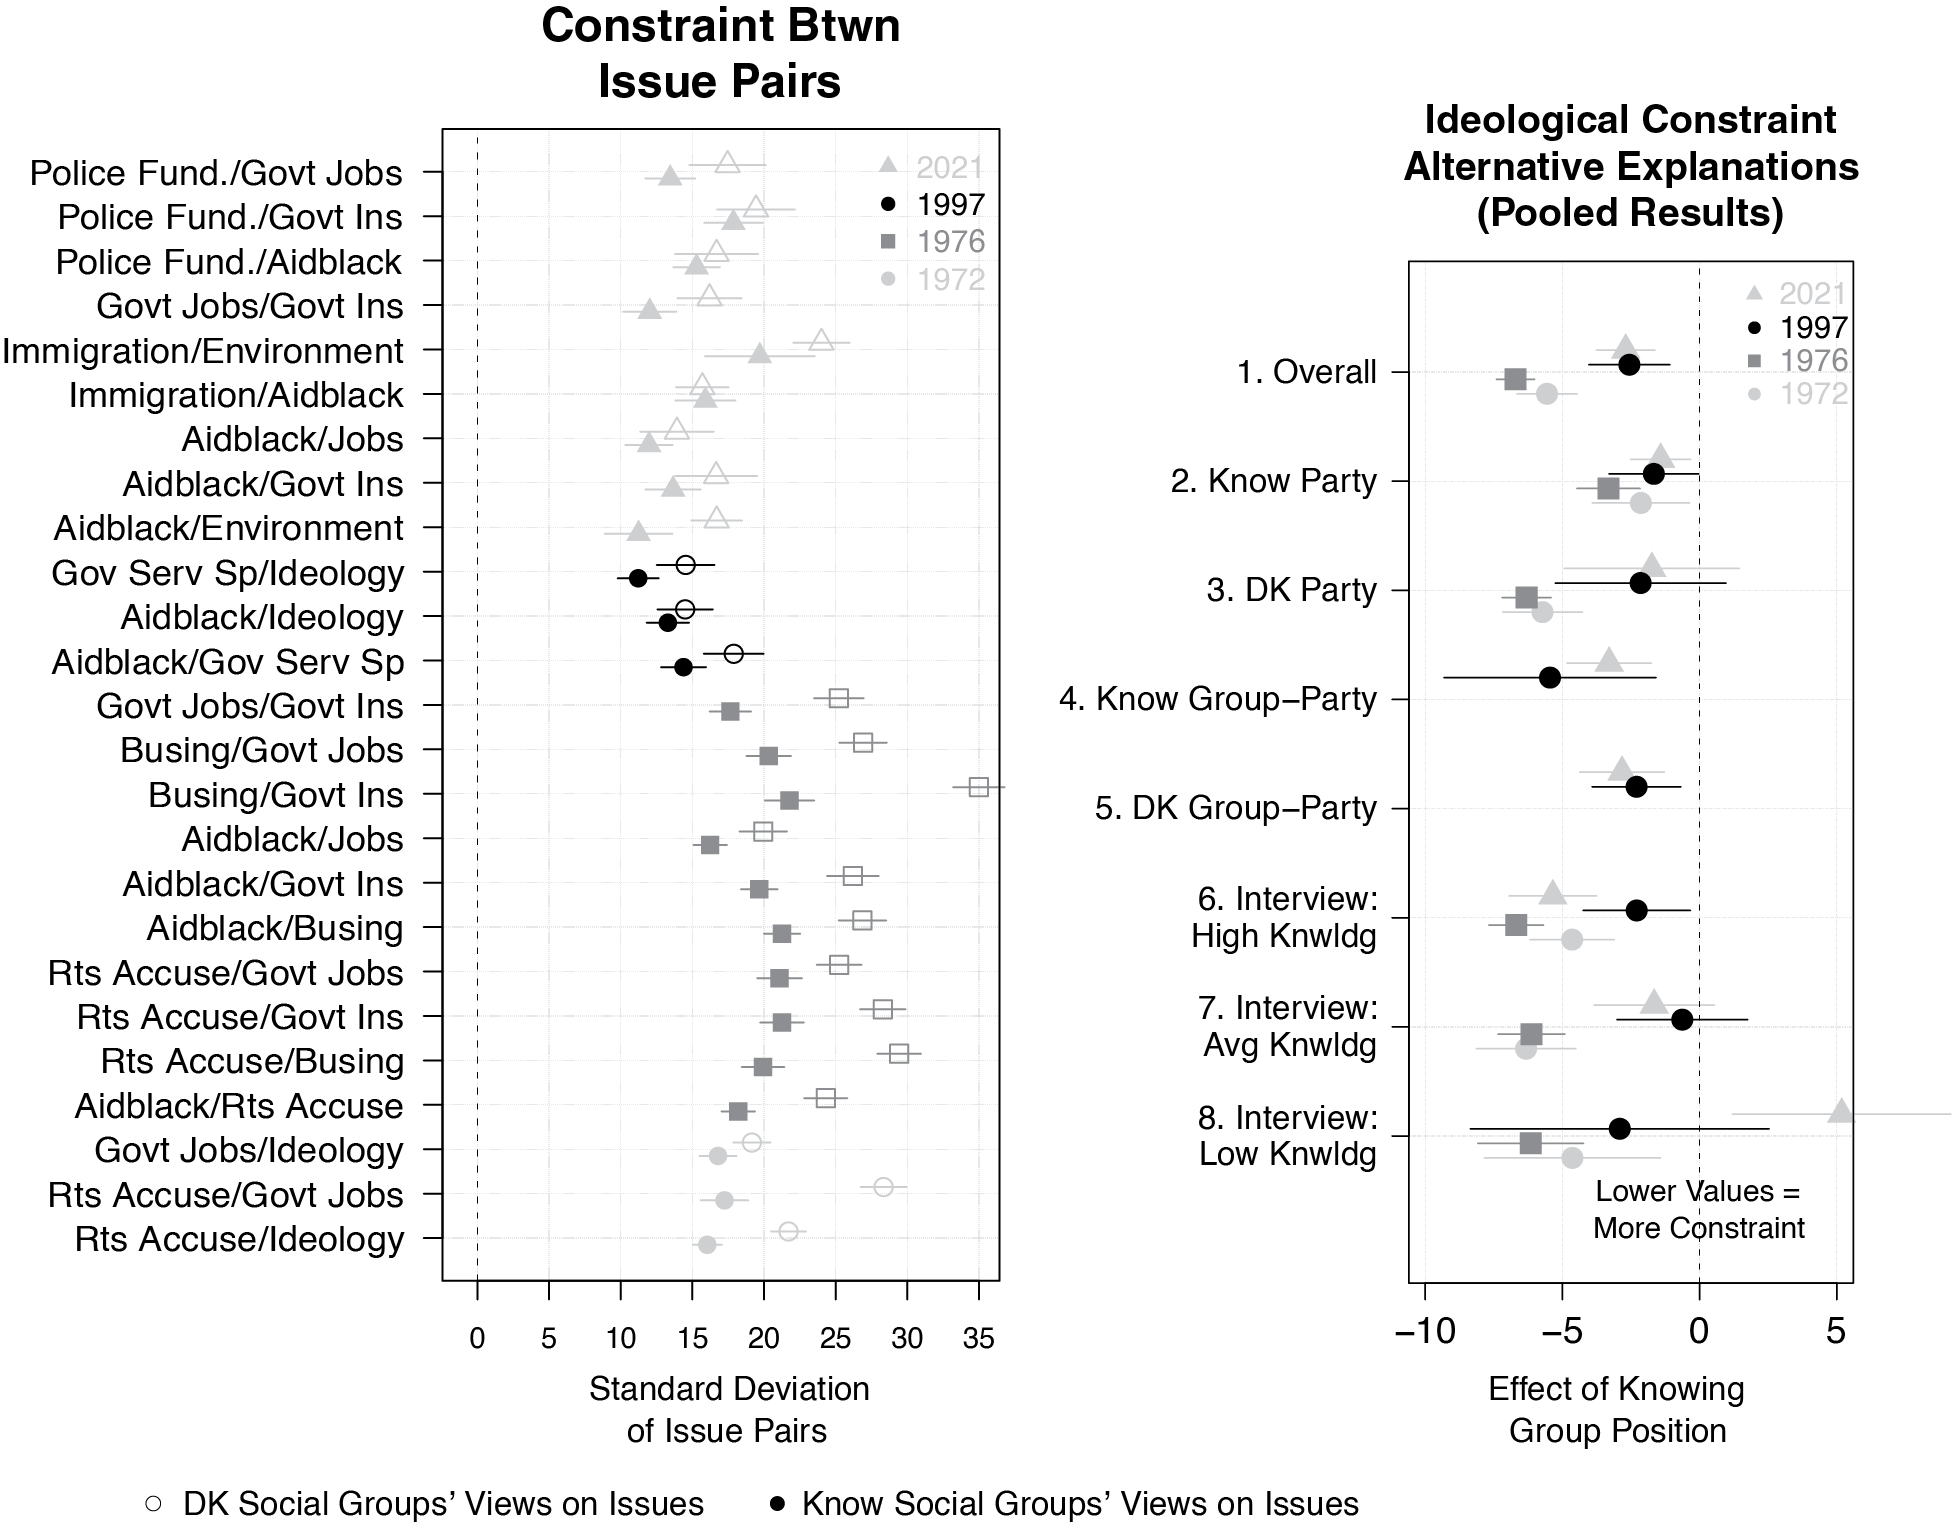
The left panel of Figure 3 shows constraint between each possible pair of issues (listed on the y-axis) for respondents who do and do not know where the social groups stand on both issues. We measure constraint by taking the standard deviation between each set of issue pairs. People with more constraint—that is people who consistently express liberal or conservative positions across issues—have lower standard deviations between issue pairs. Across each issue, people who know where social groups stand show more constraint between issue attitudes than those who do not.
Ideological Constraint by Knowledge of Social Group Policy Views
Note: Left Panel: Each set of points are the standard deviation between the issue pairs listed down the left column. Lower standard deviations represent more constraint between issue pairs. Closed shapes represent the standard deviation between the issue pairs for people who know the racial group positions on those issues. Open shapes are those that do not know both racial group positions. As group knowledge increases, people show more constraint (lower standard deviations) between issue attitudes. Right Panel: Each coefficient represents the average (weighted) difference in constraint between respondents who know and do not know the social groups’ policy views. For example, the top set of points represents the average difference, by year, between the knowers and don’t knowers from the data in the left-hand column. Data are from the 1972 and 1976 cross section, 1997 pilot (cross section), our NORC 2021 study, and wave 1 of our 2021 YouGov study. For the sake of space, we pool the 2021 data and include a survey fixed effect. Data are weighted; see Footnote footnote 8 for description of weighting. For full results as regression tables, see section 9 of the secondary appendix.

As in our analysis of stability, the right-hand panel of Figure 3 pools the issues together into precision-weighted averages of the relationship between group position knowledge and constraint across all issue pairs and explores several alternative explanations for these trends. Negative coefficients mean group knowledge increases constraint (lowers the standard deviation).
This first line of the right-hand panel of Figure 3 suggests that in all years, people who know where the racial groups stand on issues have more constrained attitudes. However, as in the previous section, knowledge of parties’ positions, knowledge of party–group links, or general political knowledge could explain this relationship. Therefore, we again divide respondents into groups based on these dimensions and see whether the relationship between group placement knowledge and constraint persists.
Lines 2 and 3 suggest the effect of group knowledge persists among both respondents who know and do not know the parties’ positions on issues. Indeed, in three of the four data points, group knowledge is a more powerful predictor of constraint among people who lack knowledge of party positions. Lines 4 and 5 suggest the effect of group knowledge is also similar among those who do and do not know which groups stand with which party. Finally, lines 6–8 break down results by general political knowledge.Footnote 22 With the exception of the lowest-knowledge group in 2021, the effect of constraint is similar across all knowledge groups. Respondents across all levels of political knowledge have more constrained attitudes when they know where groups stand.
Building on this final result, we want to emphasize a core point. Other scholarship suggests that more politically knowledgeable people have more constrained attitudes (Ansolabehere, Rodden, and Snyder Reference Ansolabehere, Rodden and Snyder2008; Barber and Pope Reference Barber and Pope2018). Our results align with this finding. However, below-average-knowledge respondents who accurately place social groups have levels of constraint that approach those of above-average-knowledge respondents; below-average-knowledge respondents who cannot place the social groups have little appreciable constraint at all. Knowledge of racial group positions allows low-knowledge respondents to display a level of constraint similar to that of their high-knowledge peersFootnote 23.
Finally, as in the case of stability, we examine the effect of party placement knowledge and racial group placement knowledge over time. We create an average individual measure of constraint by measuring the standard deviation across all of each respondent’s positions on race-related issues in a given year (each question is on a 1–7 scale, recoded to range from 0 to 1). Respondents who have high levels of ideological constraint (e.g., express consistently liberal positions across issues) have a standard deviation closer to 0, whereas those who have less constraint have a higher standard deviation. We again multiply the standard deviations by 100 for ease of interpretation. For example, in 1997, we took the standard deviation of a respondent’s answers across three policy questions: liberal–conservative placement, aid to minorities, and government services and spending. The average standard deviation in 1997 was 0.16.
Using this measure, we then predict respondents’ levels of constraint based on the percentage of times they correctly place the parties and racial groups across policies. We expect that as people are able to correctly place groups on more issues, the standard deviation between their policy attitudes will decrease (that is, constraint between attitudes will grow).
Table 2 shows the effect of group placement knowledge on constraint.Footnote 24 In the 1970s, knowledge of party and group positions both predict constraint. However, when both are pitted against each other, the effect of racial group knowledge is twice as large. By 1997, party knowledge becomes more predictive of constraint (column 6). This pattern then persists in the 2021 sample, with party knowledge dominating group knowledge when pitted against each other. As was the case in our analysis of stability, group knowledge was the strongest predictor of constraint in the 1970s, but the relative importance of party knowledge has grown over time.
Individual Constraint: Comparing Social Group Knowledge and Partisan Cues. Standard errors in parentheses; average standard deviation 1970s × 100 = 26; average standard deviation 1997 × 100 = 16; average standard deviation 2021 × 100 = 19.

Note: The dependent variable is the standard deviation across each respondent’s answers, multiplied by 100 (for the sake of interpreting the coefficients). A value of 0 means that a respondent gives the exact same response across each question asked. Higher values mean the respondent gives more varied answers across policy questions. The 1970s and 2021 data are pooled and include a survey fixed effect in each case. Data are weighted; see Footnote footnote 8 for description of weighting. Standard errors in parentheses; average standard deviation 1970s × 100 = 26; average standard deviation 1997 × 100 = 16; average standard deviation 2021 × 100 = 19. *p < 0.10, **p < 0.05.
Mechanism: Social Group Knowledge and Belief Systems
We have demonstrated that many Americans know the social groups that support important policies and that this generates attitude stability and constraint. An important intermediate step in our account is that knowledge about which social groups support a policy links social group attitudes to policy attitudes: for knowledge about these group–policy linkages to produce stability within, and constraint among issue attitudes, voters must use this knowledge to form attitudes toward those issues.
This section tests whether knowing where social groups stand on an issue leads people to form issue attitudes related to their attitudes toward social groups. We expect, for example, that when someone perceives that Black people support economic redistribution more than white people, their racial attitudes will affect their attitude toward economic redistribution. A similar association ought not exist among people who are not aware that Black people are more supportive of economic redistribution.
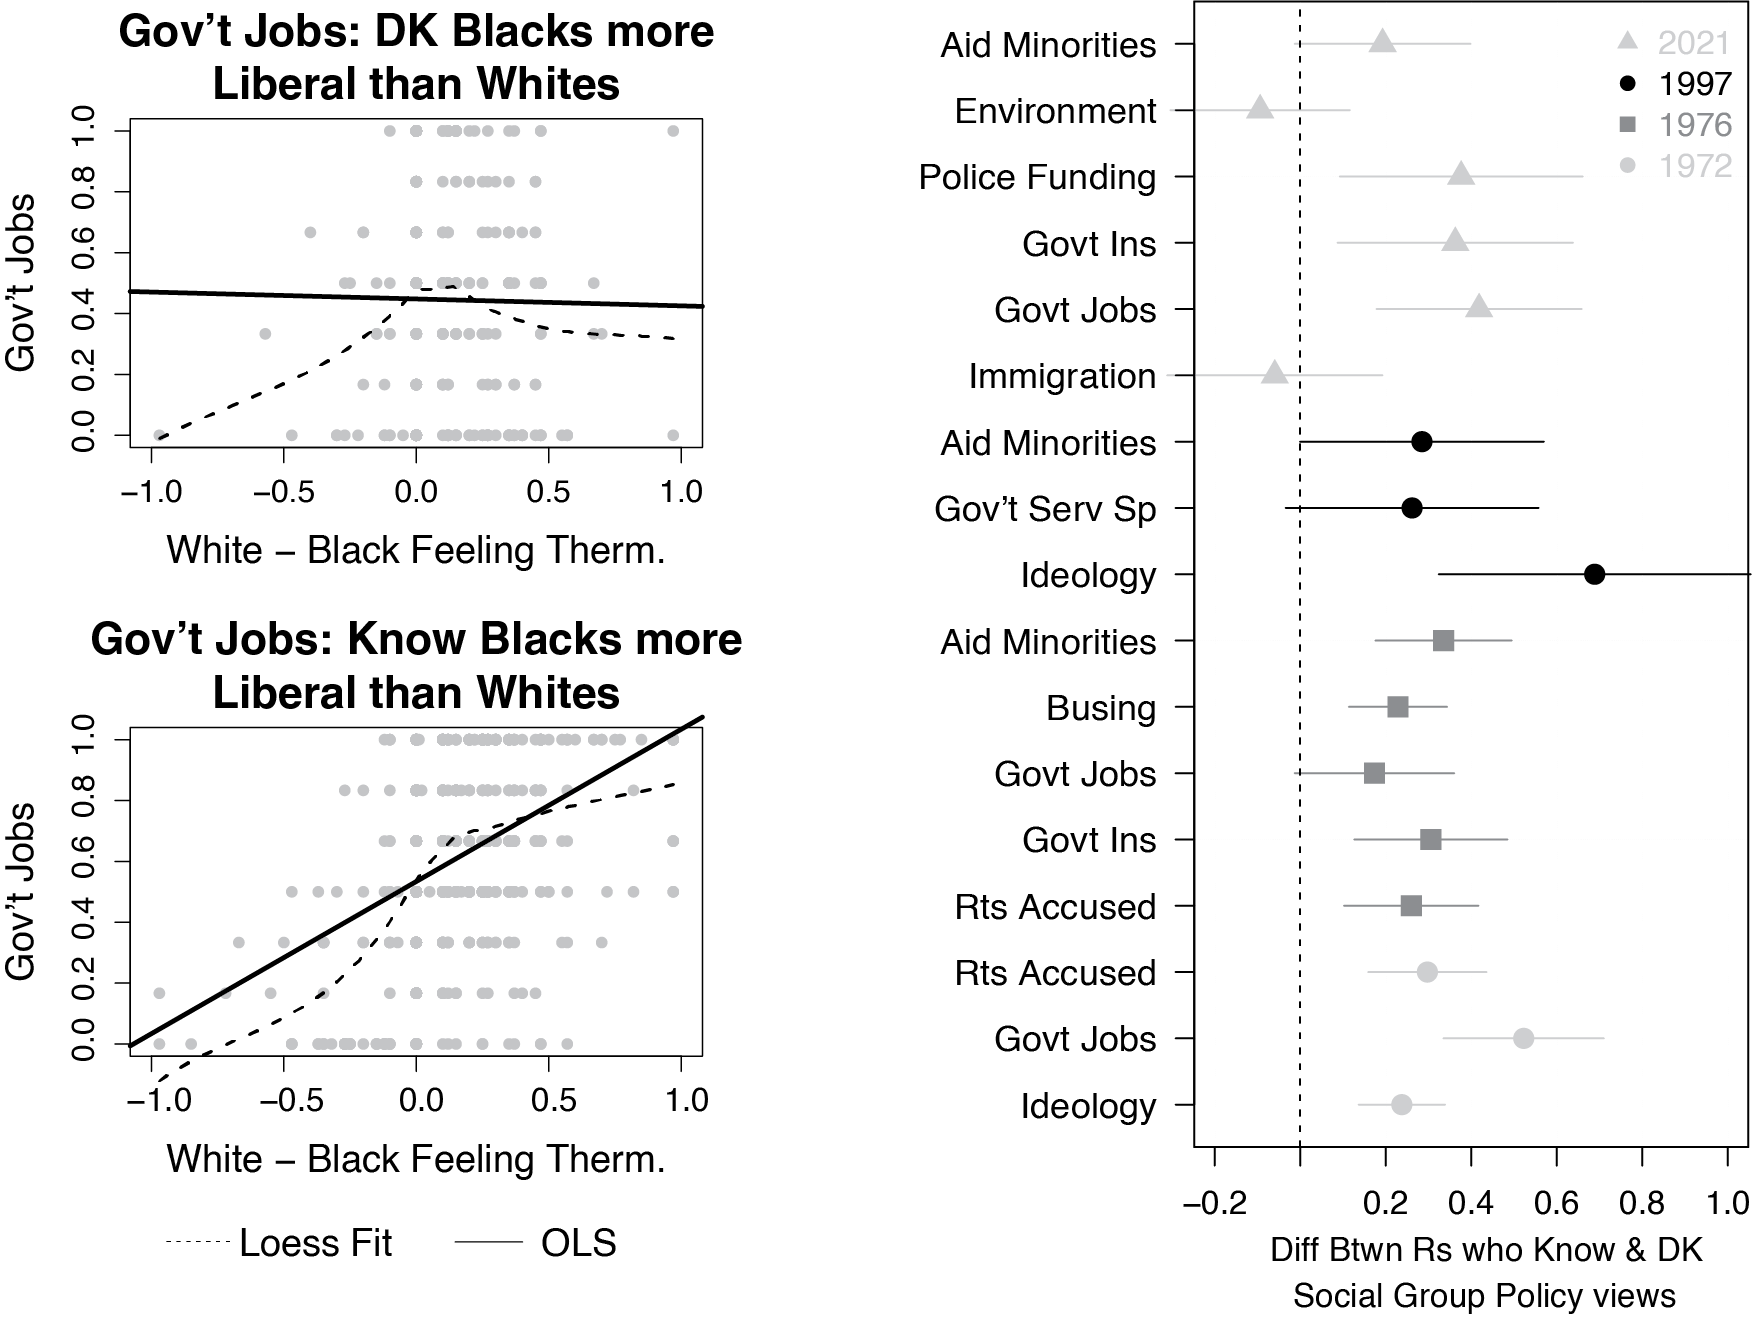
Consistent with expectations, Figure 4 suggests that knowledge of group–policy linkages moderates the relationship between group attitudes and issue attitudes. To illustrate this relationship, the left panel presents the relationship between placement knowledge, group attitudes, and issue attitudes for an especially stark issue: the government guarantee of jobs.
Issue Attitudes by Respondents Who Know and Do Not Know Social Group Policy Views
Note: Left Panel: The x-axis is the difference between ratings of Black and white people on a feeling thermometer. Higher values represent warmer feelings toward whites. The y-axis measures attitudes toward government-guaranteed jobs. Higher values equal more conservative attitudes. A positive slope means that people who have more positive feelings toward whites compared with Blacks corresponds with holding more conservative economic attitudes. (Data from 1972 ANES). Right Panel: The right panel presents difference in slope between those that know and do not know social group policy views. Positive coefficients mean the relationship between group attitudes and issue attitudes is stronger for issues on which a respondent can accurately place the social groups than for issues on which they cannot. The second-to-bottom point (on “Govt Jobs”), represents the difference in the black linear slope lines between the top and bottom left-hand panel. Data are from the 1972 and 1976 cross section, 1997 pilot (cross section), our NORC 2021 study, and wave 1 of our 2021 YouGov study. For full results as regression tables, see section 9 of the secondary appendix.

The top-left panel shows that among people who do not know that Blacks are more supportive of economic redistribution than whites, racial conservatives and racial liberals have effectively the same attitudes on government-guaranteed jobs. The flat black trend-line going from left to right represents this pattern. However, the bottom-left panel shows that racial conservatives and liberals who do perceive differences between racial groups are much more polarized on this question: people who express warmer feelings toward whites than Blacks are more conservative on a government guarantee of jobs but only if they perceive that policy to be supported by more Blacks than whites.
We are interested in the difference in the slope between the bottom and top panel. When the difference is positive and significant, the relationship between group attitudes and issue attitudes is stronger among those who can accurately place the groups than among those who cannot. The right-hand panel of Figure 4 shows the difference in slopes for all issues on each survey. In nearly every case, the coefficients in the right-hand panel of Figure 4 are positive and significant: group attitudes and policy attitudes are more strongly linked among people who know where the relevant groups stand on the policy.Footnote 25
The results presented in this section accord with the common finding that attitudes toward policies reflect attitudes toward the groups associated with them. However, they suggest that this well-established pattern primarily—and for some issues, only—exists among people who know where the social groups stand on the issue in question.Footnote 26
What Explains Change over Time? Social Groups, Affective Polarization, and Partisan Sorting
The previous sections show that since the 1970s, the importance of party placement knowledge has grown and the influence of nonparty social group knowledge has declined in structuring constraint and stability. Does this mean nonparty group attitudes matter less to belief systems now than they did in the 1970s? Perhaps not: a large literature points to the centrality of groups to party identification and the recent increase in party’s influence on political attitudes (e.g., Achen and Bartels Reference Achen and Bartels2017; Iyengar et al. Reference Iyengar, Lelkes, Levendusky, Malhotra and Westwood2019; Mason Reference Mason2018). This section explores the possibility that the overlap of group attitudes with partisanship drives the increasing importance of party knowledge.
One explanation for why party position knowledge has become more influential is the growth of affective polarization: over the past 40 years, people have come to like their own party more and (especially) the other party less (Iyengar, Sood, and Lelkes Reference Iyengar, Sood and Lelkes2012). Indeed, Iyengar, Sood, and Lelkes (Reference Iyengar, Sood and Lelkes2012) find that partisan affective polarization surpasses polarization on other salient social cleavages, including race.
Although scholars present multiple explanations for affective polarization’s growth, a prominent literature argues it is the result of increasing alignment between party and other social identities like race or religion (Mason Reference Mason2018; Mason and Wronski Reference Mason and Wronski2018; Wronski, Kane, and Mason Reference Wronski, Kane and Mason2021).Footnote 27 As the parties have become socially sorted such that other group identities align with party identification, identification with one’s copartisans has grown. Likewise, as social out-groups increasingly align with the opposing party, this fuels antipathy toward the out-party (Wronski, Kane, and Mason Reference Wronski, Kane and Mason2021). Social sorting has been particularly concentrated among whites sorting into the Republican party: between the mid-1990s and 2016, the proportion of whites in the Republican versus Democratic party has doubled (Mason and Wronski Reference Mason and Wronski2018, 260).
If party identity becomes more important as party identification aligns with group affect, knowledge of party positions should be most important to belief systems among people who like groups in their party’s coalition and dislike those in the other party’s. However, people whose party membership is misaligned with their affect toward groups in the party’s coalition (e.g., a racially conservative Southern Democrat in the 1970s) might be less attached to their party because they are pulled in different directions by the positions of the groups and parties they prefer. These nonsorted people should be less likely to structure their belief systems around party positions. If people with party-sorted group attitudes are more likely to organize their beliefs using party cues than people with nonsorted attitudes are, party position knowledge could be growing more important because the sorted people are now a larger portion of the electorate.
To test this possibility, we calculate the relative importance of racial group and party position knowledge among two groups: people whose affect toward racial groups aligns with their partisanship and those whose affect is misaligned. Because Black people are considered a part of the Democratic Party’s coalition, we code a Democrat who feels more warmly toward Black people than a reference racial group (here, white people) as having group attitudes that are “sorted” with their party. (As before, we measure affect using racial feeling thermometers.) Analogously, a Republican who feels more warmly toward white people than Black people is also “sorted.” “Nonsorted” respondents are those with the opposite pattern. Respondents who feel equally warmly toward both groups are excluded, as are pure independents (as they cannot be classified as sorted or nonsorted).
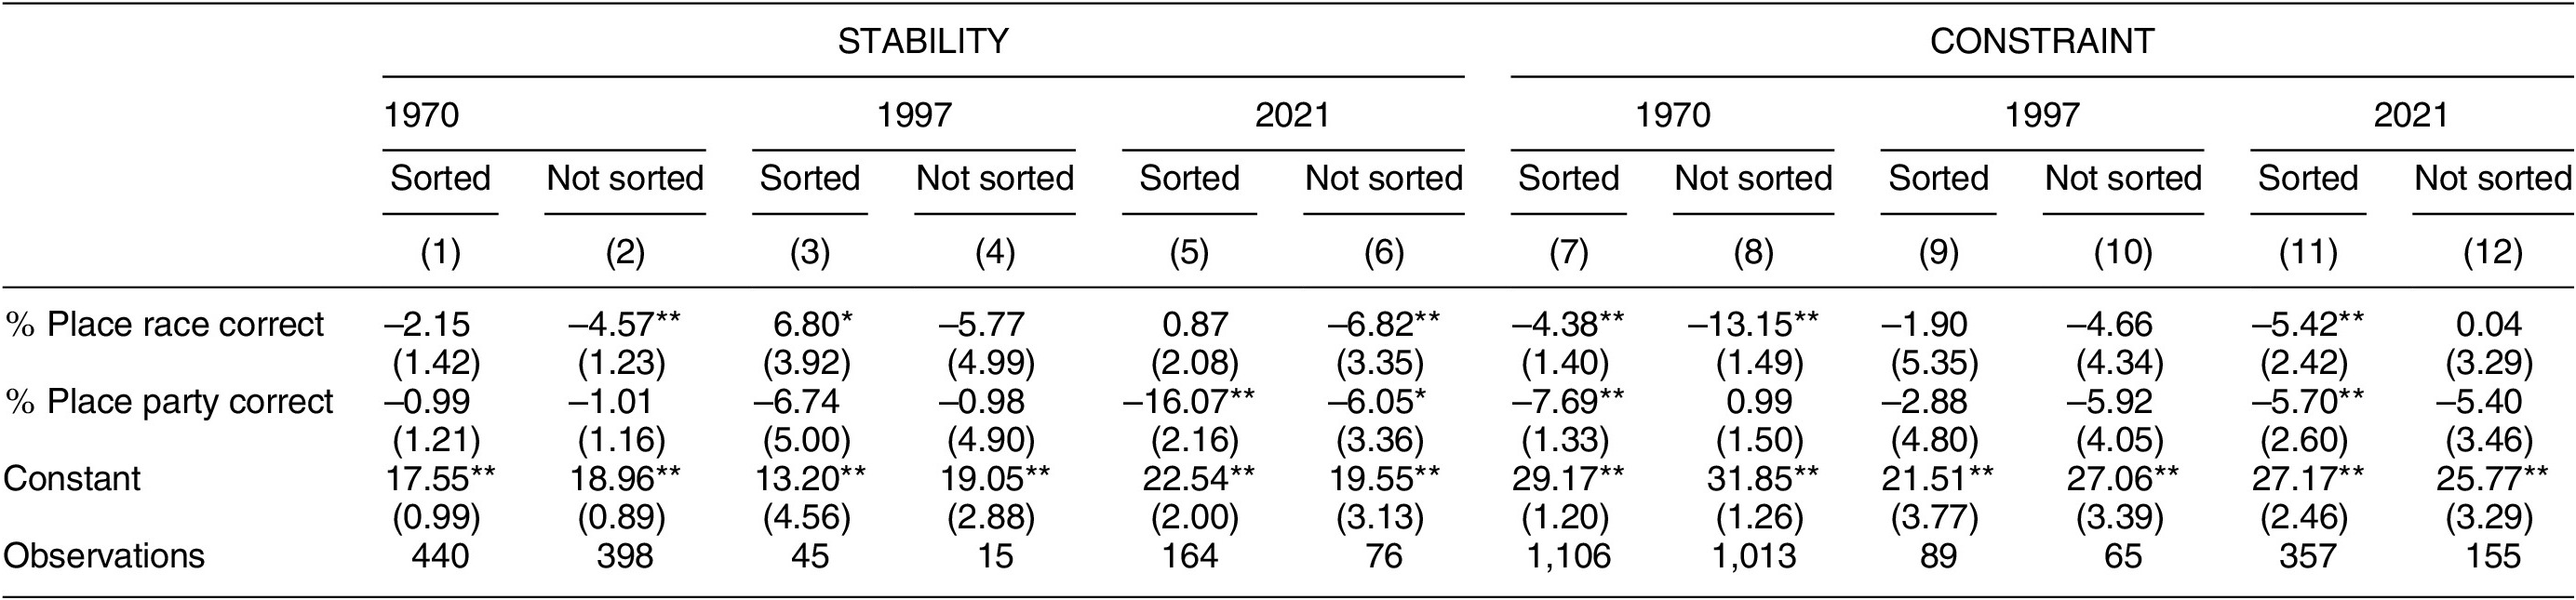
We then test the relationship between group and party placement knowledge and stability and constraint, now separating respondents into sorted and nonsorted groups. Table 3 presents regressions of attitude stability (columns 1–6) and attitude constraint (columns 7–12) on respondents’ knowledge of racial groups’ and parties’ positions. Constraint and stability are measured, as in previous sections, using the standard deviation of attitudes across issues (constraint) and over time (stability). Negative coefficients suggest that knowledge decreases a respondent’s standard deviation—that is, negative coefficients indicate increased stability and constraint.
Average Effect of Knowledge by Alignment of Racial Affect & Partisanship

Note: Negative values represent more stability and constraint. Sorted respondents are those who feel more warmly toward the party-aligned racial group (e.g., Republican who feels more warmly toward whites than Blacks). Not sorted respondents are those who feel more warmly to out-party racial group (e.g., Democrat who feels more warmly toward whites than Blacks). Dependent variable is the standard deviation to a battery of policy questions asked in the previous sections; “% Place race” equals the percentage of times respondents correctly place whites to the right of Blacks on each policy; “% Place party” equals the percentage of times respondents correctly place Republicans to the right of Democrats. Standard errors in parentheses; *p < .01; **p < .05.
The results are broadly consistent with our predictions: for both constraint and stability, the effect of party knowledge is larger among subjects whose racial affect aligns with their party membership. However, in most cases, the effect of party is negligible when affect toward the racial group and party are unaligned. That is, for subjects whose racial affect and partisan affiliation are out of line, the effect of racial groups is often stronger. For subjects whose racial affect and partisan affiliation are aligned, the effect of party is strongerFootnote 28.
These findings suggest the increasing importance of party position knowledge to belief systems is due, at least in part, to the growing alignment between partisanship and group attitudes. Because party position knowledge seems to be more important to sorted respondents than to nonsorted ones, party position knowledge plays a larger role in public opinion as the proportion of people with party-sorted group attitudes increases.
The patterns shown here align with the broader view that the sorting of partisans along group-based lines is responsible for the growing importance of partisanship to Americans’ political attitudes. In this view, the strength of partisanship is not a sign that group memberships, attitudes, and knowledge matter less but that they matter differently: group attitudes structure public opinion by strengthening the effects of partisan attachment.Footnote 29
Although these data are suggestive, social sorting is not the only possible cause of party’s growing importance to belief systems. For example, scholarship on affective polarization shows that although people’s ratings of the parties have diverged over time, ratings of racial and other social groups have come closer together (Iyengar, Sood, and Lelkes Reference Iyengar, Sood and Lelkes2012, 12). This narrowing of polarization in affect toward other social groups, but increase in polarization in partisan affect, could bolster the role of party. Surprisingly, this explanation has not been explored. More generally, though scholars of affective polarization have begun to investigate its relationship with issue attitudes (Dias and Lelkes Reference Dias and Lelkes2021), the relationship between affective polarization and belief systems remains understudied and offers one promising avenue for future research.
Discussion and Conclusion
We have argued that knowledge about which social groups support or oppose policies is central to forming durable and constrained political attitudes in the American public. Many people are knowledgeable about the types of social groups that support or oppose policies; this knowledge has historically exceeded knowledge of where parties or ideological groups stand on those same issues. This knowledge of links between policies and racial groups creates attitudes that are more stable and constrained. People who know that different policies affect the same racial groups are more likely to organize their attitudes into liberal and conservative packages and hold more durable attitudes over time. However, these “ideological” positions are organized based on group attitudes rather than liberal and conservative ideological beliefs.
Our results also suggest that the role of party in generating attitude stability and constraint has increased since the 1970s, whereas the relative importance of social groups has declined. Our analysis suggests that party cues are especially strong for respondents that are socially sorted—that is, people who feel warmly to racial groups aligned with their party—and weakest for those whose racial attitudes are out of line with party. As party and group membership have become increasingly sorted in recent decades (e.g., Mason Reference Mason2018) and attachment to party increased, party position knowledge has become more important. Groups still matter to belief systems, but today, they largely seem to work through parties.
These findings address core questions of democratic accountability. Scholars have long been concerned that Americans do not have the political knowledge they need to make informed choices, as knowledge of parties’ positions on issues was historically low. If political conflict is fundamentally about competition between group interests, however, knowledge about groups’ interests is critical to understanding politics. Our results suggest many people possess this knowledge: most Americans have a good idea of where salient social groups stand on issues. This suggests people possess the knowledge they need to understand politics, a rosier picture for democratic accountability than much of the literature on political knowledge would suggest.
The ubiquity and influence of social group placement knowledge have practical implications. Party cues are not, as some have suggested, the only source of stability in Americans’ issue attitudes (Freeder, Lenz, and Turney Reference Freeder, Lenz and Turney2019). If interest groups can tie a policy to a salient social group, they can foster attitudes that are stable and tied to broader systems of attitudes toward policies related to the group. Though racial realignment has brought the race-related policies and attitudes we study here fully into line with party, entrepreneurs in other issue areas may be able to forge stable and constrained attitudes that crosscut party lines. Group-based issue coalitions of this kind could undermine the sorting that undergirds affective polarization.
Though our theory applies to any group seen to demand or benefit from a policy, data availability largely limits our evidence to analysis of race-related issues.Footnote 30 These are particularly important cases given the centrality of racial groups to the modern American party system (Schickler Reference Schickler2016). However, precisely because race is so central to American politics, it is difficult to generalize our result to the importance of other groups’ positions to belief systems. Extending these analyses more fully to other social groups and issue areas is an important area for future work. Additionally, the questions available on group placement did not cover issue areas on which parties’ positions have remained unclear in current discourse. Future work on issues not yet subsumed by party may better elucidate the role of social group knowledge in nonpartisan issues in a hyperpartisan time.
Supplementary Materials
To view supplementary material for this article, please visit http://doi.org/10.1017/S0003055422000326.
DATA AVAILABILITY STATEMENT
Research documentation and data that support the findings of this study are openly available at the American Political Science Review Dataverse: https://doi.org/10.7910/DVN/IXTLRP.
ACKNOWLEDGMENTS
We thank David Broockman, Jack Citrin, Gabriel Lenz, Eric Schickler, and Laura Stoker for extensive comments on this manuscript and seminar participants at Princeton University for their valuable feedback. We also thank the Citrin Center for Public Opinion Research, Time-sharing Experiments for the Social Sciences (TESS), and the Center for the Study of American Democracy at UC Berkeley, as well as Princeton University’s Center for the Study of Democratic Politics, for financial support. Authors are listed in alphabetical order. Please address correspondence to obrian@uoregon.edu. Mail correspondence can be addressed to the Department of Political Science, 1284 University of Oregon, Eugene, OR.
FUNDING STATEMENT
This research was funded by Time-sharing Experiments for the Social Sciences (TESS), the Jack Citrin Center for Public Opinion Research, the Center for the Study of American Democracy at the University of California Berkeley, and Princeton University’s Center for the Study of Democratic Politics.
CONFLICT OF INTEREST
The authors declare no ethical issues or conflicts of interest in this research.
ETHICAL STANDARDS
The authors declare that the human subjects research in this article was approved by the University of California, Berkeley’s Institutional Review Board (Protocol # 2020-02-12929) and Princeton University’s IRB (# 13211). The authors affirm that this article adheres to the APSA’s Principles and Guidance on Human Subject Research.




Comments
No Comments have been published for this article.