Introduction
The computed tomography (CT) in digital imaging and communications in medicine (DICOM) images is based upon a matrix of pixels representing the average linear attenuation coefficient (µ). This attenuation coefficient represents the X-ray attenuation property of a tissue as it is transmitted through patients. In CT, the matrix of a reconstructed linear attenuation coefficient (µ material) is transformed into CT numbers and measured in Hounsfield units (HU), where the CT numbers are expressed relative to the linear attenuation coefficient of water at standard temperature (µ water), as shown in Equation (1).
 $${\rm CT}\,{\rm number}\,{\rm of}\,{\rm tissue}{\equals}{{\mu _{\rm material}} {\times}\,\mu _{\rm water} \over {\mu _{{\rm water}}}} \,{\times}\,1000}}} $$
Each pixel in the matrix has a specific value of CT number and depends on X-ray beam energy, density and an atomic number of a tissue.Reference Yagi, Ueguchi and Koizumi 1 , Reference Van Elmpt, Landry, Das and Verhaegen 2
The human body consists of various tissues with specific radiological properties, such as electron density (ED) or physical density (PD), that differentiate them from each other. This tissue inhomogeneity can be characterised by converting the CT number in each voxel into the ED, and these results are applied to formulate the radiotherapy treatment planning system (TPS). Radiotherapy centres apply commercially available phantoms (CIRS, Virginia, USA/GAMMEX, Sun Nuclear Corporation, Middleton, USA) to perform measurements and conduct CT–ED conversion curves for treatment planning, but the phantom is currently limited to the soft tissue and bone structure present in the human body. The TPS algorithm calculation for dosimetry analysis depends solely on the CT–ED conversion curve. High-density materials used for medical implants may cause error in the CT–ED conversion curve because of the limited range of CT–ED.Reference Coolens and Childs 3 – Reference Das, Cheng, Cao and Johnstone 5 Inaccuracies in the HU values result in an error in ED or stopping power estimate, which may essentially influence the dose calculation and optimisation processes.Reference Giantsoudi, De Man and Verburg 6 Thus, the presence of medical implants results in inaccurate dosimetry calculations when assessing tumour versus normal tissue.Reference Xin-Ye, Liugang, Mingming and Tao 7 Furthermore, the AAPM Report No. 85 emphasised the need to develop and implement tissue inhomogeneity corrections.Reference Papanikolaou, Battista and Boyer 8
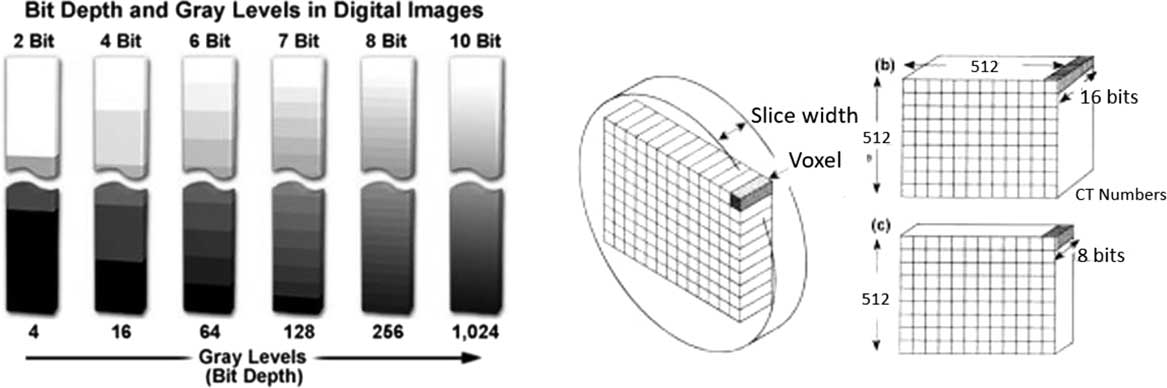
Limitation of CT–ED range in the TPS is mainly controlled by bit depth of a CT scanner. Bit depth is an in-built CT scanner parameter that indicates the shades of grey used to define each pixel in a matrix.Reference Indrajit and Verma 9 Figure 1 shows the effect of bit depth variation on the CT image grey level; the number of grey level increases by the power of two (2 n , where n is an integer). Most CT scanners are built with a 12-bit depth and advanced scanners with a 16-bit depth. The 12-bit system has a slope of 1 HU and intercepts of –1,024 HU for an unsigned stored image, which yields 4,096 values (212) ranging from –1,024 to 3,071 HU.Reference Glide-Hurst, Chen, Zhong and Chetty 4 CT scanners with 12-bit depth DICOM images truncated at 3,071 HU limit their ability to analyse high-density materials.Reference Coolens and Childs 3 – Reference Das, Cheng, Cao and Johnstone 5 , Reference Mullins, Grams, Herman, Brinkmann and Antolak 10 , Reference Jechel 11 High-density materials have high linear attenuation coefficients that lie outside of the 12-bit CT number. Current advancements in CT scanners allow the range of the 12-bit raw data to be extended using a reconstruction algorithm to apply information on high-density materials. This amends the initial slope by expanding the HU range ten-fold (e.g., ranging from –10,240 to 30,710)Reference Mullins, Grams, Herman, Brinkmann and Antolak 10 . In contrast, scanners with full 16-bit DICOM images (16-bit signed integer) yield 65,535 values (216) ranging from –32,768 to 32,767 HU, which is a much larger scale compared to that provided by the reconstruction algorithm for the 12-bit system.Reference Hebb and Poliakov 12 , Reference Escott and Rubinstein 13 A larger bit depth in DICOM image implies a greater number of greyscale as well as a larger file size.Reference Allisy-Roberts, Williams, Jerry, Farr and Reginald 14 As a standard, 12-bit depth is usually used commercially by vendors to reduce the file storage size in the system and a function to extend the CT scale is provided when it is required.
Variation of bit depth and greyscale level. The greyscale increases by the power of two (2 n , where n is an integer). Each voxel represents the CT number, which reflects to the greyscale available in the CT scanner system.

The main objective of this study is to examine the effect of bit depth on CT number for high-density materials. Analysis of the CT number for high-density materials using 16-bit scanners will extend the CT scale that currently exists for 12-bit scanners and beneficial in determining CT–ED conversion curve in the radiotherapy TPS. Implementation of this extended CT scale will compensate for tissue inhomogeneity during CT–ED conversion curve in treatment planning.
Materials and Methods
Phantom description
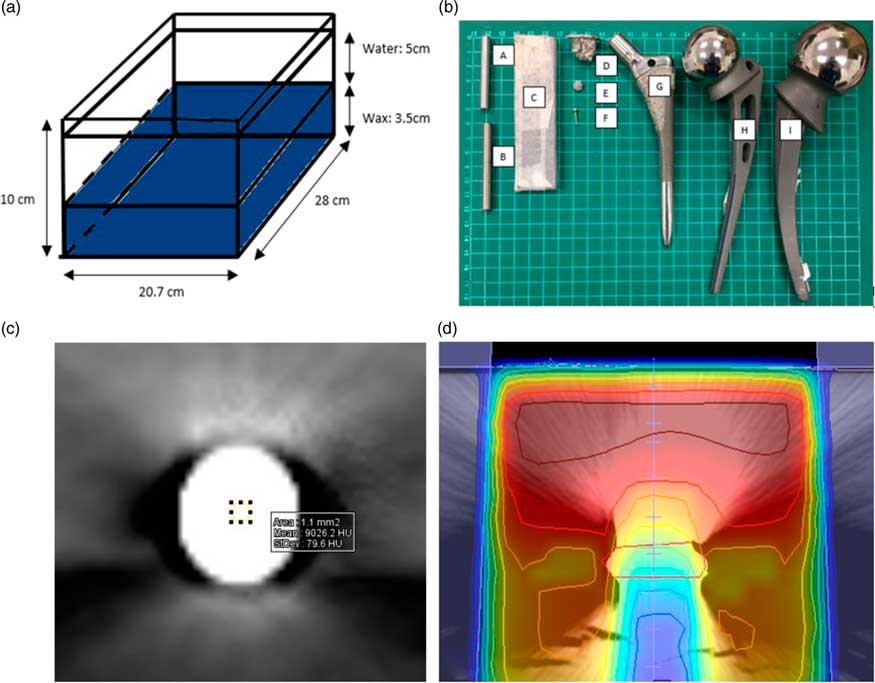
The phantoms that were used in this study are in-house built phantoms used to scan high-density metals (4·14–19·3 g cm−3) (Figure 2a). The fabricated phantom was constructed using polypropylene (0·946 g cm−3 near water density) with a 10×20·7×28 cm3 housing; it contained a wax (3·5 cm depth) base covered by water (5 cm depth) to create tissue equivalent environment. Table 1 summarises samples used in this study (Figure 2b). Metals were chosen based on availability in the clinical setting. The density of metals was selected based on data provided by the National Institute of Standards and Technology (NIST, USA) and this was then compared with a measurement by using the classic Archimedes principle using the water displacement technique, as it allowed easy calculation of the density of irregular-shaped metals with uncertainty of ±2%.Reference Hernandez 15
(a) In-house built phantom base moulded with wax and filled with distilled water. (b) Metal samples selected from clinical practice: (A) standard steel, (B) titanium, (C) lead, (D) amalgam, (E) amalgam, (F) gold (Au), (G) hip prosthesis fibre taper, (H) hip prosthesis Austin Moore and (I) hip prosthesis Thompson. (c) Sample of titanium sample in DICOM image contoured on Weasis medical viewer software for CT number at the centre of material. (d) Dosimetry analysis at the centre of metal DICOM image of lead material.

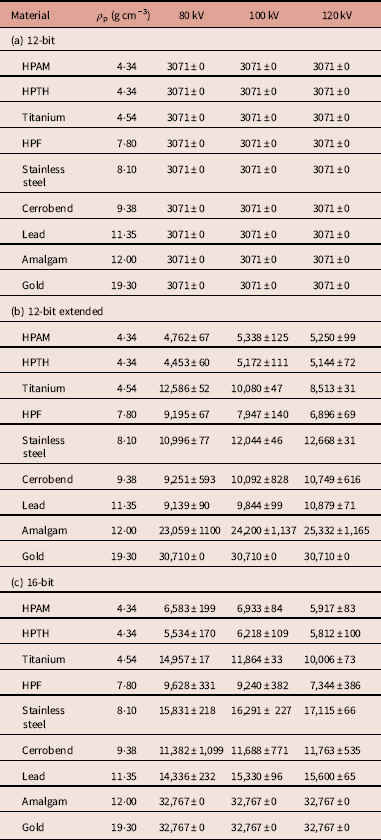
CT number (HU) of samples from the 12-bit depth (a), 12-bit extended (b) and 16-bit depth system (c). The CT number in HU unit and SD given for 10 consecutive slice images

Abbreviations: HPAM, hip prosthesis Austin Moore; HPTH, hip prosthesis Thompson; HPF, hip prosthesis fibre metal taper.
CT acquisition
Trans-axial CT slices of the two phantoms were acquired using Somatom Definition AS (Siemens Healthcare, Wittelsbacherplatz München, Germany) and Aquilion LB (Toshiba Medical System Corporation, Tochigi, Japan) scanners configured for radiotherapy simulation. The Siemens Somatom scanner is equipped with the extended CT scale reconstruction algorithm to expand the CT number range (−10,240 to +30,710), whereas the Toshiba Aquilion scanner is manufactured with full 16-bit depth (−32,767 to +32,767). Tube voltages of 80, 100 and 120 kVp were applied with 200 mAs to analyse the CT number of sample materials in both scanners. CT images in a 512×512 matrix were reconstructed at a slice thickness of 1 mm with convolution kernel (Siemens: B31S medium smooth; Toshiba: F30) and iterative reconstruction (SAFIRE and AIRD3) disabled on both scanners, as this function does not affect the linearity and accuracy of CT number.Reference Shin, Chung and Lee 16
CT number analysis
DICOM images obtained from the scanners were analysed using Weasis medical viewer v1·2·7 (an in-built software provided by OsiriX Medical Viewer) in Siemens workstation. So, 10 trans-axial slices of CT images were averaged in a 1·1 mm2 circular region of interest (ROI) (Figure 2c). Statistical analysis was performed using IBM SPSS Statistics 22 to evaluate the influence of bit depth on CT number.
New CT–ED dosimetry
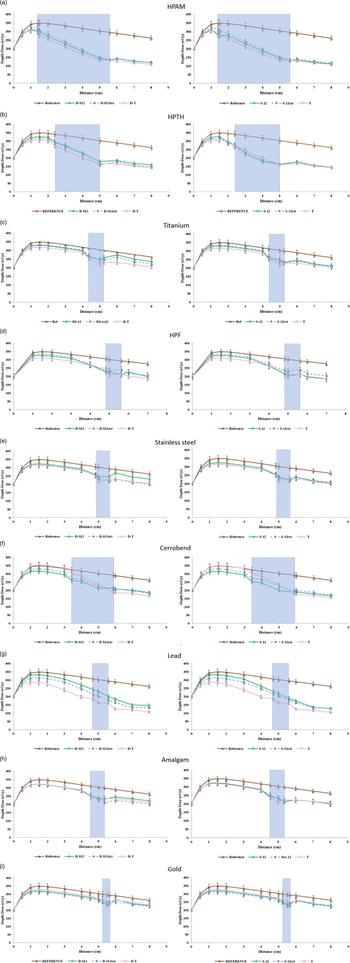
MONACO (Elekta, Stockholm, Sweden) TPS has its default CT number versus ED conversion table, which disregard high-density materials. Thus, a new CT–ED conversion curve was plotted in TPS for 12-bit, 12-bit extended and 16-bit depth. The direct anterior beam was planned at the centre of the metal profile, and depth–dose was plotted as shown in Figure 2d using the collapsed cone (CC) algorithm.
Results
CT number analysis
Table 1 summarises the numerical results for the high-Z materials with density ranging from 4·3 to 19·3 g cm−3 generated by the 12-bit, 12-bit extended (Siemens) and 16-bit (Toshiba) scanners at 80, 100 and 120 kVp. Streak artefacts that occurred in high-density materials were not considered because of the ROI measurement within the materials, as shown in Figure 2c. The SDs in Table 1 represent DICOM image noise and indicate that SD was small at high energy (120 kVp), and in contrast greater at low energy (80 kVp) in the 16-bit scanner. Meanwhile, 12-bit extended had image noise highest in 100 kVp.
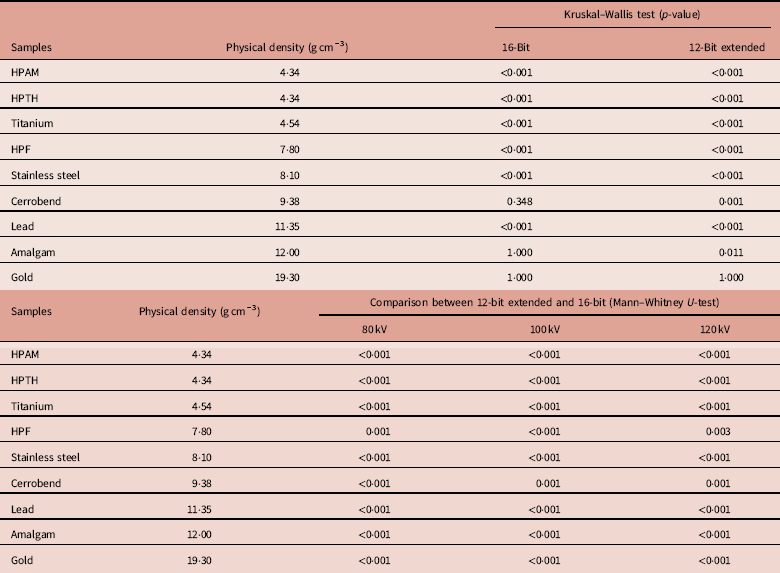
Data for a 12-bit scanner for high-density materials were observed truncated at 3,071 HU, hence statistical tests were performed on 12-bit extended and 16-bit phantom setup. For the 12-bit extended experiment, materials with density >4·3 g cm−3 showed significant differences in CT values (p<0·05) among the three tube voltages tested, except for gold, where the value was truncated at 30,710 (Table 2 (a)). In the 16-bit experiment, CT number of high-density materials vary significantly (p<0·05) among the three tube voltages tested, except for cerrobend, amalgam and gold (Table 2 (a)). In fact, CT number of the amalgam and gold truncated at the same value (32,767 HU) for 80, 100 and 120 kVp. Cerrobend value is an exception in the 16-bit scanner with no difference observed when different tube voltage is applied (Table 2 (a)). Table 2 (b) compared the 12-bit extended with 16-bit in 80, 100 and 120 kVp and statistical results show that there is a significant difference (p<0·05) with the greatest difference up to 44% in lead material in 100 and 120 kVp and 35% in 120 kVp (Table 2 (b)).
Statistical result of p-value by (a) comparing CT number between different tube voltages in 16-bit and 12-bit extended using Kruskal–Wallis test; (b) comparing CT number between 16-bit and 12-bit extended at 80, 100 and 120 kVp using Mann–Whitney U-test

Abbreviations: HPAM, hip prosthesis Austin Moore; HPTH, hip prosthesis Thompson; HPF, hip prosthesis fibre metal taper.
Effects of tube voltage
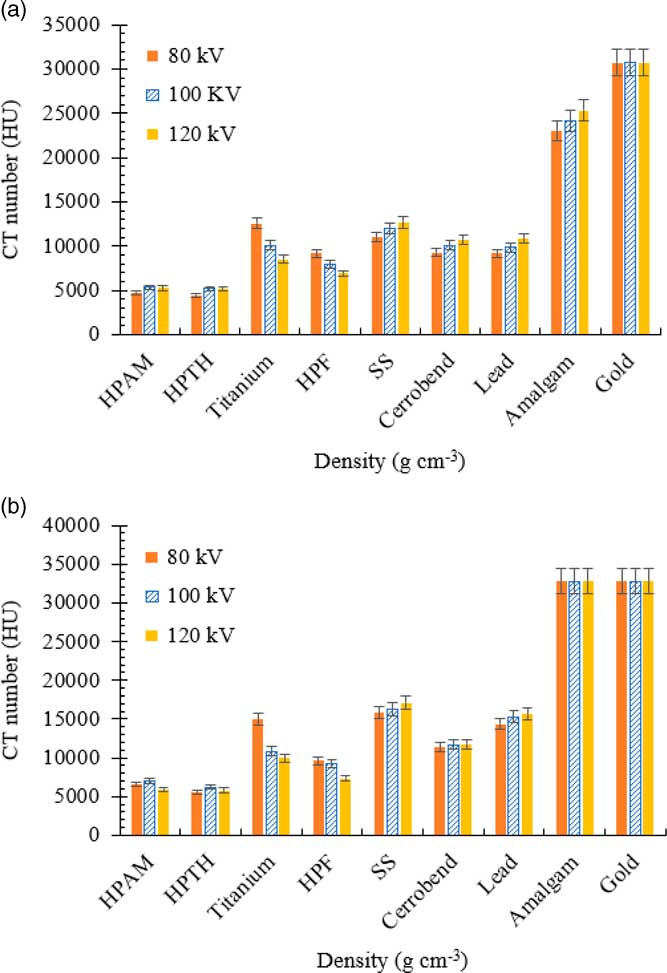
The effects of tube voltage on the high-density materials were tested, as shown in Figure 3. The result shows that low energy yielded high CT number and high energy had the lowest CT number in titanium, hip prosthesis fibre (HPF) taper and stainless steel. Cerrobend, lead and amalgam showed high CT number in high energy as shown in Figure 3a in 12-bit extended scanner. Hip prosthesis Austin Moore (HPAM) and hip prosthesis Thompson (HPTH) standalone with minimal variation in CT number when different tube voltages applied. Gold CT number is truncated in 12-bit extended and 16-bit scanner, which summarises that different energies have no effect on the gold material.
CT number variation for high-density material in 80, 100 and 120 kV; (a) 12-bit extended and (b) 16-bit.

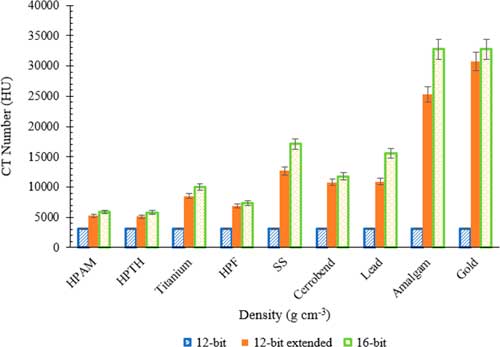
Tube voltage of 120 kVp resulted in the lowest variation among both scanners (with differences <7435 HU for amalgam); it was used to analyse the high-density materials as shown in Figure 4. High-density materials in this study show fluctuation between 3 different bit depths. A 12-bit extended scanner shows that only gold reached the saturation level at 30,710. The 16-bit scanner indicates a higher CT number for high-density materials when compared to the 12-bit extended experiment and 12-bit CT number truncated at 3,071 HU. In a 16-bit system, amalgam and gold reached the maximum CT number (32,767 HU) and shows the same CT number for 80, 100 and 120 kVp.
CT number measured by 120 kV for high-density material (4·34–19·3 g cm−3). All error bar indicates calculated SD of the mean over 10 axial CT slices.

Dosimetry analysis
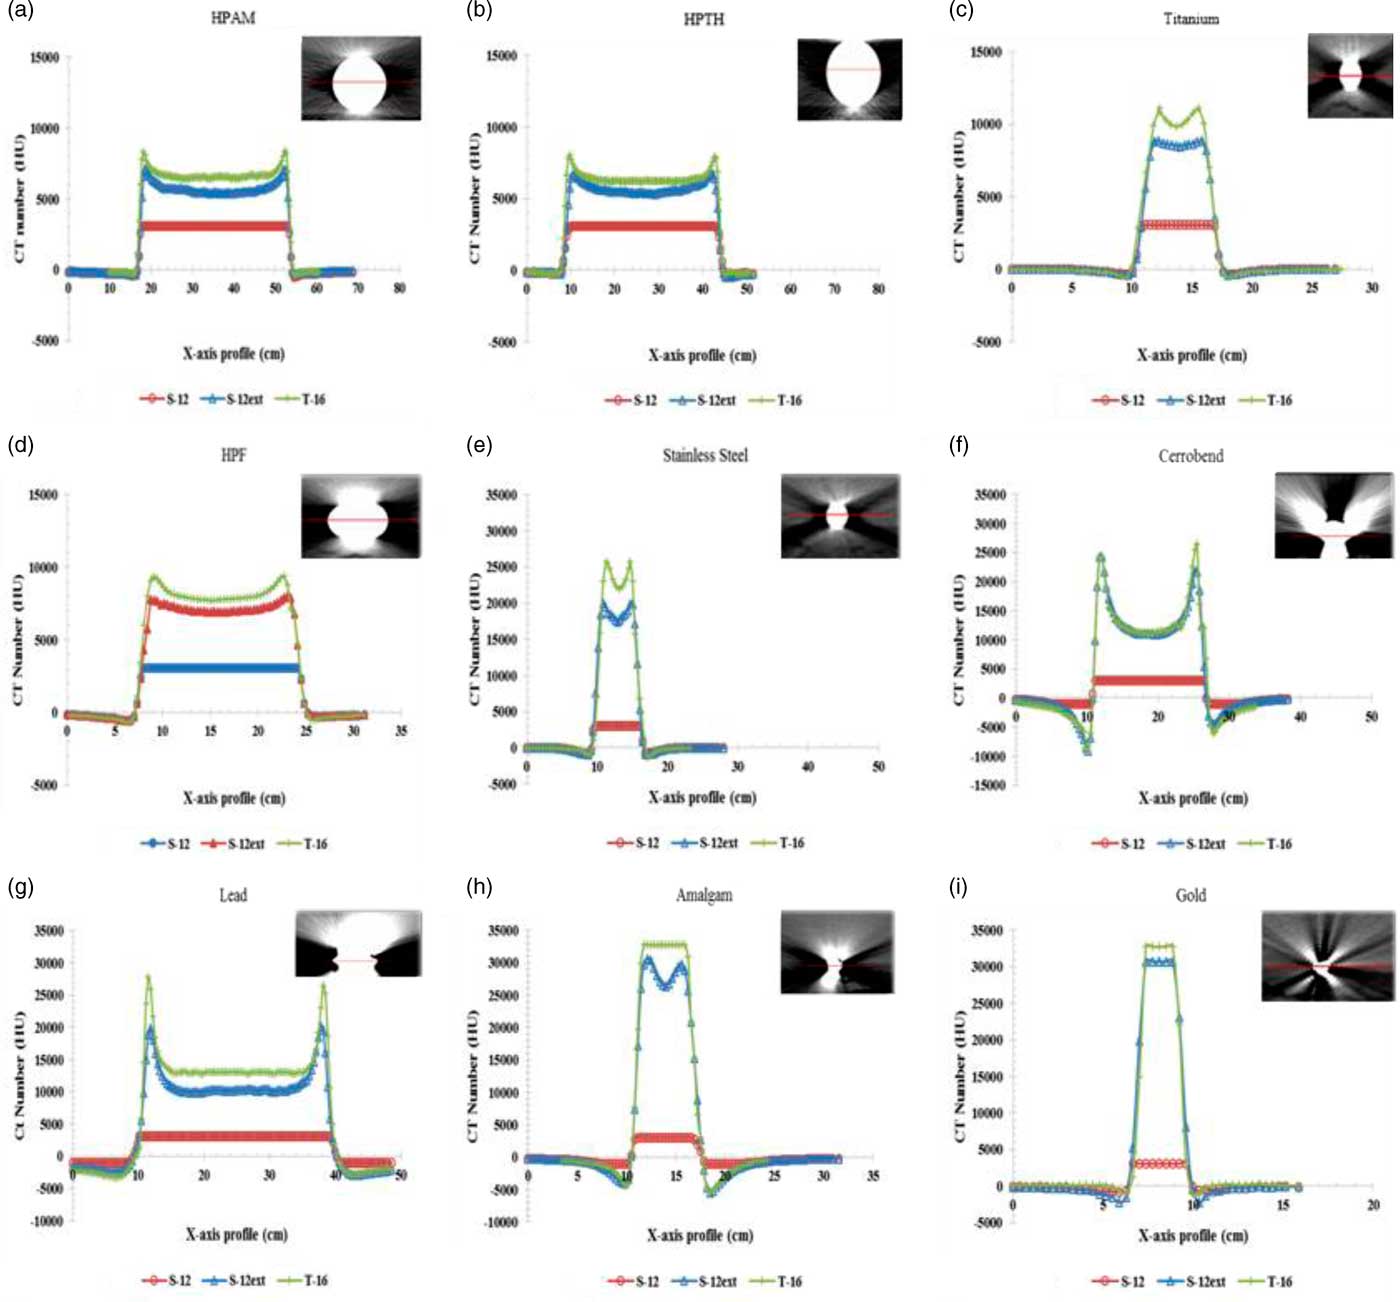
A plot profile of each material was investigated for 12-bit, 12-bit extended and 16-bit depth experiment, as shown in Figure 5. The results for each material show that 12-bit truncates at 3,071 and had a flat profile along the metal sample. Meanwhile, 12-bit extended and 16-bit show higher range up to 32,767 with the cupped profile. Yet, 12-bit extended range is lower than the 16-bit range.
Plot profile of CT number for metals in 12-bit (S-12), 12-bit extended (S-12ext) and 16-bit depth (T-16). (a) HPAM, (b) HPTH, (c) titanium, (d) HPF, (e) stainless steel, (f) cerrobend, (g) lead, (h) amalgam and (i) gold.

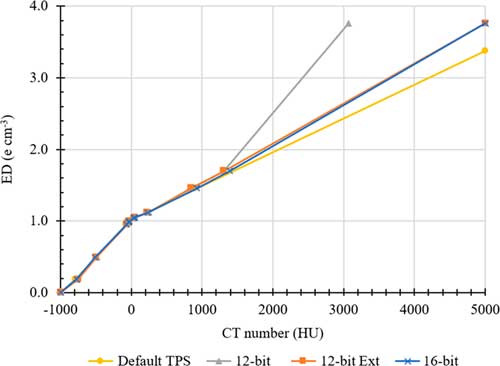
The CT–ED conversion curve plotted for 12-bit, 12-bit extended and 16-bit scanners, as shown in Figure 6. This graph was plotted for electron density ranges from 0·19 to 1·17 g cm−3, as given in CIRS phantom, and high-density materials, as measured in the previous section. However, a limitation with the current MONACO TPS is the maximum CT number allowed is 5,000 HU, and ED was limited to 15 relative electron density. This automatically truncates the CT-density value to be read by the TPS, as shown in Figure Reference Das, Cheng, Cao and Johnstone5. The 12-bit curve truncates at 3,071 HU for titanium and at 5,000 HU for 12-bit extended and 16-bit.
CT–ED look-up table implemented in this study for default CT–ED; 12-bit, 12-bit extended and 16-bit depth.

This new CT–ED conversion curve was loaded in MONACO TPS and a 6 MV direct anterior beam was planned on each metal to analyse the dosimetry outcome. The 6 MV photon beam attenuation was examined in the centre of each metal. The depth–dose curve was plotted for 12-bit, 12-bit extended and 16-bit depth, as shown in Figure 7. The results show that different bit depth DICOM images resulted in dose variation in 12-bit, 12-bit extended and 16-bit depth except for HPTH, titanium, stainless steel, amalgam and gold. The radiation dose attenuated severely at the region of metals compared to the reference image. Moreover, 16-bit depth images have a lower radiation dose compared to 12-bit depth images, particularly in HPAM, HPTH, titanium and lead.
Depth–dose dosimetry at the centre of metal using updated CT–ED (on right) file follows the bit depth of DICOM image compared with default CT–ED (on left) in MONACO TPS in metals of (a) HPAM, (b) HPTH, (c) titanium, (d) HPF, (e) stainless steel, (f) cerrobend, (g) lead, (h) amalgam and (i) gold. Highlighted region is position of metal sample. Reference dosimetry in a phantom without inhomogeneity

Discussion
Heterogeneity in the human body affects the radiation distribution during treatment, thus corrections must be made to minimise errors in the algorithm caused by different densities of materials. Each pixel in a DICOM image represents a CT number that has a direct relationship to density identified by the TPS algorithm. Thus, it is important to determine an accurate CT-to-density conversion because the CT number depends on the individual scanner.Reference Gao, Sun, Ni, Fang and Lin 17
Bit-depth is a fundamental factor affecting the CT number of high-density materials. High-density materials are essential in CT number analysis, as they require the scanner to have an extended CT scale to determine the true CT number. CT number variation for high-density materials has not been studied in detail because of limitations inherent in 12-bit scanners where the CT number truncates at 3,071 HU (Table 1 (a)). The development of extended scale CT scanners was helpful in determining CT number for high-density materials. In this study, CT number for various high-density materials using two scanners with different bit depths was characterised. Significant differences in CT number were noticed among the 12-bit, 12-bit extended and 16-bit scanners for materials with density >4·34 g cm−3 when three different voltages (80, 100 and 120 kVp) were applied. A study carried out by Gao et al. (2017) stated that the CT number of metal (stainless steel: 14,568 HU in 100 kVp; 14,127 HU in 120 kVp and titanium: 9,420 HU in 100 kVp; 8140 HU in 120 kVp) decreased as tube voltage increased and the results in this work show the same outcome.Reference Gao, Sun, Ni, Fang and Lin 17 Tube voltage alters the photon energy emitted by the CT scanner and the attenuation coefficient varies with this photon energy. When an 80 kVp tube voltage is applied (lowest energy), the number of photons attenuated by the high-density material decreases, the attenuation coefficient of that material increases, thus CT number increases. However, in this study, it is suitable or titanium, HPF and stainless-steel material. Higher density (i.e., lead: 9·38 g cm−3) metals show lower CT number in low tube voltage due to a reduced number of photon penetrating through the metal and causes beam hardening and streak artefacts.
There is a clear deviation between the 12-bit extended and 16-bit data for both scanners observed in Figure 3. The 12-bit saturated at CT number of 3,071 HU for all kVp studied for density higher than 4·34 g cm−3 due to its range from −1,024 HU to 3,071 HU. In contrast, 12-bit extended and 16-bit experiments resulted in mean values ranging more than 3,071 HU for a density more than 4·34 g cm−3. Figure 3 shows that the 16-bit scanner produced higher CT numbers than the 12-bit extended scanner for voltages of 80, 100 and 120 kVp. This occurs because the12-bit extended is computed by ten times of the initial value in 12-bit depth. Thus, 12-bit extended does not show the true value compared to a full range of 16-bit depth. The mean CT number variation was highest in a material with density >4·34 g cm−3, as shown by the statistical comparison of the 12-bit extended and 16-bit data (Table 2 (a)) except for amalgam and gold in 16-bit.
In this study, differences in voltage resulted in variation in CT number by 1,567 HU for titanium (4·54 g cm−3) and 1,280 HU difference reported by Gao et al. (2018) in 12-bit extended scanner.Reference Das, Cheng, Cao and Johnstone 5 This phenomenon occurs because photoelectric attenuation is higher for low-energy photon beams (Figures 2 and 3).Reference Das, Cheng, Cao and Johnstone 5 , Reference Mahmoudi, Jabbari, Aghdasi and Khalkhali 18 , Reference Ebert, Lambert and Greer 19 The CT numbers of all low-density materials (<1·1 g cm−3) are similar at 80, 100 and 120 kVp, but the greatest deviations occur at lowest energy (80 kVp) in higher density because the photoelectric effect is dominant over the Compton effect.Reference Das, Cheng, Cao and Johnstone 5 , Reference Zurl, Tiefling, Winkler, Kindl and Kapp 20 Thus, among the three tube voltages tested, 120 kVp resulted in the lowest CT number variation for both bit depths.
Gold reached the maximum CT value for the 16-bit (32,767 HU) and 12-bit extended (30,710 HU) scanners. Amalgam also reached the maximum value in the 16-bit scanner, and the values were high for the 12-bit extended (23,000–26,000 HU for 80–120 kVp). CT number reached the maximum value in the16-bit depth in DICOM. This result confirms that the 16-bit system resulted in a higher CT number than the extended 12-bit scanner. From this result, the CT number of gold exceeds the 16-bit range, hence further analysis is required by extending to a larger bit depth images. Both gold and amalgam are used for nasopharyngeal cancer treatment, and they are prone to dosage miscalculation because of thresholding in the scales of both 12- and 16-bit depths.Reference Webster, Rowbottom, Mackay, Voet and Levendag 21
The plot profile in Figure 5 indicates the limitation of CT number for each metal sample. The 12-bit profile shows the flat surface line which indicates that it reached the maximum limit for that bit depth. For 12-bit extended and 16 bit-depths the results show CT number more than 3,071 HU and have a cupping profile of photon attenuation by the metal. The higher the density, the deeper the cupping profile. For large-sized implants, for example, hip prosthesis, or materials of high atomic number, such as amalgam and gold, the attenuation of the photon beam is stronger to the point that no photons reach the detector (photon starvation) resulting incomplete or missing information in the CT projection. Thus, it resulted in lower CT number since lower attenuation detected.Reference Coolens and Childs 3 Gold is an exception with a flat profile in both 12-bit extended and 16-bit depth in this study. Hence, it clearly shows that the CT number for gold truncates even in 16-bit depth and hence more studies required for the gold sample.
An accurate determination of the relationship between CT number and ED is required to calculate dose distribution accurately. A 20 HU change in CT number for soft tissue and 250 HU in bone structures results in 1% change in monitor unit (MU) for brain and 2% change for lung and pelvis case.Reference Yagi, Ueguchi and Koizumi 1 , Reference Papanikolaou, Battista and Boyer 8 In this experiment, the results show that 120 kVp in high-density materials resulted in the lowest variation (448 HU for HPF) analysis between 12-bit extended and 16-bit. However, the higher the density, the CT number changes up to 7,435 HU between 12-bit extended and 16-bit. Thus, additional attention is required when encountering high-density materials in radiotherapy planning with different bit depth.
Comparing the 12-bit and 16-bit, the 16-bit CT–ED conversion curve ends with the exact CT data and is advocated to be used in the radiotherapy TPS. This improvement in CT–ED conversion curve will be beneficial in dosimetry calculation in TPS. However, in this study, MONACO TPS CT number is limited to 5,000 HU in the system and it is a huge drawback to input the exact CT–ED value. Dosimetry analysis was carried out and ends with minimal variation in new CT–ED conversion curve of 12-bit, 12-bit extended and 16-bit depth compared to default CT–ED that exist in the system. At the region of high-density materials, the highest dose fluctuation occurs for all materials, as shown in Figure 7. A study conducted by Glide-Hurst, 2013, the gamma analysis revealed that 16-bit dose calculations have 10% higher passing rate than 12-bit.Reference Glide-Hurst, Chen, Zhong and Chetty 4
TPS results show that 6 MV photon beam highly attenuated at the region of metal samples compared to the reference images. CT–ED conversion curve of 16-bit depth shows a lower dose compared to the 12-bit and 12-bit extended. The result supported by the Xin-ye (2017) where the dose at downstream of titanium and stainless steel in 12-bit was 15·9%, and 42·7% higher than 16-bit depth.Reference Xin-Ye, Liugang, Mingming and Tao 7 However, current results (Figure 7) show the new CT–ED conversion curve in TPS reduced the radiation dose variation among 12-bit, 12-bit extended and 16-bit depths. Thus, CT–ED conversion curve needs to be updated in the TPS system to provide accurate dose calculation.
Conclusion
In this study, the 16-bit scanner yielded higher CT numbers for high-density materials (>4·34 g cm−3) and this was compared with the 12-bit extended scanner. Further analysis is required for amalgam and gold materials, as they reached the saturation level of the 16-bit scale (32,767 HU). However, to fully attain 16-bit data it requires CT scanner capability to generate and store 16-bit data in the TPS. Each bit-depth requires its own CT–ED conversion curve to deliver minimal variation in radiation dosimetry output. Compared with the 12-bit imaging technology, the 16-bit imaging technology enhances the dose computational accuracy of the TPS.
Acknowledgements
The authors are grateful to Professor Dr Amran Ahmed Shokri, Medical Lecturer in Orthopaedic Department, School of Medical Sciences, Universiti Sains Malaysia (USM) for providing hip prosthesis samples and also acknowledge the contribution of the staffs of the Radiotherapy and Radiology Unit, Advanced Medical and Dental Institute, USM for their help with the CT scanners.
Financial support
The authors would like to thank the Universiti Sains Malaysia (USM) for providing a grant under the Research University Incentive (RUI) 1001/CIPPT/8011001.
Conflicts of interest
The authors have no potential conflict of interest to disclose.