THE CHALLENGE OF LEISHMANIA DIVERSITY
Leishmania is a group of kinetoplastid protozoa with a highly diverse character. The genus includes more than 20 parasite species infecting humans following transmission by a sand fly (Diptera: Psychodidae: Phlebotominae). All species are pathogenic, but the disease manifestation depends on the infecting species and varies from self-healing skin lesions, to disfiguring mucocutaneous lesions, to lethal visceral disease. Even a single Leishmania species can challenge health professionals with enormous clinical diversity; disease severity can vary greatly between different patients, variable response or lack of response to administered treatments is often observed, and post-leishmaniasis syndrome can appear in some, but not all cases. This clinical polymorphism results from the interaction between several factors, including variation in the host, parasite, vector, and environment (Dujardin, Reference Dujardin2009). Hardly anything is known about the nature and identity of the intra- and inter-species molecular differences underlying the clinical polymorphism in leishmaniases (Smith et al. Reference Smith, Peacock and Cruz2007). Diversity also marks the Leishmania life cycle, which consists of two distinct life-forms, promastigotes and amastigotes, adapted to life in a sand fly vector and mammalian host, respectively. The transformation from promastigote to amastigote is essential for the parasite's survival upon transmission from vector to host. How Leishmania differentiates between life stages, and which metabolic pathways are essential for survival within each host, are pressing questions requiring an answer in order to develop more effective treatments and alternative control measures against these pathogens in the face of ever increasing resistance to the few available drugs (McConville et al. Reference McConville, de Souza, Saunders, Likic and Naderer2007). A detailed molecular characterization of parasite diversity and the underlying biology, including mechanisms of drug resistance, is therefore a pressing need.
Whole-genome sequencing, transcriptomics studies based on whole genome-based DNA arrays, and global proteomic studies have already been carried out in an effort to characterize Leishmania diversity. Now, the toolbox of post-genomic research has been complemented by metabolomics, which involves global analysis of the metabolites in a cell (i.e. the metabolome) (Fernie et al. Reference Fernie, Trethewey, Krotzky and Willmitzer2004; Goodacre et al. Reference Goodacre, Vaidyanathan, Dunn, Harrigan and Kell2004). Metabolomics is an emerging field in functional genomics that is complementary to the other post-genomic technologies and potentially a powerful tool in its own right to characterize Leishmania diversity. This review starts by providing a critical summary of published Leishmania post-genomic research efforts that have scrutinized Leishmania diversity. Secondly, we will discuss in detail the opportunities and challenges of a metabolomics approach specifically for Leishmania research, focusing on the critical issues of sample preparation, measurement optimization, and setting up an efficient bioinformatics pipeline for processing the complex data generated. Finally, we will briefly discuss how an integrated approach combining information across all molecular levels holds the greatest potential for understanding parasite biology and successfully developing improved control strategies for the debilitating diseases they cause.
CURRENT CONTRIBUTION OF GENOME, TRANSCRIPTOME AND PROTEOME STUDIES
The whole genomes of L. major, L. infantum and L. braziliensis have been sequenced and comparatively analyzed (Peacock et al. Reference Peacock, Seeger, Harris, Murphy, Ruiz, Quail, Peters, Adlem, Tivey, Aslett, Kerhornou, Ivens, Fraser, Rajandream, Carver, Norbertczak, Chillingworth, Hance, Jagels, Moule, Ormond, Rutter, Squares, Whitehead, Rabbinowitsch, Arrowsmith, White, Thurston, Bringaud, Baldauf, Faulconbridge, Jeffares, Depledge, Oyola, Hilley, Brito, Tosi, Barrell, Cruz, Mottram, Smith and Berriman2007). Despite the broad differences in disease pathologies, it appears that the three genomes have a highly conserved gene content, synteny and genome architecture, and only very few genes are species-specific in each genome (5, 26 and 47, respectively). The authors concluded that either (1) a few species-specific genes determine pathogenesis, or (2) the parasite genome plays only a minor role in determining clinical profile, or (3) parasite gene/protein expression levels differ considerably between species, possibly as a consequence of gene dosage in the form of gene copy number variation. The latter hypothesis is supported by comparative studies of Leishmania species (benign cutaneous L. peruviana vs severe cutaneous L. braziliensis) and strains with differential pathogenicity (cutaneous L. infantum vs visceral L. infantum): in both cases, it was shown that the less pathogenic parasites presented fewer copies of ribosomal DNA (affecting general metabolism) and genes encoding surface antigens (affecting interaction with host cells) compared to the more pathogenic parasites (Victoir et al. Reference Victoir, Dujardin, de Doncker, Barker, Arevalo, Hamers and Le Ray1995; Inga et al. Reference Inga, Doncker, Gomez, Lopez, Garcia, Ray, Arevalo and Dujardin1998; Guerbouj et al. Reference Guerbouj, Victoir, Guizani, Seridi, Nuwayri-Salti, Belkaid, Ismail, Le Ray and Dujardin2001; Dujardin, Reference Dujardin2009). A similar gene-dosage-related phenomenon has repeatedly been described in the context of Leishmania drug resistance. Chromosomes containing genes with a functional role in drug resistance were amplified in drug resistant strains, showing polyploidy of the complete chromosome or partial amplification of specific regions as extrachromasomal circular or linear amplicons; this in turn results in up-regulated expression of those amplified genes (Ubeda et al. Reference Ubeda, Legare, Raymond, Ouameur, Boisvert, Rigault, Corbeil, Tremblay, Olivier, Papadopoulou and Ouellette2008; Ouellette et al. Reference Ouellette, Ubeda, Leprohon, Mukherjee, Brotherton, Moreira, Coelho and Raymond2009; Leprohon et al. Reference Leprohon, Legare, Raymond, Madore, Hardiman, Corbeil and Ouellette2009). Hence, Leishmania diversity could very well be encoded by gene copy number variation, either intra- or extra-chromosomal. The three-genome project however, was limited with respect to characterization of copy number variation (gene dosage), as the Sanger sequencing technique used in the project starts with cloned genomic DNA fragments that are first amplified in vivo (Sturm et al. Reference Sturm, Martinez and Thomas2008). Meanwhile new sequencing technologies have been developed that can circumvent this limitation (Hall, Reference Hall2007; Morozova et al. Reference Morozova and Marra2008). In addition to the relatively low cost and high-throughput capacity, these new technologies offer the advantage of generating sequence data that can be used in a sequence census approach. The sequence census approach involves mapping of all sequence reads to its origin in a reference genome; the number of reads that map to a particular nucleic acid species then correlates with the abundance of that sequence in the cell. This allows comparison of gene dosage at a particular locus in different strains (Morozova et al. Reference Morozova and Marra2008). In the near future, this new genomic approach is likely to clarify the role gene dosage plays in generating Leishmania diversity.
Transcriptomics studies have used Leishmania-specific microarrays to assay steady-state levels of mRNA transcripts. Arrays with a genome coverage between 22% and 97·5% have been used to determine differences in expression between different lifecycle stages (Holzer et al. Reference Holzer, McMaster and Forney2006; Leifso et al. Reference Leifso, Cohen-Freue, Dogra, Murray and McMaster2007; Saxena et al. Reference Saxena, Lahav, Holl, Aggarwal, Anupama, Huang, Volpin, Myler and Zilberstein2007; Srividya et al. Reference Srividya, Duncan, Sharma, Raju, Nakhasi and Salotra2007; Rochette et al. Reference Rochette, Raymond, Ubeda, Smith, Messier, Boisvert, Rigault, Corbeil, Ouellette and Papadopoulou2008), to determine expression differences associated with drug resistance (Guimond et al. Reference Guimond, Trudel, Brochu, Marquis, Fadili, Peytavi, Briand, Richard, Messier, Papadopoulou, Corbeil, Bergeron, Legare and Ouellette2003; Singh et al. Reference Singh, Almeida, Kothari, Kumar, Mandal, Chatterjee, Venkatachalam, Govind, Mandal and Sundar2007; Fadili et al. Reference Fadili, Drummelsmith, Roy, Jardim and Ouellette2009) and clinical polymorphisms (Salotra et al. Reference Salotra, Duncan, Singh, Raju, Sreenivas and Nakhasi2006; Singh et al. Reference Singh, Almeida, Kothari, Kumar, Mandal, Chatterjee, Venkatachalam, Govind, Mandal and Sundar2007), and to assess expression differences between different species (Rochette et al. Reference Rochette, Raymond, Ubeda, Smith, Messier, Boisvert, Rigault, Corbeil, Ouellette and Papadopoulou2008). However, all these transcriptomics profiling efforts provided few insights compared to experiences with other microbial pathogens. It seems that due to at least two specific factors of Leishmania biology, transcriptomics is a strikingly uninformative tool to uncover the molecular background of Leishmania diversity. Firstly, Leishmania uses polycistronic transcription and very few promoters, and regulation appears to occur at the post-transcriptional level (McDonagh et al. Reference McDonagh, Myler and Stuart2000; Cohen-Freue et al. Reference Cohen-Freue, Holzer, Forney and McMaster2007; Clayton and Shapira, Reference Clayton and Shapira2007). As a consequence, studies comparing different life stages found that indeed the vast majority of genes are constitutively expressed in all development stages. Only a limited number of genes (2–9%) show preferential stage-specific expression, and those quantitative expression changes are often very small and not always easy to detect reproducibly (Cohen-Freue et al. Reference Cohen-Freue, Holzer, Forney and McMaster2007). Secondly, although the Leishmania genome sequencing project is complete, more than 60% of the putative protein coding genes do not match annotated sequences and were assigned a hypothetical function (Ivens et al. Reference Ivens, Peacock, Worthey, Murphy, Aggarwal, Berriman, Sisk, Rajandream, Adlem, Aert, Anupama, Apostolou, Attipoe, Bason, Bauser, Beck, Beverley, Bianchettin, Borzym, Bothe, Bruschi, Collins, Cadag, Ciarloni, Clayton, Coulson, Cronin, Cruz, Davies, De Gaudenzi, Dobson, Duesterhoeft, Fazelina, Fosker, Frasch, Fraser, Fuchs, Gabel, Goble, Goffeau, Harris, Hertz-Fowler, Hilbert, Horn, Huang, Klages, Knights, Kube, Larke, Litvin, Lord, Louie, Marra, Masuy, Matthews, Michaeli, Mottram, Müller-Auer, Munden, Nelson, Norbertczak, Oliver, O'Neil, Pentony, Pohl, Price, Purnelle, Quail, Rabbinowitsch, Reinhardt, Rieger, Rinta, Robben, Robertson, Ruiz, Rutter, Saunders, Schäfer, Schein, Schwartz, Seeger, Seyler, Sharp, Shin, Sivam, Squares, Squares, Tosato, Vogt, Volckaert, Wambutt, Warren, Wedler, Woodward, Zhou, Zimmermann, Smith, Blackwell, Stuart, Barrell and Myler2005). Hence, the majority of identified differentially expressed genes in any of the above mentioned genome-wide transcriptomics studies turn out to have an unknown biological function. Thus so far, transcriptomics has made a modest contribution in unravelling the cell biological story behind Leishmania diversity, as both the function of the identified proteins and their regulation can not always be adequately assessed.
Proteomic studies have been particular useful for the identification of stage-specific proteins. Given the characteristic expression regulation mechanisms of Leishmania, it was not surprising that, compared with the transcriptomics work, proteomic studies reported a higher percentage (12–18%) of the predicted proteome as stage-specifically regulated at the translational or post-translation level (Bente et al. Reference Bente, Harder, Wiesgigl, Heukeshoven, Gelhaus, Krause, Clos and Bruchhaus2003; McNicoll et al. Reference McNicoll, Drummelsmith, Müller, Madore, Boilard, Ouellette and Papadopoulou2006; Leifso et al. Reference Leifso, Cohen-Freue, Dogra, Murray and McMaster2007; Cohen-Freue et al. Reference Cohen-Freue, Holzer, Forney and McMaster2007; Rosenzweig et al. Reference Rosenzweig, Smith, Opperdoes, Stern, Olafson and Zilberstein2008). Most of these studies were based on two-dimensional gel electrophoresis; recently the isobaric tagging technique iTRAQ was successfully introduced and proved to be an elegant method for proteomic time-series experiments (Rosenzweig et al. Reference Rosenzweig, Smith, Opperdoes, Stern, Olafson and Zilberstein2008). The study profiled 931 proteins over 7 life-cycle differentiation time points, which allowed the inference of a map of the dynamics of most major metabolic pathways during differentiation from promastigotes to amastigotes in L. donovani. Proteomics is less rewarding when studying phenotypic or pathologic diversity. Like transcriptomics, proteomic approaches that studied mechanisms of drug resistance (Sharma et al. Reference Sharma, Singh, Chavan and Dey2003; Drummelsmith et al. Reference Drummelsmith, Brochu, Girard, Messier and Ouellette2003, Reference Drummelsmith, Girard, Trudel and Ouellette2004; Vergnes et al. Reference Vergnes, Gourbal, Girard, Sundar, Drummelsmith and Ouellette2007; Singh et al. Reference Singh, Chavan and Dey2008; Fadili et al. Reference Fadili, Drummelsmith, Roy, Jardim and Ouellette2009) or species diversity (Brobey et al. Reference Brobey, Mei, Cheng and Soong2006) very often resulted in a list of differentially expressed proteins lacking an annotated function. This again impedes determination of how the different actors relate to each other and often leaves too many open questions.
THE POTENTIAL OF METABOLOMICS
In order to fully understand the phenotypic characteristics of an organism, it is essential to complement transcriptome and proteome research with metabolomics investigations. The sequenced genome of L. major has already been used to predict the metabolic potential of the organism in two different studies (Chavali et al. Reference Chavali, Whittemore, Eddy, Williams and Papin2008; Doyle et al. Reference Doyle, MacRae, De Souza, Saunders, McConville and Likic2009). Both studies report around 1000 predicted metabolites, all located in core metabolism, and associated to as many enzyme-catalyzed reactions. As cell-based metabolomics encompasses the different cellular compartments, this number of metabolites can be reduced to around 600, correcting for the metabolites occurring in multiple compartments within the cell.
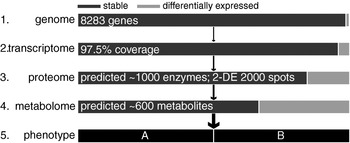
Changes in protein and transcript levels often function as intermediate steps leading to functionally relevant variation at the metabolite level. It is at the metabolite level that most physiological functions are carried out, making the metabolome the closest correlate to the phenotype (Fig. 1). Metabolite levels are not easily predicted by protein or transcript levels due to the highly non-local control structure of the metabolic network (e.g. enzyme inhibitors functioning at distant points in the metabolic network), as revealed by metabolic control analysis (Kell and Westerhoff, Reference Kell and Westerhoff1986), and thus require separate investigation. The existence of metabolic maps (Baxevanis et al. Reference Baxevanis, Page, Petsko, Stein and Stormo2002; Kanehisa et al. Reference Kanehisa, Goto, Kawashima and Nakaya2002) allows for rapid visualization of metabolite changes and determination of the biological impact of the studied conditions on the organism (e.g. which pathways are affected in drug resistant strains).
A rough hypothetical sketch of the progressive variability predicted across molecular levels when moving from Leishmania genotype to phenotype. The arrows indicate the predominant chain of causal influence between the levels. (1) The genome is the most stable molecular player of the system, but even at this level ploidy changes and copy number variation might introduce variability in a species and between species (personal communication J. C. Dujardin). (2) Gene expression studies comparing different Leishmania life stages or phenotypes, have found that 2–9% of all genes are differentially expressed, while over 90% of genes seem to be constitutively expressed (Cohen-Freue et al. Reference Cohen-Freue, Holzer, Forney and McMaster2007). (3) Similar studies based on two-dimensional gel electrophoresis work have found that 5–12% of detected proteins are differentially expressed (Cohen-Freue et al. Reference Cohen-Freue, Holzer, Forney and McMaster2007). (4) We predict that the metabolome will be affected to an even greater degree: due to the high connectivity in the metabolic network and multiple metabolites are linked to single enzymes, changes in protein levels are likely to propagate across the metabolome. (5) Ultimately the changes at the molecular level are reflected in the diverse clinical phenotypes of Leishmania infections (indicated here as phenotype A and B).

Research at the metabolic level is particularly relevant for parasite biology, where metabolic processes are among the major drug targets (for example: dihydrofolate reductase (Methotrexate), ergosterol (Amphotericin B), sterol biosynthesis (azoles), phospholipid metabolism (Miltefosine), and polyamine biosynthesis (Eflornithine)). More generally, it was found that profound metabolic disturbances underlie the lethal effects of almost all drugs. Metabolomics will not only allow for a better understanding of the basic biological processes already partly addressed by transcriptome and proteome studies, but can also be applied to identify metabolic signatures associated with pharmaceutical interventions. Metabolomics allows both (1) profiling the metabolite dynamics associated with the (often unknown) mode of action of effective antiparasitic drugs, and (2) profiling the adapted metabolism of drug-resistant parasites. Metabolic biomarkers could ultimately be reliable predictors of treatment outcome and related clinical polymorphism, in particular because the concentration of metabolites integrates changes happening at both the genomic and environmental level. The effectiveness of metabolomics for signature identification is illustrated in Fig. 2A, which depicts the results of an untargeted metabolomics comparison of drug-resistant and drug-sensitive strains, using metabolite extracts from L. donovani cultures measured on an LTQ Orbitrap mass spectrometer combined with HILIC liquid chromatography (Decuypere et al. unpublished). Resistant and sensitive strains are clearly separated on the first principal component (explaining 54·4% of the total variance), as over 40% of the identified metabolites show changes of larger than two-fold between the two phenotypes (Fig. 2B). A large portion of these changes is located on well understood pathways involving amino acids (and derivatives) and lipids (Fig. 2C), suggesting hypotheses on the biological impact of the change towards drug resistance. The difference between strains is also clearly evident in a heatmap representation based on an unsupervised hierarchical clustering of the same metabolomics data (Fig. 3).
Principal component analysis can be used to visualize the data so that the measured variation between samples is maximally visible; here it successfully distinguishes drug-sensitive and drug-resistant samples. (A) Each set of biological and technical replicates is clustered closely together, indicating that cell cultures were reproducibly generated and extracted. Principal component 1 clearly separates the two phenotypes and explains 54·4% of the total variance, while principal component 2 separates the different experiments (samples 1 vs samples 2) and explains 12·1% of the total variance. (B) The distribution of fold-changes between sensitive and resistant strains shows that a number of metabolites exhibit large, almost binary (>10-fold) differences between the two phenotypes. A total of 49 (41·1%) metabolites show difference of more than 2-fold. (C) Zooming in on the differences per metabolite class shows variability of the relative expression in sensitive vs resistant strains across different metabolite classes.

Hierarchical clustering shows clear separation of the metabolite profiles of sensitive and resistant strains. As an alternative to PCA, the unsupervised hierarchical clustering method can be used to visualise the metabolite expression levels. The similarity of samples is assessed by calculating the correlation between their metabolite profiles (detected intensity levels), and samples that are more similar are closer in the tree. This method shows that large differences between sensitive and resistant strains are observed for almost all the metabolite classes.

SAMPLE PREPARATION
Production of reproducible cell cultures and reliable, quantitative extraction of metabolites is the most vital step of any metabolomics study. It is also very challenging, as, for example, the presence of contamination or other confounding factors during sample preparation will likely influence the outcome of the experiment. The lack of well-designed experimental metabolomics reference studies on parasites makes this task even more challenging. The close causal relation between the metabolome and the phenotype makes the metabolome susceptible to any changes in growth conditions (medium, temperature, growth rate, etc.), making it difficult to obtain reproducible cell cultures. When comparing several strains on a global metabolite level at one particular growth stage, it is an absolute necessity to collect samples from parasite cultures perfectly synchronised to be at the same stage of growth. In order to monitor the events at the metabolic level in more detail, each study should include time course based comparisons. This approach will ultimately also help to visualise metabolite dynamics.
In general, metabolite extracts used for metabolomics should contain as many different metabolites as possible, of different chemical classes, in their original state, and in a quantitative and non-biased manner (Dunn et al. Reference Dunn, Bailey and Johnson2005; Lu et al. Reference Lu, Zhao, Bai, Zhao, Lu and Xu2008). Quenching and cell permeabilization are necessities for achieving this, as they guarantee an accurate snapshot of the physiological conditions of intracellular metabolites. The quenching procedure effectively stops metabolism in all the cells in the culture and needs to act rapidly, as the turnover of biologically important metabolites, such as ATP or NADH, can be in the order of fluxes of millimoles per litre per second in living cells (Winder et al. Reference Winder, Dunn, Schuler, Broadhurst, Jarvis, Stephens and Goodacre2008). Great care also needs to be exercised as seemingly innocuous steps such as centrifugation or washing the cells can lead to drastic alterations in intracellular metabolite levels. Quenching is usually done by rapidly changing the cell temperature or pH. For single-cell species such as Leishmania several methods exist, including: rapid filtration through an ultrafiltration membrane and subsequent flash-freezing in liquid nitrogen (Wittmann et al. Reference Wittmann, Krömer, Kiefer, Binz and Heinzle2004), or, more frequently, dilution of cells in cold organic solvent (e.g. methanol, glycerol), with or without buffer (Faijes et al. Reference Faijes, Mars and Smid2007; Villas-Bôas and Bruheim, Reference Villas-Bôas and Bruheim2007; Sellick et al. Reference Sellick, Hansen, Maqsood, Dunn, Stephens, Goodacre and Dickson2009). Due to chemical and physical dissimilarities between the cell envelopes of single cell organisms, these approaches do not work equally well for all organisms. Leakage of intracellular metabolites, for example, is practically unavoidable (Winder et al. Reference Winder, Dunn, Schuler, Broadhurst, Jarvis, Stephens and Goodacre2008) and can have a strong impact on the observed metabolite concentrations in the extract.
Due to the vast chemical variability of metabolites, covering the complete metabolome in a single experiment is practically impossible. Procedures for non-targeted metabolite extraction focus mainly on obtaining the largest possible representation of relevant metabolites. As parasite cells tend to easily burst when organic solvents are added, hot ethanol extraction (Kamleh et al. Reference Kamleh, Barrett, Wildridge, Burchmore, Scheltema and Watson2008), and chloroform/methanol/water extraction (De Souza et al. Reference De Souza, Saunders, McConville and Likic2006) are the current methods of choice for untargeted metabolomics in protozoan parasites. When lipids are targeted, a Bligh–Dyer extraction is recommended as the best approach (Gibellini et al. Reference Gibellini, Hunter and Smith2009).
METABOLOME ANALYSIS
By far the most popular platform for quantification of analytes at a concentration ranging from sub-picomolar to molar levels is mass spectrometry in combination with liquid chromatography (LC–MS), which enables rapid detection of a variety of soluble analytes in a complex sample (Dunn et al. Reference Dunn, Bailey and Johnson2005). The combination with liquid chromatography reduces the complexity of the mass spectrum at each time along the chromatographic run, potentially separates isomers, and reduces undesired side-effects such as ion suppression (the presence of one compound strongly affecting the signal of another metabolite). It also provides a characteristic retention time for each metabolite, which assists in distinguishing the compound and determining its general chemical properties. The increase in sensitivity and resolution of LC–MS achieved in recent years, most notably with the introduction of the Orbitrap (Hardman and Makarov, Reference Hardman and Makarov2003), allows for the reliable detection of even those metabolites present at small concentrations in a diverse and variable biological matrix. Continuing improvements of mass spectrometry technology will keep pushing the limits of detectability even further (Han et al. Reference Han, Danell, Patel, Gumerov, Scarlett, Speir, Parker, Rusyn, Zeisel and Borchers2008).
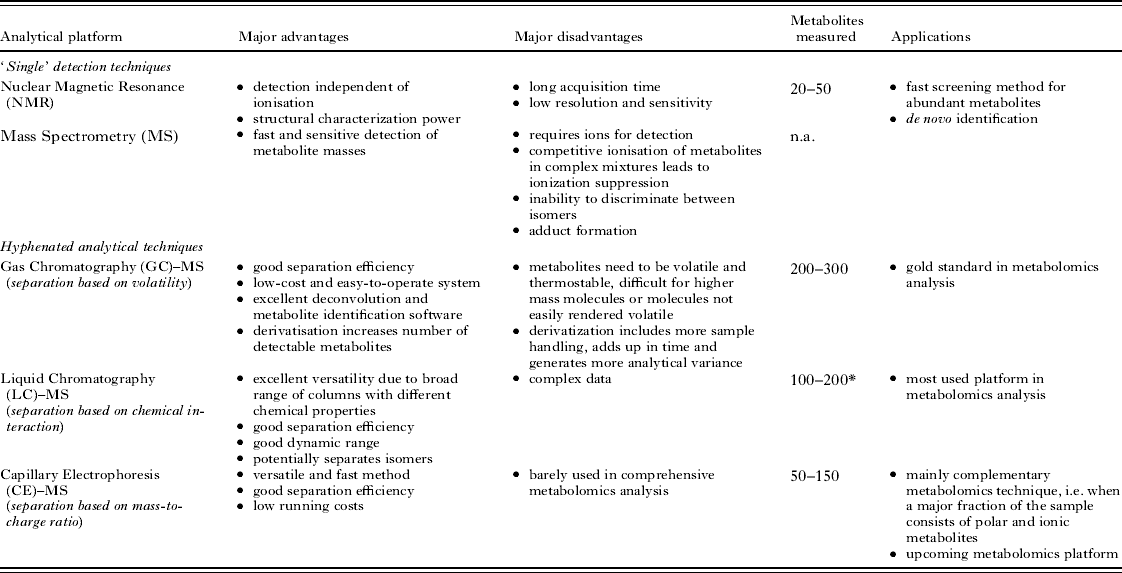
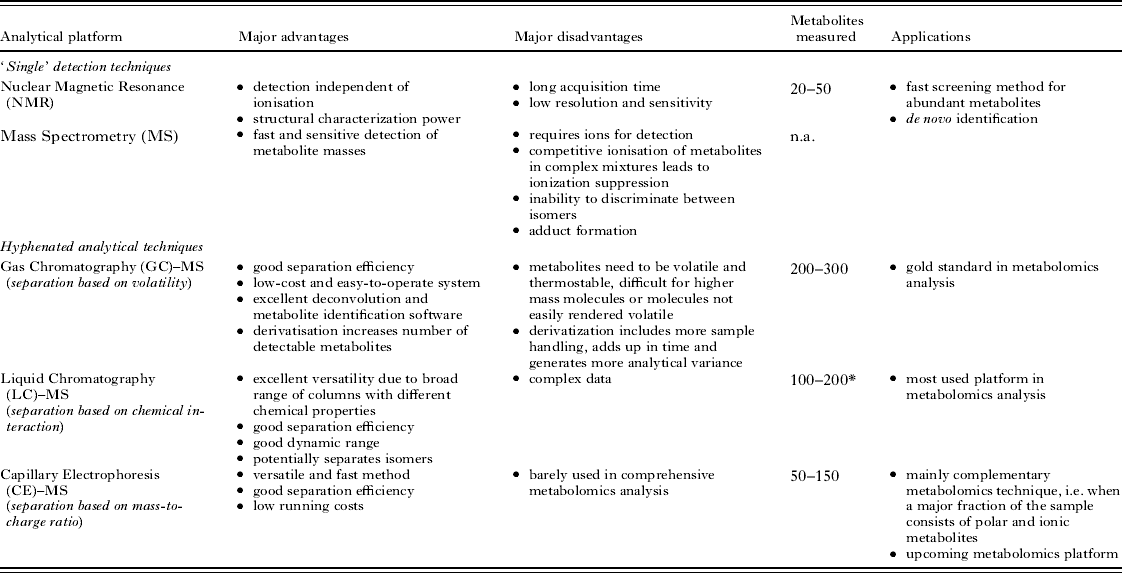
LC–MS has already been successfully applied to a wide variety of organisms, most notably plants and bacteria (Fiehn, Reference Fiehn2001; Kell, Reference Kell2004). A review of recently published results indicates that a single experiment can quantify between 100 and 200 metabolites in whole-cell extracts (Atherton et al. Reference Atherton, Bailey, Zhang, Taylor, Major, Shockcor, Clarke and Griffin2006; Dunn et al. Reference Dunn, Broadhurst, Brown, Baker, Redman, Kenny and Kell2008), corresponding to roughly 10% of the predicted core metabolism. Such a figure stresses the need for more comprehensive techniques to generate an overview of the full complexity of the metabolome. For example, a more satisfactory coverage with LC–MS can be achieved by combining measurements from different chromatographic separation techniques (reversed phase chromatography, hydrophilic interaction chromatography, and ion pair chromatography). Additionally, the current use of LC–MS does not allow for quantification of all detected metabolites (although quantification of selected compounds is possible using C13-labelled standards). This is partly solved by additional measurements using nuclear magnetic resonance spectrometry, which offers the ability to quantify highly abundant metabolites. In Table 1 (Atherton et al. Reference Atherton, Bailey, Zhang, Taylor, Major, Shockcor, Clarke and Griffin2006; van der Werf et al. Reference van der Werf, Overkamp, Muilwijk, Coulier and Hankemeier2007) a current overview of the advantages and disadvantages of commonly used analytical techniques is provided, including an estimated number of identifiable metabolites and their applicability or popularity within the field of metabolomics.
Each analytical technique suitable for metabolite profiling has specific strengths and weaknesses. Generally, a single analytical method achieves a coverage of roughly 5–10% of the expected metabolome, which can be extended by use of a combination of complementary analytical techniques (van der Werf et al. Reference van der Werf, Overkamp, Muilwijk, Coulier and Hankemeier2007). The number presented in the column ‘metabolites measured’ provides a rough estimate of the number of metabolites that can be identified using the described analytical method (*, using a single chromatographic column).
BIOINFORMATICS CHALLENGES
The sensitivity and resolution currently achieved in mass spectrometry enables the use of complex samples in elaborate experiments (e.g. collecting samples along finely resolved time-series). These can potentially yield large informative datasets about parasite physiology very rapidly, but their interpretation will require extensive bioinformatics efforts. Compared with gene expression microarrays, metabolite mass spectra are far more complex and impossible to interpret manually on a large scale. For example, deconvolution of the detected signals is not yet an established routine operation.
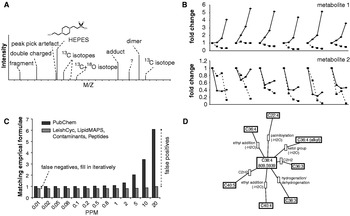
Data generated by mass spectrometry platforms contain large amounts of signals, few of which can be identified by database matching (Fig. 4A). Many of the unidentified signals correspond to analyte derivatives (e.g. isotope peaks, adducts, fragments, multiply charged molecules) and are of interest for the identification of signals, but not for the biological interpretation of the measurements. In order to ease identification, reduce false positives and locate novel analytes, these signals need to be tagged in the data. Such procedures are already well-established for GC-MS data, but are lacking for LC-MS data. The combination of LC–MS with complex experiments such as high-resolution time series or multiple perturbations helps achieving this aim (Tautenhahn et al. Reference Tautenhahn, Böttcher, Neumann, Hochreiter and Wagner2007). Using data-driven clustering based on signal shape correlation and intensity patterns across biological replicates, derivative signals can be identified reliably. In our experiments on Leishmania parasites we have found that over 60% of the detected signals consist of derivatives (Decuypere et al. unpublished). Time series not only allow for determination of metabolome dynamics following drug treatment or during cellular differentiation, but the intensity correlation pattern among adjacent time points can also be used for sensitive detection of measurement artefacts or spurious fluctuations in metabolites levels (Fig. 4B).
Illustrations of some bioinformatics challenges for metabolomics data. (A) Mass spectrometry data contain a large amount of signals, most of which can be identified as derivatives of a metabolite of interest (e.g. isotopes, adducts). Data-driven reduction approaches help to reveal these derivative signals and reduce the annotation burden. (B) Time series data can reveal metabolite dynamics following drug treatment or during differentiation, but also provide important validation of observed expression levels. Here 6 biological replicates with (dashed) and without (solid) perturbation are tracked over 4 time points for two metabolites, providing insight into their dynamic response to perturbation. (C) After the applied deconvolution approaches, the detected compounds need to be identified. The graph shows how the use of specific databases (~10·000 compounds; light-grey bars), in combination with higher mass accuracy, results in a drastically lower number of false positives compared to using the comprehensive PubChem database (more than 40 million compounds; dark-grey bars),; this can significantly reduce the burden of manual curation. Interestingly, PubChem will always result in a match, while the collection of databases does not (false negatives; number of matches smaller than 1). To fill in the gaps, the remaining unidentified signals are iteratively assigned putative identities using progressively less specific databases. The resulting putative identifications then need to be verified with orthogonal identification techniques (e.g. fragmentation studies). (D) Using the observed exact mass differences between metabolites it is possible to organise the observations in hypothetical metabolic networks by linking them with a discrete set of biochemical transformations, further facilitating the interpretation process.

Signals can be putatively identified by matching them on mass to species-specific metabolite databases such as LeishCyc (Doyle et al. Reference Doyle, MacRae, De Souza, Saunders, McConville and Likic2009), compound class-specific databases such as LipidMAPS (Fahy et al. Reference Fahy, Sud, Cotter and Subramaniam2007), and contaminant databases, the latter allows removal of typical impurities and buffer components often detected in metabolomics experiments (Keller et al. Reference Keller, Sui, Young and Whittal2008). For many samples it is also useful to specifically search for computer-generated lists of, for example, possible di- and tripeptides. Together, this set of databases is a best first guess of the identity of the expected metabolites for a Leishmania sample, and results in most cases in a single chemical formula per signal (Fig. 4C). Remaining unidentified compounds can then be matched iteratively to more comprehensive databases, including KEGG (Kanehisa et al. Reference Kanehisa, Goto, Kawashima and Nakaya2002), Metlin (Smith et al. Reference Smith, O'Maille, Want, Qin, Trauger, Brandon, Custodio, Abagyan and Siuzdak2005), the Human Metabolome Database (Wishart et al. Reference Wishart, Tzur, Knox, Eisner, Guo, Young, Cheng, Jewell, Arndt, Sawhney, Fung, Nikolai, Lewis, Coutouly, Forsythe, Tang, Shrivastava, Jeroncic, Stothard, Amegbey, Block, Hau, Wagner, Miniaci, Clements, Gebremedhin, Guo, Zhang, Duggan, MacInnis, Weljie, Dowlatabadi, Bamforth, Clive, Greiner, Li, Marrie, Sykes, Vogel and Querengesser2007) or PubChem (Wang et al. Reference Wang, Xiao, Suzek, Zhang, Wang and Bryant2009), in roughly this order. These larger databases tend to give more spurious hits, and careful manual curation of the results is required. The concurrent use of gas chromatography coupled to mass spectrometry (GC–MS) in a comprehensive platform will greatly enhance the unambiguous identification of metabolites. The stable retention times produced with this method and the existence of libraries containing retention time information for a huge array of analytes allows almost complete automation of this process (Pasikanti et al. Reference Pasikanti, Ho and Chan2008).
The high mass accuracy has additional advantages. An area of particular interest for parasite metabolomics is the ab initio extension of the metabolic network (Fig. 4D): based on the extremely accurate mass information provided by the newest mass spectrometers, it is possible to identify potential metabolic transformations connecting the observed mass peaks (Breitling et al. Reference Breitling, Ritchie, Goodenowe, Stewart and Barrett2006). These hypothetical connections between metabolites can be used to explore the metabolic context of unidentified compounds, to highlight connected areas of the metabolome that show concerted changes in response to a perturbation, such as drug treatment or cellular differentiation, and to expand the computational genome-based reconstructions of the metabolic network to include novel pathways that may be species-specific (Breitling et al. Reference Breitling, Vitkup and Barrett2008). This may be particularly relevant for Leishmania: after all, roughly 1000 genes are specific to this genus, and only very few of them have been functionally characterized (Peacock et al. Reference Peacock, Seeger, Harris, Murphy, Ruiz, Quail, Peters, Adlem, Tivey, Aslett, Kerhornou, Ivens, Fraser, Rajandream, Carver, Norbertczak, Chillingworth, Hance, Jagels, Moule, Ormond, Rutter, Squares, Whitehead, Rabbinowitsch, Arrowsmith, White, Thurston, Bringaud, Baldauf, Faulconbridge, Jeffares, Depledge, Oyola, Hilley, Brito, Tosi, Barrell, Cruz, Mottram, Smith and Berriman2007). The network context can also be used to support identifications of metabolites (Rogers et al. Reference Rogers, Scheltema, Girolami and Breitling2009), which is further supported by the combination with tandem mass spectrometry fragmentation patterns (Bocker et al. Reference Bocker and Rasche2008).
FUTURE PERSPECTIVE
Once metabolomics has been established as a routine tool for Leishmania research, the next challenge will be the integration of data across the various molecular levels. A comprehensive understanding of Leishmania diversity is likely to require work at the genome, proteome and metabolome levels in a unified framework. With the current technological advances, such a framework has come within reach. The new genome sequencing technologies developed over the past years, allow whole genome comparative analyses of multiple strains of a given species. We expect that the integration of global genomic and metabolomic properties will result in unprecedented insight into parasite diversity at the molecular level. The exploitation of the resulting systems-wide view and its effective translation to treatment strategies will require new alliances between specialized high-tech centres, developing advanced measurement technologies, and institutions engaged in the field, at the frontline of infectious disease research. A first initiative for post-genomic integration in Leishmania research is the GeMInI consortium (http://www.leishrisk.net/gemini), which brings together next generation sequencing and high-performance metabolomics on drug-sensitive and resistant Leishmania donovani clinical isolates.
ACKNOWLEDGEMENTS
The authors thank the British Society for Parasitology for organizing the Autumn Symposium 2009 and offering the opportunity to publish this review. We also thank Dave Watson (Strathclyde University) for the fruitful collaboration on generating high-quality metabolomics data for Leishmania, and Marnix Medema and Andris Jankevics for their helpful comments.
FINANCIAL SUPPORT
This work was supported by an NWO-Vidi grant to RB. The work of RAS was funded by an NWO-Vici grant to Ritsert Jansen (Groningen). The GeMInI initiative of the Institute of Tropical Medicine, a Marie Curie Intra-European Fellowship (contract DonNA-R – 041465) and the Baillet–Latour Foundation provided financial support for SD.