INTRODUCTION
Cassava (Manihot esculenta Crantz) is an important storage root crop grown worldwide. It is the fourth most important food crop and an essential component of the diet of millions of people in many parts of the world (El-Sharkawy Reference El-Sharkawy2012). The crop is cultivated mainly for its starchy storage roots (Burns et al. Reference Burns, Gleadow, Cliff, Zacarias and Cavagnaro2011) and as such is one of the key carbohydrate sources in the nutrition of smallholder farmers that grow it.
Cassava is traditionally considered a long-duration crop; however, a number of studies have demonstrated the existence of early-bulking genotypes (Wholey & Cock Reference Wholey and Cock1974; Ntawuruhunga & Dixon Reference Ntawuruhunga and Dixon2010; Suja et al. Reference Suja, John, Sreekumar and Srinivas2010; Kamau et al. Reference Kamau, Melis, Laing, Derera, Shanahan and Ngugi2011; Bassey & Harry Reference Bassey and Harry2013). Since early bulking in cassava depends on genetic and environmental factors (Ntawuruhunga & Dixon Reference Ntawuruhunga and Dixon2010; Suja et al. Reference Suja, John, Sreekumar and Srinivas2010), a deeper understanding of the relationship between these factors is essential in order to breed early-bulking cassava genotypes successfully.
Early bulking has become an increasingly important trait because it is believed that earliness will transform cassava from a traditional to an industrial crop (Okogbenin & Fregene Reference Okogbenin and Fregene2002). It is also considered to be important in situations where mounting pressure on land for urban and industrial development compels farmers to intensify production, and in semi-arid regions, where early-bulking genotypes can be harvested after only one cycle of rain (Amenorpe et al. Reference Amenorpe, Amoatey, Darkwa, Banini and Elloh2007; Okechukwu & Dixon Reference Okechukwu and Dixon2009; Kamau et al. Reference Kamau, Melis, Laing, Derera, Shanahan and Ngugi2011). Moreover, one way of improving the efficiency of cassava productivity in terms of fresh storage root yield (FSRY) per unit time is by developing early-bulking genotypes with shortened growth periods (Wholey & Cock Reference Wholey and Cock1974).
Despite the advantages of harvesting cassava early, it can be problematic in certain areas because the time of harvest may not coincide with the best planting time for the new crop. Moreover, cassava planting material cannot be stored for more than 2 months (Ceballos et al. Reference Ceballos, Kulakow and Hershey2012) and farmers would therefore be short of planting material. However, a farmer could leave a section of the field for late harvesting specifically to generate planting material for the next planting season.
There are no clear above-ground traits available for monitoring early storage root bulking in cassava; therefore, destructive sampling of plants to assess the storage roots is conducted. Kawano (Reference Kawano and Hershey1987) recommended the use of FSRY as the criterion for assessing early bulking. Similarly, Hershey (in press) reported that research on early bulking done at the International Center for Tropical Agriculture (CIAT) suggests that genotypes with the highest FSRY at an early harvest time also tend to be the highest-yielding genotypes at later stages and therefore that high early storage root yield is co-selected with early bulking. Ground-penetrating radar presents the exciting potential to monitor storage root bulking in cassava over time without conducting destructive sampling, as currently done in forestry research (Zenone et al. Reference Zenone, Morelli, Teobaldelli, Fischanger, Matteucci, Sordini, Armani, Ferrè, Chiti and Seufert2008).
Storage root yield is the central trait in all cassava breeding programmes (Aina et al. Reference Aina, Dixon and Akinrinde2007; Ntawuruhunga & Dixon Reference Ntawuruhunga and Dixon2010) and has been reported to be genetically correlated with storage root number (SRN), harvest index (HI), storage root size and canopy size (Ntawuruhunga & Dixon Reference Ntawuruhunga and Dixon2010). Yield improvement can be achieved through exploiting the genetic variability within cassava germplasm (Aina et al. Reference Aina, Dixon and Akinrinde2007). High levels of genetic variability are required amongst parental germplasm to facilitate an effective long-term plant breeding programme and also to justify the need for selection. Selection progress is directly related to the magnitude of genetic variance within a population (Kawuki et al. Reference Kawuki, Ferguson, Labuschagne, Herselman, Orone, Ralimanana, Bidiaka, Lukombo, Kanyange, Gashaka, Mkamilo, Gethi and Obiero2011).
Extensive research has been directed towards identifying the optimum harvest time for cassava based on peak storage root yield (Aina et al. Reference Aina, Dixon and Akinrinde2007; Amenorpe et al. Reference Amenorpe, Amoatey, Darkwa, Banini and Elloh2007; Suja et al. Reference Suja, John, Sreekumar and Srinivas2010; Bassey & Harry Reference Bassey and Harry2013); however, different harvest dates are reported for different genotypes and regions. Therefore, optimum harvest time is dependent on the genetic background of test genotypes, growing conditions and rate of storage root bulking. Storage root bulking, which determines storage root yield, happens as a result of the formation and growth of storage roots that undergo secondary thickening (Izumi et al. Reference Izumi, Yuliadi, Sunyoto and Iijima1999). The growth of storage roots results from an increase in root size and mass, and depends on the sink strength, photosynthetic efficiency of leaves and the potential of leaves to export photo-assimilates (Lahai & Ekanayake Reference Lahai and Ekanayake2009).
The fact that cassava genotypes vary in their rate and pattern of assimilate partitioning, and consequently their earliness, partly explains differences in harvest dates (El-Sharkawy Reference El-Sharkawy2004). Nevertheless, given that cassava is grown for various uses such as production of starch for industrial applications, direct consumption or sold for economic returns, which might influence the time of harvest, studies are needed to establish the optimal harvest time for genotypes cultivated in each region. Moreover, such information can be utilized in breeding for high-yielding, early-bulking cassava genotypes, as well as in identifying research gaps in the quantification and understanding of the existing variation in cassava. Therefore, the current research was conducted to assess the extent of variation in cassava storage root bulking and also to examine the effect of harvest time and location on storage root bulking and other traits of relevance.
MATERIALS AND METHODS
Trial sites
Trials were conducted from April 2011 to June 2012 at Namulonge and Jinja National Agricultural Research Institutes and also at Nakasongola on private farmland. Namulonge is located in central Uganda at 32°36′E and 0°31′N, 1134 m a.s.l. During the trial period, mean annual rainfall was 1264 mm and temperature range was 15·8–27·8 °C. Jinja is located in eastern Uganda at 33°11′E and 0°27′N, 1173 m a.s.l. During the trial period, mean annual rainfall was 1324 mm and temperature range was 16·3–28·1 °C. Nakasongola is a drought-prone area located in central Uganda at 32°27′E and 1°18′N, 1091 m a.s.l. During the trial period, mean annual rainfall was 790 mm and temperature range was 18·6–30·4 °C. The soil properties for each site at planting were recorded (Table 1).
Soil properties at Namulonge, Jinja and Nakasongola at planting

OC, organic carbon; OM, organic matter; N, nitrogen; P, phosphorus; Ca, calcium; Mg, magnesium; K, potassium.
Plant material
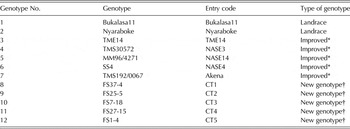
Twelve cassava genotypes (Table 2) were sourced from farmers' fields and from the Root Crops Programme at the National Crops Resources Research Institute, Namulonge in Uganda. Genotypes from farmers' fields were landraces, while genotypes from the Root Crops Programme were introductions from the International Institute of Tropical Agriculture (IITA) and/or genotypes developed by crossing cassava lines from CIAT with lines from Uganda. Selection of the genotypes was based on their performance for storage root yield, early bulking and relative degrees of field resistance to two viral diseases prevalent in Uganda: cassava brown streak disease (CBSD) and cassava mosaic disease (CMD).
Twelve cassava genotypes evaluated at three locations and assessed at five harvest dates in Uganda

* International Institute of Tropical Agriculture introductions.
† Genotypes developed by hybridizing lines from the International Centre for Tropical Agriculture with lines from Uganda.
Trial design
The trial at each location was laid out in a randomized complete block design with three replications. Disease-free stem cuttings (25 cm long) were horizontally planted in a flat seedbed at a spacing of 1 × 1 m giving a population density of 10 000 plants/ha. Each plot measured 5 × 12 m comprising six rows of 12 plants each. The first and last rows and the first and last plant within each row of each plot were considered as border plants. The plots and blocks were separated by 2 and 2·5 m alleys, respectively, to reduce inter-plot and inter-block plant competition. The trials were conducted without supplemental irrigation and weeded regularly.
Data collection
Sequential harvesting was conducted from 5 months after planting (MAP) to 13 MAP at intervals of 2 months. On each harvest date, data on the following traits were collected from four randomly selected and hand-harvested plants of each genotype per plot: SRN, storage root mass (SRM), storage root girth (SRG), shoot mass (STM), root dry mass content (DMC), HI, FSRY and cassava brown streak disease root necrosis (CBSD-RN). Cassava mosaic disease severity (CMD-S) was assessed once during crop growth at 6 MAP as most cassava genotypes expressed severe CMD symptoms at this time, and it is also the time when CMD assessment is usually performed in Uganda. The assessment was done on a scale of 1–5, where: 1, no symptoms; and 5, severe mosaic symptoms (IITA 1990). The SRG of the four biggest storage roots/plant of each genotype was determined as the circumference (cm) at the widest point of the mid-section of a storage root. Storage roots of the four plants were bulked, counted and weighed to obtain SRN and SRM (kg). The FSRY (t/ha) per genotype was then estimated from the SRM of the four-plant bulk of storage roots as:
 $${\rm FSRY} = \left( {{\rm SRM} \times {10000}} \right)/({4} \times {1000})$$
The STM (kg) was obtained by weighing the above-ground plant parts (stems and foliage).
Harvest index was calculated as the ratio of SRM to total biomass (TBM: mass of storage roots, stems and foliage):
 $${\rm HI} = {\rm SRM}/{\rm TBM}$$
Storage DMC was determined by randomly selecting three representative storage roots from each four-plant bulk of storage roots, which were washed, peeled and sliced using knives. Randomly selected slices were weighed to obtain a 0·1 kg fresh mass sample per genotype before being dried for 48 h in a forced-draught oven (Model LW-201C, Illinois, USA) at 80 °C. The dried samples were then reweighed to obtain the dry mass and DMC expressed as a proportion of the sample dry mass to fresh mass was calculated as:
 $${\rm DMC} = \left( {{\rm Dry \ mass}/{\rm Fresh}\,{\rm mass}} \right)$$
Since the main damage (necrosis) caused by CBSD is to the storage roots, CBSD-RN on storage roots of the genotypes was scored. Eight randomly selected storage roots of each genotype per plot at each harvest time were sliced and scored for CBSD-RN on a scale of 1–5; where: 1, no visible root necrosis, and 5, severe root necrosis (Hillocks et al. Reference Hillocks, Raya and Thresh1996).
Data analysis
All data were analysed using GenStat, version 14 (Payne et al. Reference Payne, Harding, Murray, Soutar, Baird, Glaser, Welham, Gilmour, Thompson and Webster2011). The data collected from each location were first subjected to analysis of variance (ANOVA) and then the error variances for the locations were tested for homogeneity using Hartley's Fmax test (Hartley Reference Hartley1950). The differences were not significant, thus an un-weighted, combined ANOVA across the three locations was conducted. Means were separated using least significance differences (LSD) at P < 0·05. The following mixed model, with genotype declared as fixed effects and locations and harvest time as random effects was used:
 $${P_{ijk}} = \mu + {G_i} + {T_j} + {L_k} + G{T_{ij}} + T{L_{\,jk}} + G{L_{ik}} + GT{L_{_{ijk}}} + {{\rm e}_{ijk}}$$
where P ijk , phenotypic value of genotype i harvested at time j and tested at location k; μ, population mean; G i , effect of the ith genotype; T j , effect of the jth harvest time; L k , effect of the kth location; GT ij , effect of the interaction between the ith genotype and the jth harvest time; TL jk , effect of the interaction between the jth harvest time and the kth location; GL ik , effect of the interaction between the ith genotype and the kth location; GTL ijk , effect of the interaction between ith genotype, jth harvest time and kth location; e ijk , random error term associated with genotype i at harvest time j in location k.
In order to estimate the variance components for the genotype, environment and genotype × environment interaction for each trait at each harvest time separately, the genotype and environment effects were considered random in the statistical model for each harvest time (Payne et al. Reference Payne, Harding, Murray, Soutar, Baird, Glaser, Welham, Gilmour, Thompson and Webster2011). The phenotypic variance component for each trait was obtained as the sum of the variance components for genotype, environment and genotype × environment interaction according to the following equation (Hallauer & Miranda Reference Hallauer and Miranda1981):
 $$\delta _{_{\rm P}} ^{\rm 2} = \delta _{\rm G}^{\rm 2} + \delta _{_{\rm E}} ^{\rm 2} + \delta _{{\rm G} \times {\rm E}}^{\rm 2} $$
where δ P 2, phenotypic variance component; δ G 2, genotypic variance component; δ E 2, environmental variance component; and δ G×E 2, genotype × environment variance component.
Broad sense heritability (H b) of each trait at each harvest time was calculated as the proportion of the phenotypic component of variance accounted for by the genotypic component of variance:
 $${H_{\rm b}} = \left( {\displaystyle{{\delta _{_{\rm G}} ^2} \over {\delta _{_{\rm G}} ^2 + \delta _{\rm E}^2 + \delta _{_{{\rm GxE}}} ^2}}} \right) \times 100$$
The phenotypic coefficient of variation (PCV%) and genotypic coefficient of variation (GCV%) were calculated according to Burton & DeVane (Reference Burton and DeVane1953) as:
 $${\rm PCV(\% )} = \left( {\sqrt {{{\rm \delta} ^{\rm 2}}_{\rm P}} {\rm /}\mathop {\rm x}\limits^{\rm \_}} \right){\rm} \times {\rm 100}$$
 $${\rm GCV(\% )} = \left( {\sqrt {\delta _{_G} ^{\rm 2}} {\rm /}\mathop {\rm x}\limits^{\rm \_}} \right){\rm} \times {\rm 100}$$
where
 $\overline {\rm x} $
= grand mean of the trait.
Pearson's phenotypic correlations between traits were performed for the genotypes averaged across five harvest times and three locations (Payne et al. Reference Payne, Harding, Murray, Soutar, Baird, Glaser, Welham, Gilmour, Thompson and Webster2011).
RESULTS
Variability of traits across harvest time and location
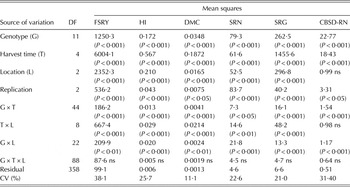
The genotype and harvest time mean squares (MS) in the combined ANOVA were highly significant (P < 0·001) for all traits (Table 3). Location MS were highly significant (P < 0·001) for all traits, except CBSD-RN which was not significant. Replication MS were highly significant (P < 0·001) for all traits except DMC and CBSD-RN (P < 0·05). Genotype × harvest time MS were highly significant (P < 0·001) for all traits, except SRN (P < 0·05). Harvest time × location MS were highly significant (P < 0·001) for FSRY, HI, DMC and SRG and very significant (P < 0·01) for SRN. Genotype × location MS were highly significant (P < 0·001) for HI, SRN, SRG and CBSD-RN, and very significant (P < 0·01) for FSRY and DMC. Genotype × harvest time × location MS were non-significant for all traits and therefore are not discussed further. Coefficients of variation ranged from 11·1% for DMC to 38·1% for FSRY.
Combined analysis of variance for six traits of 12 cassava genotypes evaluated at three locations and assessed at five harvest times in Uganda

DF, degrees of freedom; FSRY, fresh storage root yield (t/ha); HI, harvest index; DMC, dry mass content; SRN, storage root number/plant; SRG, storage root girth (cm); CBSD-RN, cassava brown streak disease root necrosis scored on a scale of 1–5; L, location; G, genotype; T, harvest time; CV, coefficient of variation (%); ns, non-significant.
The data for CMD-S were analysed separately to those for the other traits, as the trials were scored for CMD-S only once at 6 MAP. In the ANOVA for CMD-S (data not shown), the genotype MS were highly significant (P < 0·001), the location MS were significant (P < 0·05), and genotype × location MS were very significant (P < 0·01).
Performance of genotypes in response to harvest time
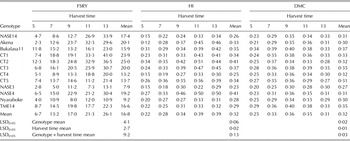
Averaged across harvest times, FSRY ranged from 7·9 t/ha in NASE3 to 25·0 t/ha in CT2, with an overall mean of 16·8 t/ha (Tables 4 and 5). Mean FSRY across genotypes was the lowest (6·7 t/ha) at 5 MAP and the highest (26·1 t/ha) at 13 MAP. The lowest mean FSRY (2·8 t/ha) was recorded for NASE3 at 5 MAP and the highest (41·0 t/ha) was recorded for CT1 at 13 MAP.
Mean performance of 12 cassava genotypes for FSRY, HI and DMC at five harvest times averaged across three locations in Uganda

FSRY, fresh storage root yield (t/ha); HI, harvest index; DMC, dry mass content; LSD0·05, least significant difference at P < 0·05.
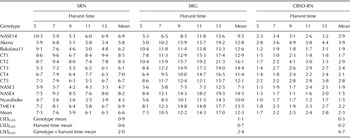
Mean performance of 12 cassava genotypes for SRN, SRG and CBSD-RN at five harvest times averaged across three locations in Uganda

SRN, storage root number/plant; SRG, storage root girth (cm); CBSD-RN, cassava brown streak disease root necrosis scored on a scale of 1–5; LSD0·05, least significant difference at P < 0·05.
Mean HI across harvest times was the highest (0·41) for genotypes CT2 and NASE4 and the lowest (0·23) for NASE3. Averaged across genotypes, mean HI was the highest (0·39) at both 11 and 13 MAP and the lowest (0·22) at 5 MAP. The lowest mean HI (0·12) was recorded for Akena at 5 MAP and the highest (0·51) for CT2 at 11 MAP. Most genotypes, viz. CT1, CT2, CT3, CT4, Nyaraboke and TME14 attained the highest mean HI at 11 MAP.
Across harvest times, the highest mean DMC (0·37) was recorded by genotype Bukalasa11 and the lowest (0·27) by NASE3. Across genotypes, the highest mean DMC (0·36) was recorded when plants were harvested at 9 MAP and the lowest (0·25) was recorded when plants were harvested at 5 MAP. The lowest mean DMC (0·20) was recorded for NASE3 at 5 MAP and the highest (0·40) for Bukalasa11 and TME14 at 9 MAP. Most genotypes recorded the highest mean DMC at ⩽9 MAP. For instance, CT2 recorded the highest mean DMC at 7 MAP and NASE14, Bukalasa11, CT1, CT4, CT5, NASE3, NASE4, Nyaraboke and TME14 at 9 MAP. For some genotypes the difference between mean DMC at 7 and 9 MAP was not significant.
Across harvest times, mean SRN ranged from 4·3 in Nyaraboke to 8·5 in CT1, whereas across genotypes mean SRN ranged from 5·9 at 9 MAP to 7·6 at 7 MAP. The highest mean SRN (10·3) was recorded for NASE14 at 5 MAP and the lowest (3·3) for NASE3 at 13 MAP.
Mean SRG across harvest times was the highest (16·1 cm) for genotype CT2 and the lowest (7·3 cm) for NASE3. Across genotypes, the lowest mean SRG (7·3 cm) was recorded at 5 MAP and the highest (17·0 cm) was recorded at 13 MAP. Genotypes NASE3 and CT2 had the lowest and highest SRG means, respectively at all harvest times.
The worst CBSD-RN mean score (3·9) across harvest times was recorded by Akena and the best (1·5) by NASE4 and Nyaraboke. The highest CBSD-RN mean score (2·8) across genotypes was recorded at 13 MAP and the lowest (1·7) at 5 MAP. Throughout the assessment period, Akena had the highest CBSD-RN mean scores. The lowest mean CBSD-RN score for Nyaraboke was recorded at 5, 11 and 13 MAP, while those for CT1 and NASE4 were at 7 and 9 MAP, respectively.
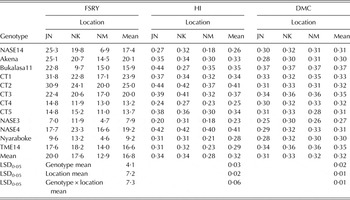
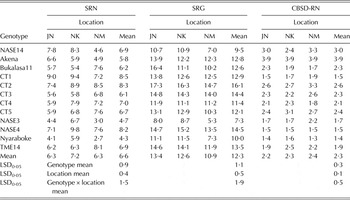
Performance of genotypes in response to location
Genotype mean performance for FSRY was the lowest (4·6 t/ha) for Nyaraboke at Namulonge, but the highest (31·8 t/ha) for CT1 at Jinja (Tables 6 and 7). Mean HI was the lowest (0·18) for both NASE3 and NASE14 at Namulonge, but the highest (0·44) for both Bukalasa11 and CT2 at Jinja. Mean DMC ranged from as low as 0·25 for NASE3 at Jinja to as high as 0·37 for Bukalasa11 at all sites. The lowest mean performance for SRG (5·3 cm) was recorded by NASE3 at Namulonge and the highest (17·3 cm) by CT2 at Jinja. The CBSD-RN mean scores ranged from a low of 1·3 for Nyaraboke at Namulonge to a high of 3·9 for Akena at all locations. The highest CMD-S mean score (3·6) was recorded for Bukalasa11 and Nyaraboke while the lowest (1·0) was recorded for NASE14, Akena, CT1, CT2, CT3, CT4, CT5 and TME14 (data not shown). With respect to location, the highest CMD-S mean score (1·7) was recorded at Namulonge and the lowest (1·3) at Jinja (data not shown).
Mean performance of 12 cassava genotypes for FSRY, HI and DMC at three locations in Uganda averaged across five harvest times

FSRY, fresh storage root yield (t/ha); HI, harvest index; DMC, dry mass content; JN, Jinja; NK, Nakasongola; NM ,Namulonge; LSD0·05, least significant difference at P < 0·05.
Mean performance of 12 cassava genotypes for SRN, SRG and CBSD-RN at three locations in Uganda averaged across five harvest times

SRN, storage root number/plant; SRG, storage root girth (cm); CBSD-RN, cassava brown streak disease root necrosis scored on a scale of 1–5; JN, Jinja; NK, Nakasongola; NM, Namulonge; LSD0·05, least significant difference at P < 0·05.
Estimates of phenotypic, genotypic and environmental variance components
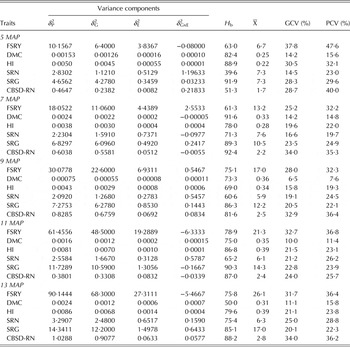
Variance components for genotype, environment and genotype × environment interaction were determined for each harvest date separately. The variance component for genotypes at all five harvest times was higher for all traits than that for environment and genotype × environment interaction (Table 8). Similarly, for all traits, a large percentage of the phenotypic component of variance was accounted for by the genotypic component of variance as reflected by H b being >50·0% for all traits at all harvest times, except for SRN at 5 MAP (H b = 39·6%). The H b estimates for all traits at all harvests times were relatively high. The lowest H b estimates at 5 MAP (H b = 39·6%), 9 MAP (H b = 60·6%) and 11 MAP (H b = 65·2%) were recorded by SRN; at 7 MAP (H b = 61·3%) by FSRY; and at 13 MAP (Hb = 50·0%) by DMC. The highest Hb estimates at 5 MAP (H b = 91·9%), 9 MAP (H b = 86·3%) and 11 MAP (H b = 90·3%) were recorded by SRG; and at 7 MAP (H b = 92·4%) and 13 MAP (H b = 88·2%) by CBSD-RN. The highest GCV and PCV at 5 and 11 MAP were recorded by FSRY, whereas at 7 and 9 MAP were recorded by CBSD-RN. At 13 MAP, CBSD-RN and FSRY recorded the highest GCV and PCV, respectively. The lowest GCV and PCV were recorded by DMC at all harvest times.
Estimates of variance components and broad sense heritability for six traits for 12 cassava genotypes evaluated at three locations on five separate harvest times in Uganda

δ
2, variance component; G, genotype; E, environment; P, phenotype; H
b, broad sense heritability (%);
 $\overline {\rm X} $
, grand mean of the trait; GCV, genotypic coefficient of variation (%); PCV, phenotypic coefficient of variation (%); MAP, months after planting; FSRY, fresh storage root yield (t/ha); DMC, dry mass content; HI, harvest index; SRN, storage root number/plant; SRG, storage root girth (cm); CBSD-RN, cassava brown streak root necrosis scored on a scale of 1–5.
Phenotypic correlations among traits
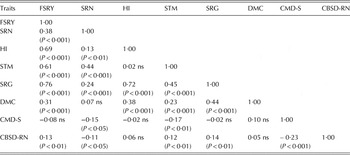
Most of the agronomic traits were significantly and positively correlated with one another, whereas resistance to CMD and CBSD traits were not (Table 9). Fresh storage root yield was highly significantly (P < 0·001), positively correlated with SRG, HI, STM, SRN and DMC and very significantly (P < 0·01), positively correlated with CBSD-RN. Of these significant correlations with FSRY, SRG had the highest correlation (r = 0·76), followed by HI (r = 0·69). The CBSD-RN was highly significantly (P < 0·001), negatively correlated with CMD-S and very significantly (P < 0·01), positively correlated with FSRY, STM and SRG; and significantly (P < 0·05), negatively correlated with SRN. The CMD-S had a significant (P < 0·05), negative correlation with SRN and also a negative, but not significant correlation with FSRY, HI and SRG. Harvest index had a highly significant (P < 0·001), positive correlation with FSRY, SRG and a very significant (P < 0·01), positive correlation with SRN. Shoot mass was highly significantly (P < 0·001), positively correlated with FSRY, SRN, SRG and DMC; very significantly (P < 0·01), positively correlated with CBSD-RN but negatively correlated with CMD-S.
Phenotypic correlations between eight traits of 12 cassava genotypes averaged across harvest times and locations in Uganda

FSRY, fresh storage root yield (t/ha); SRN, storage root number; HI, harvest index; STM, shoot mass (kg/plant); SRG, storage root girth (cm); DMC, dry mass content; CMD-S, cassava mosaic disease root necrosis scored on scale of 1–5; CBSD-RN, cassava brown streak disease root necrosis scored on scale of 1–5; ns, non-significant.
DISCUSSION
The main objective of the current research was to assess the extent of variation among cassava genotypes for the rate of storage root bulking and other traits of relevance. The information generated would guide future improvement programmes for high storage root yielding, early-bulking cassava cultivars in association with other important traits, as well as in identifying research gaps in the quantification and understanding of the existing variation in cassava genotypes in Uganda.
The traits evaluated to meet the stated objectives of this research were FSRY, STM, HI, DMC, SRN, SRG, CBSD-RN and CMD-S. For most of these traits in the combined ANOVA across harvest times and locations, the main effects (location, genotype and harvest time) and the two-way interaction effects were significant. Genotype MS were significant for all traits, indicating that the genotypes evaluated were significantly different, and that by hybridizing among them, genetic advance would be achieved for all the traits. Similarly, the significant MS for location for all traits, except for CBSD-RN, indicated that the locations were different from each other and consequently had significant influence on the performance of the genotypes for various traits. The significant differences among harvest times for all the traits evaluated were a clear indication of significant differences in the growth and development of the test genotypes over time. Similar results were reported by Suja et al. (Reference Suja, John, Sreekumar and Srinivas2010) when evaluating short-duration cassava genotypes for growth dynamics, biomass, yield and quality. Likewise, a study by Ngeve (Reference Ngeve2003) to determine the effect of harvest time and test environments on cassava storage root yield and culinary qualities found significant differences among genotypes and locations for FSRY and SRN.
Significant genotype × location interaction effects for the traits assessed indicated that some of the genotypes had specific adaptation to one or more of the locations, while the significant genotype × harvest time interaction effects were indicative of differences in patterns of bulking rates among the genotypes as previously reported by Okechukwu & Dixon (Reference Okechukwu and Dixon2009), Suja et al. (Reference Suja, John, Sreekumar and Srinivas2010) and Kamau et al. (Reference Kamau, Melis, Laing, Derera, Shanahan and Ngugi2011). In addition, significant harvest time × location interaction effects indicated that the performance patterns for each trait across the harvest times differed between the locations and therefore the optimal time of expression for each trait (in MAP) was location-specific.
Jinja registered the best performance for HI, FSRY, SRG, CBSD-RN and CMD-S averaged across genotypes and harvest times. Nakasongola recorded the best performance for DMC and SRN. Namulonge, on the other hand, recorded the lowest performance for all the traits evaluated. This was possibly due to the highest severity of CMD and CBSD and also high incidences of whitefly (Bemisia tabaci) recorded at this location compared to the other two (Jinja and Nakasongola), which undoubtedly contributed to the reduced performance of the genotypes for the evaluated traits. The good performance of genotypes for the traits mentioned at Jinja could be attributed to high rainfall (1324 mm) during the experimental period. Even though Nakasongola received the lowest amount of rainfall (790 mm) during the experimental period, it performed better than Namulonge for all the traits, and better than Jinja for DMC and SRN, possibly due to having more fertile soils and less viral diseases.
As expected, performance for FSRY was the lowest when plants were harvested at 5 MAP and generally higher at each subsequent harvest time, a trend that in part reflects the dynamics in cassava growth and development (Lahai et al. Reference Lahai, George and Ekanayake1999), and dry mass accumulation in the roots as affected by source-sink relations (Lahai & Ekanayake Reference Lahai and Ekanayake2009). Cassava established from stem cuttings grows through phases: the vegetative phase characterized by rapid growth of stems and foliage; the root bulking phase characterized by rapid growth of storage roots; and the senescence phase (Ekanayake et al. Reference Ekanayake, Osiru and Porto1998). At every phase of cassava's growth and development, dry mass production and partitioning between plant organs occurs, although the rate differs during the growth stages of the plant and is also cultivar-dependent. Partitioning of dry mass is particularly important in cassava because the crop has simultaneous development of leaves, stems and storage roots and thus the available assimilate is partitioned between these plant parts (El-Sharkawy Reference El-Sharkawy2004). The distribution pattern of photo-assimilates among different organs of the cassava plant changes markedly during the growth cycle, with shoots dominating in the first 3–5 MAP, while the storage roots become the major sink for assimilates during the rest of the growth cycle (El-Sharkawy Reference El-Sharkawy2004). Root bulking in the present study was gradual in the first 7 months, with most of the bulking in terms of FSRY for the majority of the cultivars having taken place by 9 MAP, irrespective of locations.
Genotypes had significant differences in time taken to attain peak FSRY, with some genotypes obtaining peak FSRY at two harvest dates, for example Bukalasa11 at 7 and 13 MAP; and CT5, NASE4, TME14 and NASE3 at 9 and 13 MAP. The two peaks for FSRY exhibited by most genotypes indicated that the first and second phases of storage root bulking usually occur from 3 to 9 MAP and from 13 MAP and onwards as reported in previous studies (Ekanayake et al. Reference Ekanayake, Osiru and Porto1998). The first storage root bulking phase is when storage roots begin to enlarge and the leaf area reaches a maximum, while the second storage root bulking phase is when storage roots are the dominant sink (Ekanayake et al. Reference Ekanayake, Osiru and Porto1998). Since the performance for each genotype was different at each location and at each harvest time, the clear implication for selection is that the optimal harvest times for early storage root bulking are location-dependent.
There was a steady increase in storage root DMC for most genotypes from 5 to 9 MAP. However, beyond this time >0·83 of the genotypes evaluated showed a decline in storage root DMC, which coincided with the first season rains of March to May and the resumption of vegetative growth. This is in agreement with Kawano et al. (Reference Kawano, Fukuda and Cenpukdee1987), who postulated that the resumption of growth in cassava after the dry season could be the main reason for the low root DMC at the beginning of a wet season as the stored assimilates are used up for growth of vegetative parts. It is, therefore, advisable that cassava should be harvested in the dry season or just at the onset of rains to maximize storage root DMC.
Estimates of variance components revealed that a large portion of the phenotypic variance was accounted for by the genotypic component for all traits, indicative of the existence of considerable genetic variation among the 12 genotypes that was unaffected by the additive and non-additive influence of the environment. The implication is that with conventional hybridization among these genotypes, substantial genetic advance would be achieved for all traits. The PCV estimates for all traits were higher than the GCV estimates (also reported by Akinwale et al. Reference Akinwale, Akinyele, Dixon and Odiyi2010; Ntawuruhunga & Dixon Reference Ntawuruhunga and Dixon2010), signifying that the overall variation for the traits was not only genetically determined, but was also due to environmental effects. However, the difference between PCV and GCV for all traits was relatively low, indicative of low environmental influence.
All traits at almost all harvest times had high H b estimates, implying that broad-sense genetic gains would be obtained based on phenotypic selection at each of the harvest times for these traits. Similarly, the high H b estimates observed for all traits at almost all harvest times suggested that the heritable portion of phenotypic variation was large for these traits at each harvest time which could be readily exploited by plant breeders. The implication of high H b is that rapid progress in selection should be achievable, even using simple selection procedures. The low to medium H b estimate recorded for FSRY and SRN at almost all harvest times, and DMC at 13 MAP indicated that the expression of these traits was strongly influenced by the environment, suggesting that direct phenotypic-based selection for these traits would probably be ineffective.
Phenotypic correlation analysis revealed that the other agronomic traits were positively and highly correlated with FSRY, indicative of their interdependence and importance in influencing FSRY. The high positive correlations between FSRY and HI, SRG and SRN agreed with those reported by Suja et al. (Reference Suja, John, Sreekumar and Srinivas2010), Okechukwu & Dixon (Reference Okechukwu and Dixon2009) and Parkes et al. (Reference Parkes, Fregene, Dixon, Boakye-Peprah and Labuschagne2013). Cassava mosaic disease severity had a negative correlation with all the yield-related traits, demonstrating the devastating effects of CMD on cassava productivity.
CONCLUSION
There was high genetic variability among test genotypes for FSRY and all other traits evaluated, indicating that significant progress would be achieved in the selection for these traits, even with simple phenotypic selection procedures. Similarly, with conventional hybridization among these genotypes, substantial genetic advance would be achieved for all the traits. Time to attain peak FSRY and the other traits differed from genotype to genotype and from location to location, with CT1 recording the highest mean FSRY of 41·0 t/ha at 13 MAP across locations. However, harvesting at 9 MAP is recommended for the early bulking genotypes assessed in the present study based on their attained FSRY. The average FSRY of most cassava genotypes when harvested at ⩾12 MAP in Uganda is c. 12 t/ha (FAO 2012); however, in the present study, all the genotypes evaluated except Nyaraboke and NASE3 produced >12 t/ha at 9 MAP. Therefore, for the production of FSRY, all the genotypes evaluated, except Nyaraboke and NASE3 could be selected as early bulking cultivars at 9 MAP. In addition, based on DMC accumulated in different genotypes at different harvest times, harvesting at 9 MAP is recommended for NASE14, Bukalasa11, CT1, CT4, CT5, NASE3, NASE4, Nyaraboke and TME14 as this was the time when most genotypes had peak storage root DMC.
Moreover, there was no significant difference in FSRY from 9 to 13 MAP at Nakasongola averaged across genotypes, suggesting that there was no further yield to be gained from leaving the storage roots underground for any longer than 9 MAP. Farmers will be guided by a number of considerations in deciding whether or not to adopt early bulking cultivars into their farming systems. A better market price for early harvested storage roots could be an advantage of early bulking cultivars. In addition, the opportunity cost of land in planting late versus early bulking cultivars could be a major deciding factor. Early bulking cultivars occupy farmland for a shorter period of time (Tumuhimbise et al. Reference Tumuhimbise, Melis, Shanahan and Kawuki2012) and so farmers could utilize the land harvested of cassava for the production of other crops.
The research was financially supported by the Alliance for a Green Revolution in Africa through the African Centre for Crop Improvement under the directorship of Professor Mark Laing. The staff of the Root Crops Programme at the National Crops Resources Research Institute and the National Forestry Resources Research Institute, National Agricultural Research Organization, Uganda provided logistical and partly helped with data collection.