


1. Introduction
The Larsen A and B ice shelves, Antarctic Peninsula, fragmented into masses of closely packed icebergs with a rapidity rarely witnessed in the glaciological world (Reference Rott, Skvarca and NaglerRott and others, 1996; Reference Vaughan and DoakeVaughan and Doake, 1996). The underlying cause for these events appears to be recent climate warming (Reference Vaughan and DoakeVaughan and Doake, 1996; Reference Doake, Corr, Rott, Skvarca and YoungDoake and others, 1998; Reference Rott, Rack, Nagler and SkvarcaRott and others, 1998; Reference Skvarca, Rack, Rott and Ibarzábal y DonángeloSkvarca and others, 1998) and associated surface meltwater accumulation, both immediately prior to break-up and in prior-year melt seasons. This accumulation is thought to trigger initial fragmentation of the ice shelf (Reference Scambos, Hulbe, Fahnestock and BohlanderScambos and others, 2000, in press) by downward growth of water-filled surface crevasses (e.g. Reference Morland, Van der Veen and OerlemansVan der Veen, 1998). Reference Doake, Corr, Rott, Skvarca and YoungDoake and others (1998; see also Reference Rack, Doake, Rott, Siegel and SkvarcaRack and others, 2000) suggest an alternative mechanism leading to ice-shelf disintegration involving, among other features, the geometry of the ice front. They suggest that a necessary condition for break-up is met when normal slow-style calving at the ice front causes its geometry to bow inward toward the interior of the ice shelf (when viewed from above). Once the ice front is bowed inward, the stress regime of the ice shelf becomes more favorable for disaggregation.Whatever the triggering mechanism may be, however, the process responsible for sustaining the ultimate, catastrophic break-up of the ice shelves is not known.
The widely recognized influence of meltwater filling on vertical-crevasse propagation (e.g. as described by Reference WeertmanWeertman, 1973; Reference HughesHughes, 1983; Reference Morland, Van der Veen and OerlemansVan der Veen, 1998) and the very good correlation between melt-pond occurrence and ice-shelf break-up leads us to prefer meltwater accumulation as the proximal cause of the break-up of the two ice shelves. What the meltwater hypothesis cannot explain, however, is the rapidity with which the rifted shelves expanded across the ocean surface. For that, a secondary process, perhaps triggered by meltwater, must ensue to rapidly disaggregate the fractured shelf. In this paper, we propose such a process: one that involves the considerable potential energy released when numerous ice-shelf fragments capsize in a coherent manner.
1.1. Larsen A and Larsen B ice shelves
In late January 1995, the last remnant of Larsen A Ice Shelf, which had been shrinking since at least the mid-1970s, disintegrated in the span of only a few days. This catastrophic disintegration of the ≈1200 km2 ice shelf was captured in a series of European Remote-sensing Satellite (ERS-1) synthetic-aperture radar (SAR) images (Reference Rott, Skvarca and NaglerRott and others, 1996). These images showed a mixture of small, kilometer-scale tabular icebergs and radar-bright masses of smaller ice-shelf fragments rapidly expanding from the retreating front edge of the remaining integrated ice shelf. In some cases icebergs moved 40 km in just 2 days. The plume of small tabular icebergs and smaller fragments then slowly drifted northeastwards over the following month.
This disintegration pattern was repeated on an even larger scale in the 2002 break-up of Larsen B Ice Shelf. Satellite images constrain most of the 3370 km2 ice-shelf break-up to 23 February–7 March, with post-disintegration iceberg-drift rates similar to drift following the Larsen A event. Further, true color images retrieved during the break-up by the Moderate Resolution Imaging Spectrometer (MODIS), on the U.S. Terra satellite platform, indicated that the interstitial sub-pixel-size ice-shelf fragments were a brilliant blue, typical of exposed, deep glacial ice. Gray-scale versions of three MODIS images of the ice shelf, including one which displays the sub-pixel fragments, are provided in Figure 1. In both the Larsen A and B cases, the break-up followed unusual summer warmth and extensive melting; in the case of the 2002 break-up, the warmest summer ever recorded in the region (e.g. Reference Skvarca, Rack, Rott and Ibarzábal y DonángeloSkvarca and others, 1998; personal communication from P. Skvarca, 2002).
MODIS images of Larsen B Ice Shelf on (a) 22 November 2001, (b) 23 February 2002 and (c) 7 March 2002. (d) Location map and area of ice-shelf break-up. All images portray the region as seen in visible light (MODIS bands 1-4-3) subsequently converted to gray-scale. To better portray debris streaks (medial moraines), visible in color versions of the post-break-up image (c), we individually selected pixels in the original color image that displayed the color of debris-laden ice.These pixels are colored black in this gray-scale image.The original color images can be seen at the NSIDC website (http://nsidc.org/iceshelves).

1.2. Proposed mechanism
To explain the rapidity and extent of disintegration and the post-break-up arrangement of ice-shelf fragments, we propose a mechanism inwhichthe break-up of the heavily rifted ice is powered by gravitational potential energy released when a fraction of ice-shelf fragments capsize in a coherent fashion once they become separated from the surrounding ice shelf. To produce a force that tends to expand the area covered by ice-shelf fragments, narrow fragments are presumed to roll about an axis that is perpendicular to the prebreak-up along-flow direction. The rolling can be by tipping forward or tipping backward, as either will be seen to imply a wedging force. A corollary to our proposition is that the ice-shelf fragments that capsize are gravitationally unstable when upright.This condition, plus the requirement that capsize be by rolling in the along-flow direction, implies that the population of ice-shelf fragments that capsize must initially be narrower in the along-flow direction than they are thick. This implies a pre-break-up population of rifts with 200 m or less spacing oriented parallel to the ice front. Additionally, we speculate that the potential energy released when a size-able fraction of ice-shelf fragments capsize can induce horizontal rift propagation elsewhere on the ice shelf. Schematic diagrams illustrating the proposed capsize mechanism are shown in Figures 2 and 3.
Sequence representing the capsize of an idealized rectangular ice-shelf fragment; from (a) initial orientation to (c) final orientation. Debris-laden ice indicated by stipple pattern.

Schematic view of a hypothesized runaway instability. (a) The initial condition, where surface crevasses and throughcutting rifts are numerous and closely spaced. (b) Narrow, free-floating fragments within some rifts, which begin to capsize creating wedging force, while discrete shelf segments, between rifts, experience compression due to the forces resisting capsize (fine arrows).The stress experienced by the bulk mixture of fragments and intervening rift space is tensile (bold arrow).The effect of the integrated tensile stress in the middle of the ice shelf is to expand the seaward extent of the shelf (white arrows in the inset) and to enhance shearstresses at the edges of theexpanding region (black arrows in the inset). (c) The peak of thebreak-up event, where a chaotic mass of icebergs spreads seaward (bold arrow) at a rate determined by fragment interactions. (d) Terminal condition, in which numerous icebergs cover the sea surface and a significant fraction of the icebergs have capsized.

2. Motivating Observations
Three categories of observation motivate us to propose the capsize mechanism:
-
(1) the post-break-up texture of ice debris littering the ocean surface (including the sudden appearance of what had been internal debris-laden ice bands prior to break-up);
-
(2) the pre-break-up texture of surface crevasses and melt-water ponds; and
-
(3) the kinematics of ice-shelf-fragment movement immediately following the onset of break-up.
The observations are introduced in Figures 1, 4 and 5. As introduced above, Figure 1 displays imagery of Larsen B Ice Shelf acquired by the MODIS at three times during the break-up process. Figure 1a shows Larsen B Ice Shelf on 22 November 2001, just prior to the onset of the surface-melting season and several months before the start of break-up. Figure 1b shows the ice shelf on 23 February 2002, several days prior to the sudden disintegration of the ice shelf. Notable in this image are the surface meltwater ponds (dark patches) identified by Reference Scambos, Hulbe, Fahnestock and BohlanderScambos and others (2000, in press) as a mechanism for triggering ice-shelf fragmentation. Figure 1c shows the condition of the ice shelf on 7 March 2002, immediately following its catastrophic disintegration. An enlarged view of the surface-crevasse and meltwater-pond texture of the ice-shelf surface prior to its disintegration is provided by a Landsat 7 image (panchromatic band) acquired on 21 February 2000 (Fig. 4). Figure 5 refers schematically to our analysis of the horizontal motion of the ice-shelf fragments as they advanced eastward across the ocean surface during the ice-shelf disintegration. This analysis was done by examining time series of MODIS images including those shown in Figure 1.
Landsat 7 image (panchromatic, converted to gray-scale) of Larsen B Ice Shelf (for location see Fig. 1d) from 21 February 2000 showing surface texture, crevasses and meltwater ponds (dark patches and lineations) at the end of the summer melt season. Image area is 37.5 km × 30 km (2500 × 2000 15 m pixels), black square in inset represents a 200 m × 200 m patch of surface area.

Example of a closed contour stretched by the divergent flow associated with the break-up of Larsen B Ice Shelf; (a) initial configuration of ice shelf and contour and (b) configuration after break-up.

2.1. Post-break-up texture of ice-shelf debris
The imagery in Figure 1 provides two points of evidence in support of our proposal. First, much of the sea surface following break-up is covered by ice-shelf fragments that have horizontal dimensions less than the 250 m resolution of the MODIS imagery. We shall argue below that ice-shelf fragments must initially have at least one horizontal dimension shorter than the ice thickness to be unstable to capsize. Second, debris-laden ice streaks (medial moraines), composed of initially englacial debris, invisible immediately prior to break-up, suddenly become visible following break-up. We shall argue that their sudden appearance implies that some fraction of ice-shelf fragments have rolled onto their sides to expose former englacial material to view from above.
Following the break-up of Larsen B Ice Shelf (Fig. 1c), a large fraction of the sea surface in the bay formerly occupied by the shelf is covered by a dense matrix of fragments that are too small to be resolved by the MODIS imager. In color imagery the dense matrix appears light blue (National Snow and Ice Data Center (NSIDC); http://nsidc.org/ice-shelves). This covering matrix of small ice-shelf fragments is confirmed by aerial photographs taken during the event (personal communication from P. Skvarca, 2002). Although some textural variations are visible, individual pieces cannot be distinguished in the covering matrix, and are thus smaller than the 250 m pixel resolution of the MODIS sensor. Tabular icebergs that exceed the 250 m scale are easily identified by their bright white surfaces and well-defined boundaries.These large, uncapsized fragments are common near the front of the expanding, disintegrated ice mass. Behind that front, blue, below-pixel-size, ice-shelf fragments are the predominant sea-surface material. It is not possible for melting to have caused initially uncapsized fragments to rotate during or immediately following break-up. Thus, we infer that capsize of narrow ice-shelf fragments must have been an important process during the break-up event.
What clinches this possibility is the sudden appearance of debris-laden ice streaks (medial moraines) in the post-break-up image (Fig. 1c). Sudden exposure of the debris-laden ice is likely the result of iceberg capsize, which would expose the sides of the bergs (the interior of the shelf) to view from above (Fig. 2).
2.2. Pre-break-up surface texture
As shall be shown in the following section, in which the geometric conditions for capsize instability are reviewed, ice-shelf fragments that capsize by rolling toward (or away from) the along-flow direction relative to the pre-break-up ice-shelf flow must be narrower in this direction than they are thick. The thickness of the ice shelf inferred from satellite altimetry (Reference Bamber and BindschadlerBamber and Bindschadler, 1997) prior to break-up was 200–220 m. This requirement implies that the mechanism that initially triggered ice-shelf fragmentation must have created a population of through-cutting rifts that had a significant fraction characterized by separation of < 200–220 m.
The Landsat 7 image in Figure 4 is of a 37.5 km × 30 km patch in the central region of Larsen B Ice Shelf on 21 February 2000, just at the end of the summer melt season 2 years before the ice shelf disintegrated. The pixel resolution of this image is 15 m. Three aspects of the surface texture support the notion that a fraction of the ice shelf broke into unstable fragments that were liable to capsize in the along-flow direction (relative to the pre-break-up flow field, i.e. upper left toward lower right in Fig. 4). First, the surface crevasses dissect the ice shelf into fragments that are several times wider in the across-flow direction than in the along-flow direction. Capsize by tilting in the along-flow direction is thus more likely than by tilting in the across-flow direction. Second, surface crevasses and meltwater-filled depressions that may indicate underlying crevasses suggest a number of fragments are < 200 m across. Also, in the Landsat image (Fig. 4) only the largest surface crevasses, > 15 m wide, are seen. Narrower crevasses, invisible in the Landsat image, may further dissect the surface and create additional smaller ice-shelf fragments. Third, meltwater ponding is irregular. This suggests that the ice-shelf surface is subject to irregularly distributed surface loads that may initially tilt ice-shelf fragments to the point where capsize becomes inevitable once the fragments are detached from their surroundings.
2.3. Large-scale kinematics
Over the course of the approximately 7 day break-up of Larsen B Ice Shelf, the area covered by the post-break-up aggregate of ice-shelf fragments grew to approximately 3.6 times the area covered by the intact ice shelf. While cloud cover and other factors limit the number of observations during this period, the iceberg mass appears to have expanded eastward in a nearly laminar fashion. This is perhaps best indicated by the degree to which the debris-laden ice (Fig. 1c) remains largely linear despite severe fragmentation of the ice shelf. We argue that a laminar flow of this nature cannot be driven primarily by ocean currents or atmospheric winds, because vorticity conservation associated with ocean- or wind-driven currents would have produced eddy-like distortions to the arrangement of ice-shelf fragments and debris streaks. In our view, the mechanism most likely to produce a laminar expansion is capsize, in the short-axis direction (toward the shelf front), of a large population of ice-shelf fragments. In such a scenario, the capsize of narrow fragments by along-flow tilting, i.e. so that the capsized fragments float approximately end-to-end, covering more surface area, will force the surface area of the post-break-up aggregate of ice-shelf fragments to expand. By virtue of the high density of ice-shelf fragments, the movement forced by the capsize of a sub-population of these fragments will remain dissipative, i.e. friction of fragment-to-fragment contact will dissipate eddy-like motions induced by conservation of vorticity.
To support this point, we make reference to the process of planetary vorticity induction associated with inviscid, barotropic oceanic flows, as described by Reference PedloskyPedlosky (1979, sections 2.1–2.3). This process describes how changes in the circulation about closed loops contained in the horizontal plane can be modified by expanding flows.
For example, if Γ is the circulation directed about a closed loop represented by contour C contained on the surface of an inviscid ocean of constant density, then by definition

where the vectors u and dr are the fluid velocity in a reference frame that is fixed on Earth’s surface and the directed differential element of the contour, respectively, as shown in Figure 5. Kelvin’s theorem (Reference PedloskyPedlosky, 1979, section 2.3) states,

where A is the area of a horizontal surface girdled by the contour C, f = 2 Ω sin φ is the Coriolis parameter, Ω is the angular velocity of the Earth’s rotation, and φ is the latitude. If prior to the ice-shelf break-up event, u = 0, then Γ = 0 at the beginning of the ice-shelf break-up. As the ice shelf disintegrates, the iceberg mass expands horizontally, and the contour C on which the circulation Γ is defined will expand, enclosing more surface area. It follows from Equation (2) that ∂A/∂t > 0 (e.g. as shown in Fig. 5b) and,

Circulation is thus induced around C as the area enclosed by C expands. Given the expansion of ice-covered surface area cited above (a factor of 3.6), a counter-clockwise circulation should be seen within the mass of post-break-up icebergs. Evidence from satellite imagery shows no such circulation and this implies that the iceberg mass is strongly constrained by dissipative forces. This implication makes our point: the explosiveness of the ice-shelf disaggregation is not consistent with oceanic or atmospheric flow.
3. Static Analysis of Ice-Shelf-Fragment Capsize
Based on the above observational motivation, we explore the mechanics of ice-shelf-fragment capsize in an effort to understand its possible applicability to the break-up of Larsen A and B ice shelves. Our analysis is exploratory, so we examine an idealized ice-shelf fragment confined within a single ice-shelf rift located on the ice-shelf center line where effects of gradients transverse to the direction of capsize are least likely to be significant. The fragment capsizes by rolling 90° in the seaward direction, i.e. in the direction towards which ice must ultimately move to release gravitational potential energy in the ice–sea-water system. The idealized fragment is considered to be much longer in the across-flow (transverse) direction than in the along-flow (seaward) direction, thus we restrict our analysis to two dimensions. Two-dimensionality allows a simple analysis, but fails to permit examination of important details, such as how capsizing ice fragments transmit forces laterally to their surroundings by twisting against the ice shelf at their two ends. We accept the restrictions imposed by a two-dimensional analysis for the present study to better focus on the predictions of a simple theory.
Our analysis is similar to iceberg-stability analyses undertaken previously by Reference BassBass (1980) and Reference Nye and PotterNye and Potter (1980), and modestly extends these previous studies by examining forces of contact generated between the ice-shelf fragment and the surrounding ice shelf. In other words, we calculate the wedging force generated by the capsizing ice-shelf fragment that tends to expand the ice-shelf void containing the fragment. Our analysis confirms the expectations that ice-shelf-fragment capsize can generate stresses within the surrounding ice shelf, and that these stresses exceed the normal, background spreading stress for the ice shelf (e.g. Reference WeertmanWeertman,1957).
3.1. Ideal geometry
We consider an idealized, rectangular ice-shelf fragment with horizontal dimensions Lx = ∊H < H and Ly ≫ Lx , and vertical dimension (thickness) H, and rotation angle θ as depicted in Figure 2.We take the x dimension to be directed along the original flow of the ice shelf, i.e. toward the ice front, and the y dimension to be directed transverse, across the flow. We further assume the ice-shelf fragment is located near the center line of the ice shelf, away from its transverse margins. As justified above, we simplify the analysis by taking Ly → ∞; thus considering the geometry to be two-dimensional. Cases of interest, i.e. where capsize of the fragment leads to release of gravitational potential energy, are defined by 0 < ∊ < 1. For simplification, all mechanical quantities shall be derived with appropriate units per unit length of the rift. We also assume that ρ i/ρ w > 1/2, where ρ i and ρ w are the densities of ice and sea water, respectively. This assumption is reasonable and allows us to avoid consideration of circumstances where the ice-shelf fragment under consideration could float with only two of its sides submerged, e.g. as if only one corner were below the surface of the ocean.
The goal of our analysis is to determine the contact forces between the corners (edges in three-dimensions) of the ice-shelf fragment and the rift walls at points A and B in Figure 6a. To simplify the analysis, we shall assume that both the ice shelf and the fragment are rigid, and that contact forces F are directed normal to the vertical face of the rift walls, i.e. horizontally.We make the first assumption because the break-up of Larsen B Ice Shelf occurred over an interval that is short compared to the time taken for typical ice-shelf deformation to modify the shape of the ice shelf or the fragments significantly. Brittle behavior will undoubtedly modify the geometry, but such processes are not included in the present analysis of block-rotation mechanics. The second assumption, that the contact forces are directed normal to the vertical faces of the rift, is consistent with the notion that the points of contact are able to slide vertically without shear traction. The model geometry has symmetry about the vertical axis such that the negative and positive θ cases are identical. As we shall show, the magnitude of the contact force between the capsizing fragment and the rift walls, F = |F|, is a function of θ. The goal of our analysis is to derive F(θ).
Sequence showing the geometry of the ice-shelf fragment at various stages during its capsize; (a–d) are ordered by increasing θ. (a) and (c) show how the submerged cross-section area (dark-shaded portion) of the fragment can be computed from knowledge of γ1, γ3 and γ4, for the 0 ≤ θ < θ1 (regime 1) and θ1 ≤ θ < θ2 (regime 2), regimes respectively. In (a), the submerged area (dark-shaded) is equal to the total area, ∊H
2, minus the areas of the small triangle (light shaded),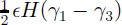 , and the upper rectangle (unshaded), ∊Hγ
3. In (c), the submerged area (dark-shaded) is equal to the total area, ∊H
2, minus the area of the triangle (unshaded),
 . (b) Showing how the separatrix between regimes1 and 2, i.e.θ = θ
1, is computed from the geometry when the corner labeled B (see a) just touches the sea surface. (d) Showing how the critical angle θ
2 is determined, when F becomes infinite.

To compute F(θ), we consider the balance of force and torque, as depicted in Figure 7. Balance of forces in the vertical direction leads to a determination of the fragment’s vertical position relative to sea level, i.e. how much of its sides are submerged below the sea-water surface. Balance of force in the horizontal direction leads to the result that F on one face of the rift wall is equal and opposite to F on the other. (Henceforth, F shall refer to the magnitude of the force acting on either rift wall.) Balance of torque leads to the determination of F as a function of θ.
The origin of forces and torques generated by a capsizing ice-shelf fragment. (a) The weight of the fragment, M g, where M = ρi∊H 2, which is balanced by buoyancy forces created by the displacement of sea water. (b) Sea-water pressure acting on sides 1, 2, 3 and 4 generating torque that drives rotation about the center of mass, assumed to be the center of cross-section area (homogeneous density assumed).To balance this torque, forces of contact (horizontal arrows), with magnitude F, are generated at edges where the ice-shelf fragment touches the rift walls. (c) Imbalance between the pressure of sea water and ice on either side of the vertical rift wall, generating a driving stress with vertical average of magnitude F d.

3.2. Three regimes of rotation
We begin our analysis with an examination of the geometry of the ice-shelf fragment as it capsizes by rotating through π/2 radians. We may anticipate three regimes of rotation. The first regime covers the initial range of rotation prior to the point where the corner labeled B in Figure 6a dips to the sea surface as shown in Figure 6b.The second regime covers the range of rotation following the dipping of the corner but before the fragment’s internal diameter, of dimension  , is aligned horizontally. The second regime is shown in Figure 6c. The third regime encompasses angles of rotation beyond those where the fragment’s internal diameter is horizontal. In this regime, we anticipate the ice-shelf fragment will rotate to π/2 instantaneously, because the fragment has already pushed the rift open beyond its new, capsized width of H. Our analysis will thus be restricted to the first and second regimes only.
Regime 1 is defined by θ < θ 1, where θ 1 is the angle of rotation that puts the point B in Figure 6 at sea level. Simple construction and trigonometry for the situation depicted in Figure 6b gives the expression for θ 1

Regime 2 is defined by moderate angles of rotation, θ 1 ≤ θ < θ 2. The value of θ 2 is determined again by construction and trigonometry (Fig. 6d),

We note that when θ = θ
2, contact forces F cannot produce the torque needed to resist the torques of buoyancy that tend to make the fragment capsize. Regime 3 is defined for large angles of rotation, i.e. θ
2 ≤ θ ≤ π/2. In this regime, the ice-shelf fragment can no longer maintain contact with the rift walls which have been separated by the distance  . Regime 3 is only experienced momentarily as the fragment completes its capsize.
3.3. Balance of force
Gravity creates a downward vertical force on the ice-shelf fragment that is balanced by the integral of sea-water pressure acting on the submerged sides of the fragment. We assume that the pressure is hydrostatic,

where z is the vertical coordinate, positive upward and zero at sea level. The integral of the pressure acting on the submerged surface is thus (a) vertically directed and (b) equal to the weight of displaced sea water (Archimedes principle). The first result, that the net force is vertically directed, reminds us of why the contact forces ±F at points A and B in Figure 6a are equal and opposite. The second result allows us to deduce

where the volume V represents the entire ∊H 2 volume of the ice-shelf fragment, and V s is the portion of the fragment’s volume that is submerged. Evaluation of Equation (7) is necessary to determine a geometric description of the submerged surfaces of the ice-shelf fragment needed for the analysis of capsize moments (see next section). The geometric description needed involves the freeboard heights γ 1, γ 3 and γ 4 shown in Figure 6.
3.4. Balance of torque
To derive the expression for F, we consider the balance of torque acting to rotate the ice-shelf fragment about its center of mass, as shown in Figure 7b. The torque of gravity about the center of mass is zero. For simplicity, the center of mass is assumed to be located in the center of the fragment, i.e. the density of the ice-shelf fragment is uniform. The forces of sea-water pressure acting on surfaces 1, 2, 3 and 4 (Fig. 7b) develop torques τ
1, τ
2, τ
3 and τ
4, respectively. In cases where all of a particular surface is above sea level, the corresponding torque is zero. The sum of torques,  , represents the capsize moment that tends to tip the ice-shelf fragment onto its side unless balanced by a torque produced by forces of contact with the rift walls.
For rotation regimes 1 and 2, a torque T is produced by forces of contact, F and −F, at points A and B (Figs 6a and 7b), respectively, when  Recall that we consider only circumstances where the ice-shelf fragment initially capsizes in the clockwise direction. The moment arm over which these two forces of contact operate is

which gives

Balancing T against the capsize moment gives

The above expression is evaluated by determining intermediate variables, τ 1(θ), τ 2(θ), τ 3(θ) and τ 4(θ).
3.5. Regime 1: 0 ≤ θ < θc
In this case, the rotation is not yet large enough to submerge point B and side 4 defined in Figure 6a. To specify the volume and surface area of the submerged portion of the ice-shelf fragment, it is necessary to determine γ 1 and γ 3, i.e. fragment’s freeboard lengths on sides 1 and 3. Inspection of the geometry shown in Figure 6a shows that

Evaluation of the volume integral in Equation (7) using the geometric description of submerged volume given in the caption to Figure 6 gives

Substitution of Equation (11) into Equation (12) gives

In addition to the above expressions for γ 1 and γ 3, we note that γ 2 = 0 and γ 4 = H/2, because side 2 is completely submerged and side 4 is completely above the sea surface (Fig. 6a).
To determine the τ i’s, we integrate the sea-water pressure, assumed hydrostatic, along sides 1, 2 and 3 of the iceshelf fragment as follows,


z 1(λ), z 2(λ) and z 3(λ) are the depths at points along each of sides 1, 2 and 3, respectively, and λ is distance along each respective side, with λ = 0 at the point where the center of mass is projected onto that side. The limits of integration in the above expressions are the locations of submergence boundaries.
The geometry shown in Figure 6a gives


on the lower surface. Substitution of the expressions for z 1(λ), z 2(λ) and z 3(λ) into the integrals of the expressions for the τ i’s give


3.6. Regime 2: θ 1 ≤ θ < θ 2
The rotation for regime 2 is sufficiently large to submerge point B, all of side 3 and part of side 4 as shown in Figure 6c. The rotation has not, however, gone so far as to reach θ = θ 2. In this case, γ 1 and γ 4 are relevant to the analysis. Inspection of the geometry in Figure 6b shows that

Evaluation of the volume integral in Equation (7) is slightly more complicated here than for regime 1 because all sides of the ice-shelf fragment are at least partially submerged. The algebraic effort gives

The τ i’s are evaluated by integration, along sides 1, 2, 3 and 4 of the ice-shelf fragment as follows:


Consideration of the geometry in Figure 6c yields


Substitution of the expressions for z 1(λ), z 2(λ) and z 3(λ) into the integrals for the τ i’s above give


3.7. Expressions for F(θ)
We find it useful to record the expressions for F(θ) in two special circumstances: first for 0 ≤ θ < θ 1 and second for θ = θ 1.These expressions are:

for 0 ≤ θ < θ 1 and

for θ = θ 1. The expressions for γ i and τ i, i = 1,…,4, given in the previous sections, and for F(θ) given above, were derived by hand and then checked using Mathematica (a computational mathematics package).
3.8. Initial capsize stability
A crucial element of our conjecture is that the wedging force F(θ) be positive for small θ, i.e. that the ice-shelf fragment be initially unstable.This is not the case for all values of the aspect ratio, ∊, for the idealized ice-shelf fragment considered here. As we shall see, when ∊ → 1 capsize moments for small rotations are negative and tend to prevent the fragment from starting to capsize. In simple terms, fragments that are nearly as wide as they are thick cannot capsize unless they are first rotated beyond a certain critical angle.
We remark that conversations with referees of this manuscript made us realize that ice-shelf fragments can be induced to capsize even if ∊ is greater than the critical value limiting initial capsize instability (derived below). To be induced, some external agent, such as tilting of neighboring fragments or meltwater loads introduced on the surface of the ice-shelf fragment and not allowed to drain away, must rotate the fragment to its point of capsize instability. For the present study, we shall simply suggest that such actions by external agents, especially those associated with the surface loading induced by meltwater ponds, are consistent with observation.
To determine the range of ∊ associated with ice-shelf fragments that are always unstable, i.e. capable of initiating a self-sustaining wedging force, we demand

i.e. that F(θ) > 0 for small ∊. Examining the small θ approximation to the righthand side of Equation (37) gives the requirement,

Ice-shelf fragments with ∊ > ∊ c are initially stable, and will thus not create a wedging force for small ∊. For an ice–ocean density contrast appropriate to the heavily melted Larsen A and B ice shelves (see section 3), ∊ c ≈ 0.8087. This value for ∊ c was verified computationally. As we shall show below, the expansion of ice-covered-ocean area during the break-up of Larsen B implies ∊ ≈ 1/4 < ∊ c.This is reassuring, as it suggests that our proposal, that ice-shelf-fragment capsize played a role in the break-up of the ice shelf, is indeed consistent with observation.
3.9. Capsize resistance at θ = θ 1
The idealized geometry considered here leads to a circumstance where fragments with ∊ < ∊ c develop resistance to capsize at larger angles θ ≈ θ 1, even if they are initially unstable at small angles. This circumstance arises because the idealized rectangular ice-shelf fragment develops stability as its upper corner is submerged below the sea surface, i.e. as the fragment attempts to rotate beyond θ = θ 1.
To determine the minimum ∊ for which

we examine the numerator of the righthand side of Equation (38) and determine,

Ice-shelf fragments with geometries ∊ min < ∊ < ∊ c are initially unstable, but become stable as θ → θ 1. Such fragments will not create capsize torque capable of driving θ beyond θ 1. Even in this case, however, if neighboring fragments have capsized and the otherwise stable fragment has been twisted, pushed and pulled by its neighbors, it may ultimately rotate to the point where θ > θ 1. For typical ice density (see section 4), ∊ min ≈ 0.7893. This value was verified computationally by assuring that F(θ 1) → 0 when ∊ = ∊ min.
4. Computation of F(θ)
The computation of F(θ) for conditions representative of Larsen B Ice Shelf requires estimates of H and ∊. For H, we rely on satellite-altimetry analysis (Reference Bamber and BindschadlerBamber and Bindschadler, 1997), which gives surface elevations on a continent-wide scale. We infer that H is 200–220 m. We take H = 220 m and assume the average densities of ice and seawater, ρ i and ρ w, to be 900 kg m−3 and 1028 kg m−3, respectively. For ∊, we rely on the satellite imagery showing the intact (Fig. 1b, 23 February) and post-break-up (Fig. 1c, 7 March) extents of Larsen B Ice Shelf. The initial, pre-break-up distance L between the grounding line (estimated from coastal features) and the ice front is about 32 km. Following the break-up, the distance L + ΔL between the grounding line and the leading edge of the ice-shelf-fragment aggregate is about 115 km. This gives ΔL = 83 km. The number of uniformly sized fragments of width ∊H required to make up the initial span L is N = (L/∊H). When all these fragments have capsized, they span a distance of N H = L + ΔL. These two considerations give

We note that ∊ estimated in this fashion is less than ∊ min; implying that, fragments of the geometry relevant to the Larsen B Ice Shelf break-up are unstable for 0° < θ < 90°. We also note that our estimate above disregards the fact that a sizable fraction of the ice-shelf fragments failed to capsize; seen as the bright, white icebergs in Figure 1c. Accounting for the fraction of initial ice-shelf area that fails to capsize in the break-up reduces the value of ∊. In other words, more fragments with a correspondingly smaller initial width along-flow are needed to capsize as a means of expanding the ice-covered area of the ocean surface.
The wedging force, F(θ), is computed for two values of ∊ and plotted as a ratio F/F d in Figure 8 (∊ = 1/4 in Fig. 8a, and ∊ = ∊ c in Fig. 8b), where the ice-shelf driving force, F d, is defined as the difference between integrals of hydrostatic and glaciostatic pressures acting on the vertical faces of the rift walls (Fig. 7c; and also Reference WeertmanWeertman, 1957; Reference ThomasThomas, 1973; Reference Morland, Van der Veen and OerlemansMorland, 1987),

We choose to display computed F as a ratio, F/F d, simply because F d provides a convenient standard of reference. We do not imply, by this reference, that F and F d are in direct opposition.
The ratios (a) (F/F d) for ∊ = 1/4 and (b) ∊ = ∊ c, as functions of θ. Horizontal rules show (F/F d) = 1 and (F/F d) = 0.1. Vertical rules show θ = θ 1 and θ = θ 2. (a) The wedging force possibly relevant to the break-up of Larsen B Ice Shelf, where ∊ of some fragments may be 1/4. (b) Fragments that are initially too wide, e.g. where ∊ ≥ ∊ c, are initially stable and cannot generate capsize moment for small θ.

Examination of F/F d for the case ∊ = 1/4 illustrates the fact that F is large, i.e. is comparable to, or greater than, F d, over the range of θ < θ 2 in excess of approximately 20°. What is important for the discussion that follows is that F is an increasing function of θ, and becomes very large (i.e. singular) at the critical angle θ 2.
In contrast to the results for ∊ = 1/4, the ratio F/F d for the case ∊ = ∊ c is not positive for θ < θ 1. This reminds us that when ∊ is too large, the ice-shelf fragment is initially stable in its upright position and will thus resist capsize.
The singularity at θ = θ 2 falls naturally from our idealized geometry, and results from the vanishing of the moment arm over which the wedging force F acts to produce torque. As shown in Figure 6d, when θ = θ 2, buoyancy still provides a capsize moment. The two points of contact between the ice-shelf fragment and the rift walls, points A and B (Fig.6d), are onthe same horizontal level as the center of mass of the fragment. Thus, for rotation about the center of mass, the forces F at points A and B are applied with a moment arm of zero. This singularity is a manifestation of the simple geometry and the treatment of the ice-shelf fragment and rift walls as rigid. What is likely to happen in less-idealized circumstances is that the corners represented by points A and B will crush as θ → θ 2. In this circumstance, the fragment will enter regime 3 (free capsize without restraint) and F will go to zero. One interesting implication of the singularity present in the results for idealized geometry is that wedging-force magnitude does not depend entirely on the size and mass of the ice-shelf fragment that capsizes. Wedging forces for even small fragments can become large as angles of rotation approach θ 2.
5. Gravitational Potential Energy of Ice–Ocean System
It bears mentioning that the process of ice-shelf-fragment capsize for all ∊ < 1 implies a reduction of the overall gravitational potential energy of the ice–ocean system. The gravitational potential energy of the fragment due to its capsize increases, because the center of mass of the fragment moves upward when ∊ < 1. The change in the fragment’s potential energy (final minus initial) is,

The change of gravitational potential energy of the sea water that is displaced by the fragment is more difficult to visualize because water must flow from elsewhere to fill the void created by the ever-widening rift in response to fragment capsize. As the ice-shelf fragment pushes the rift open, water seaward of the ice-shelf front is displaced. This displacement is accommodated by sea water filling the cavity created by the widening rift and by the movement of the fragment’s keel as it swings up. The change in potential energy associated with sea-water movement is found to be

The net change in gravitational energy between the final and initial states of the fragment-filled rift is simply the sum of the above two expressions:

We note ΔPE < 0 when θ < 1. This means the process of rift wedging associated with the mechanism considered here releases gravitational potential energy.
5.1. Generalized ice-shelf binding force
We can estimate a force scale,  , that binds an ice shelf in an integrated state by considering the relationship between work and energy, and using the result derived for ΔPE above. The total energy released by the break-up of Larsen B Ice Shelf, assuming the mechanism under study here, is (L/∊H) × ΔPE, where L = 32 km is the initial span of the ice shelf from grounding line to ice front. The definition of work gives

where ΔL = 83 km is the change in length of the ice aggregate between the initial and final states. Using the expression for driving force, given in Equation (44), and the fact that ΔL = L(1 – ∊)/θ, the above expression reduces to

This result serves as a useful check on the algebra used to compute ΔPE. It also serves to remind us of the difference between normal ice-shelf flow (i.e. slow-creeping seaward spreading) and the ice-shelf break-up displayed by Larsen B Ice Shelf. In each case, the binding forces are equal and opposite to the usual driving force (associated with sea-water pressure at the seaward ice front). In the case of normal, creeping ice-shelf flow, the binding force is generated by the viscous rheology of the ice. In the case of the Larsen B Ice Shelf break-up, the binding force can be interpreted as the force that must be overcome to split apart the ice shelf to make hundreds and possibly thousands of small fragments.
6. Runaway Fragmentation Instability?
We envision a runaway instability in which a few initial capsizing fragments stimulate a cascade of coherent fragmentation, capsize and break-up. This hypothetical instability, such as illustrated in Figure 3, is speculative because observational support and theoretical development remain tentative. Nevertheless, it constitutes a motivation for studying the events of the Larsen B Ice Shelf break-up further. A key assumption of the hypothesized instability is coherent behavior among capsizing ice-shelf fragments and the through-cutting rift systems that create them. Such behavior is presumed to create a stress field within the ice shelf (Fig. 3b) that overwhelms its binding strength. Another assumption is that the initial coherent capsize of some, possibly small, fraction of the ice shelf can stimulate capsize of other parts of the ice shelf that may have geometries which feature initial stability. The two assumptions together allow us to envision a cascading effect, where one small population of capsizing fragments induce the ultimate capsize of a much larger fraction.
To illustrate the hypothesized instability, we portray one possible scenario in Figure 3. Inthis scenario, coherent behavior among the initial population of capsizing fragments begins in the mid-ice-shelf region, i.e. neither at the ice front nor the grounding line. Alternative origin locations could be argued, should observational and theoretical development mandate such modifications.Viewed in cross-section, Figure 3 displays the onset of coherent behavior of various ice-shelf fragments and through-cutting rifts (Fig.3a). As discussed in section 1, the attainment of this initial condition likely depends on the action of surface meltwater. As the coherent behavior of fragments and rifts cascades to larger amplitude (Fig. 3b), some rifts become well-developed centers for wedging force as numerous fragments vie for a capsized condition within them. During this phase, such rifts become expanding bubbles within the ice shelf (somewhat analogous to the expanding bubbles within a bottle of champagne that has been shaken and then opened), and cause stresses elsewhere that may drive or accelerate further fragmentation. At the end of the process (Fig. 3c), the collection of fragments overwhelms the remaining integrated ice shelf. The collection of fragments then advances seaward at a rate that is determined by the interaction of individual fragments as each vies against its neighbors for a configuration of minimum potential energy.
Viewed from above, i.e. as in Figure 3b and d, the hypothesized instability produces a region of expanding ice shelf that is riven with rifts forced to widen in a coherent manner by capsize of the ice-shelf fragments they contain. The net effect of this expansion is to realize a generalized tensile-stress regime within the ice shelf as a whole (causing its seaward expansion, as depicted by white arrows in Fig. 3b) and creating shear stresses at the sides of the expanding region (tensor symbols in Fig. 3b) where this generalized tensile stress is resisted by integrated ice-shelf cover at the margins of the disintegrating region.
7. Predictions and Future Directions
The ice-shelf-fragment-capsize mechanism described above and our proposition that it powered the disintegration of Larsen A and B ice shelves in response to an external trigger can account for several important observations made during the Larsen B disintegration event. These observations, listed in section 2, offer only circumstantial support for the proposition; thus, future progress will depend on additional observation and theoretical development particularly the analysis of three-dimensional effects disregarded in the current work.
7.1. Predictions of the hypothesis?
In the course of this manuscript’s review, referees drew attention to three additional aspects of the satellite observations that may confirm predictions associated with the simple hypothesis presented here or with other theories to be developed in the future. These observations involve the post-break-up MODIS image of 7 March 2002 (Figs 1c and 9), and are summarized as follows. First, the greatest uniformity of blue-colored mass of ice-shelf fragments (also seen in the original color image, available at the web site cited in section 2.1) is found near the grounding line of the ice shelf just downstream of the Hectoria and Evans Glaciers, where the ice thickness is presumed greatest, and where meltwater ponding seen in the 23 February 2002 image (Fig. 1b) is least pervasive. Second, the density of large, uncapsized ice-shelf fragments (seen as bright white objects in Fig. 9) is largest in two general areas; near the ice front in general, and along the extent of ice originating as discharge from Crane Glacier (Fig. 9). Third, sharp lateral boundaries exist between the disintegrated ice shelf and surrounding, unaffected ice shelf. These boundaries do not appear to be constrained by surface-meltwater-accumulation patterns.
MODIS image of Larsen B Ice Shelf on 7 March 2002 showing regions where ice-shelf fragmentation is predominantly fine-scale (capsized fragments) and where fragmentation is predominantly large-scale (uncapsized tabular icebergs).

The first observation presents an interesting question: why should the region of most extensive fragmentation also be that which appeared to be least influenced by surface meltwater immediately preceding the ice-shelf break-up and farthest from the ice front? This observation would seem to counter the notion that crevasse wedging by surface meltwater accumulation or tensile-stress augmentation by evolving ice-front shape are the immediate, proximal cause of the break-up. However, analysis of surface meltwater accumulation during summer seasons prior to 2001–02, and our presumption that the ice shelf is thicker near the grounding line than near the ice front, suggest that the ice-shelf-fragment-capsize mechanism could in fact answer this question. Surface-meltwater accumulation in prior seasons was observed to be at least as pervasive as, if not more pervasive than in late February 2002 (Fig. 1b). It is possible then, that the requisite triggering condition — the hydraulic fracture of crevasses by meltwater — could have been met in prior years in some locations. This time delay, most clearly observed for the ice-shelf region that ultimately disintegrated with greatest vigor, suggests that the explosive break-up is powered by an agent that is unrelated to the immediate presence of meltwater. The ice-shelf-fragment capsize we have introduced here could be just such an agent.
The second observation suggests that the provenance of ice discharged into the ice shelf has a strong influence on the style of break-up. This observation suggests that the pre-break-up surface texture and ice thickness, both of which are related to provenance, are critical in determining the explosiveness of ice-shelf disintegration.
The third observation suggests that some aspect of mechanical strength, such as the degree of ice-shelf rifting, limits the extent of explosive ice-shelf fragmentation.While this observation does little to verify or deny the ice-shelf-fragment-capsize mechanism developed in its most simple, two-dimensional form here, it is anticipated that it will help to constrain future development of a three-dimensional capsize hypothesis.
7.2. Capsize instability in the paleoclimate: Heinrich layers of the North Atlantic?
The ice-shelf-disintegration mechanism proposed here may prove useful as a means to explain terrigenous, iceberg-rafted debris in sea-floor sediments of the abyssal North Atlantic (e.g. Reference BondBond and others, 1992). Hypotheses attempting to explain these ice-rafted debris (IRD) events must account for two facts:
-
(1) debris-rich parts of icebergs survive melting during long, trans-oceanic drift trajectories; and,
-
(2) debris-bearing icebergs seem to be dispersed quickly throughout a large area of the North Atlantic so that they can produce a widespread IRD deposit that is relatively homogeneous in thickness.
One explanation of the North Atlantic’s Heinrich layers, proposed by Reference HulbeHulbe (1997), involves an ice-shelf-disintegration mechanism. Reference HulbeHulbe (1997) suggested that an ice shelf forming at the mouth of Hudson Strait, Canada, during cold-climate fluctuations immediately preceding IRD events, could allow build-up of a debris-bearing ice-shelf reservoir. During such a build-up, meltwater plumes rising along the ice-shelf bottom could underplate the ice-shelf base with marine ice. This accretion would protect debris-bearing ice otherwise exposed to the effects of melting at the ice-shelf bottom, and could thus account for the longevity of debris-rich ice within icebergs subsequently created from the ice shelf on its disintegration.
Modification of Reference HulbeHulbe’s (1997) hypothesis, by adding a capsize instability such as proposed here, could account for the quick and homogeneous dispersal of icebergs. It also provides another way of accounting for the longevity of debrisrich ice while adrift: debris within capsized icebergs would be contained in vertical bands.This distribution would allow the debris to be continuously melted from the iceberg over its entire lifetime. In contrast, an uncapsized iceberg, having a basal veneer of debris-laden ice even if protected by an underplate of accreted marine ice, would be vulnerable to debris loss early in its post-calving trajectory.
To properly examine an ice-shelf origin of Heinrich layers using the additional understanding of ice-shelf-disintegration processes possible in the wake of the explosive break-up of Larsen A and B ice shelves, additional work is necessary. Paramount is an observational test of the ice-shelf break-up mechanism proposed here.
Acknowledgements
Project support for the University of Chicago was provided by the U.S. National Science Foundation (NSF) Office of Polar Programs (OPP-9818622 and OPP-0089902), for the University of Colorado by U.S. National Aeronautics and Space Administration (NASA) grant NAG5-11308, for Portland State University by NSF (OPP-0125754), for the University of New Hampshire by NSF (OPP-0003490) and NASA’s Cryospheric Sciences Program. J. A. Bohlander and T. Haran of the National Snow and Ice Data Center, Boulder, Colorado, generated images of the Larsen B Ice Shelf break-up from MODIS data. The authors thank D. G. Vaughan, P. Skvarca, H. Rott and several others for initial discussions of the events associated with the break-up of Larsen B Ice Shelf. Referees R. B. Alley and C. S. M. Doake, and editor C. S. Hvidberg, were instrumental in the development of the manuscript and are thanked particularly for constructive criticism of ideas discussed in sections 1, 2 and 7.



