INTRODUCTION
Tea is a leading cash crop in world agriculture. The main tea producing countries are China, India and to a lesser degree Sri Lanka, Kenya and Indonesia (Tea Board of India, 2009). Tea in Northeastern India is grown in four major regions: Assam, Terai, Dooars and Darjeeling. With an annual tea production of 480 million kg in 2007, Assam covers approximately 17% of the world's tea production (Tea Board of India, 2007). Decline in tea productivity and quality are seen as major problems by the Indian tea industry.
In Kenya, an important tea exporting country, Kamau (2008) performed research on the productivity and resource use in ageing tea plantations, and observed that significant differences in the mean tea yield were mainly due to differences in management practices, use of tea genotypes and age of the plantations. It was also concluded that further improvement in tea productivity should take into account the interactions between Genotype (G), Environment (E) and Management (M) as was found in food crops (Spiertz et al., Reference Spiertz, Struik and Van Laar2007). Based on this approach, Dutta et al. (Reference Dutta, Stein, Smaling, Bhagat and Hazarika2010) investigated the effects of age (a proxy of G, as varietal information was not sufficiently distinct to be used), rainfall, soil organic carbon (SOC) and pH (E) and NPK fertiliser application and pruning regime (M) on tea yields in seven tea plantations over a period of 5–10 years between 1998 and 2007. They found that tea yield was weakly correlated with rainfall (R 2 = 0.25) and with SOC (R 2 = 0.10) on estates where SOC > 2%. Plant age had a negative (R 2 = 0.28) and N fertiliser application had a positive effect (R 2 = 0.30) on tea yield. Combined analysis of the effect of age and fertiliser application gave higher regression coefficients than separate analysis (R 2 values ranging between 0.15 and 0.64). The pruning analysis remained inconclusive.
Crop models have proved to be useful tools in increasing the quantitative understanding of crop systems (Sinclair and Seligman, Reference Sinclair and Seligman2000) and in providing yield and biomass predictions at the field scale on many occasions (Fei and Ripley, Reference Fei and Ripley1988; Otter-Nacke et al., Reference Otter-Nacke, Godwin and Ritchie1986). Several generic crop models have been developed in the past decades (Brisson et al., Reference Brisson, Mary, Ripoche, Jeuffroy, Ruget, Gate, Devienne-Barret, Antonioletti, Durr, Nicoullaud, Richard, Beaudoin, Recous, Tayot, Plenet, Cellier, Machet, Meynard and Delécolle1998, Reference Brisson, Ruget, Gate, Lorgeou, Nicoullaud, Tayot, Plenet, Jeuffroy, Bouthier, Ripoche, Mary and Justes2002, Reference Brisson, Gary, Justes, Roche, Mary, Ripoche, Zimmer, Sierra, Bertuzzi, Burger, Bussiere, Cadiboche, Cellier, Debaeke, Gaudillère, Hénault, Maraux, Seguin and Sinoquet2003; Jones et al., Reference Jones, Hoogenboom, Porter, Boote, Bachelor, Hunt, Wilkens, Singh, Gijsman and Ritchie2003; Ritchie and Otter, Reference Ritchie and Otter1984; Stockle et al., Reference Stockle, Martin and Campbell1994; Williams et al., Reference Williams, Jones and Dyke1984), but most of these models have been developed at the field scale and they require many input parameters such as soil properties, cultivar properties and cropping management. At a regional scale, some of these parameters are not readily available. While soil properties can usually be extracted from soil databases, which cover large parts of agricultural land in many countries, cultivars and cropping management parameters are not often available. Concerning cultivar properties, at the regional scale, many cultivars from several seed companies are used (Jego et al., Reference Jégo, Pattey, Bourgeois, Morrison, Drury, Tremblay and Tremblay2010). The calibration of each of them in a crop model requires many datasets and resources. In addition, the spatial distribution of the use of these cultivars is also unknown. As these cultivars are regionally adapted and presented with generally similar properties, it can be advantageous to define the minimum number of cultivar representatives of average properties of the regionally adapted cultivars used in a specific area.
The analysis of these secondary data triggered the setting up of a field trial to further investigate the relations between tea yield and G, E and M parameters, as well as the use or development of a tea production model. Neither ongoing field studies on tea growth and production nor simulation models describing tea growth and production seem to abound. The only model described in recent literature is known as the Cranfield University Plantation Productivity Analysis (CUPPA) Tea, developed using Tanzanian data (Matthews and Stephens, Reference Matthews and Stephens1998b, Reference Matthews and Stephens1998c). The model was developed with a range of crop, soil and water parameters to provide a dynamic simulation of tea growth and production. Many parameters in this model are hard to measure on a routine basis, whereas others, such as fertiliser use, are not fully functional, which makes rapid validation less easy. The model has earlier been successfully validated for conditions in Tanzania and Zimbabwe (Matthews and Stephens, Reference Matthews and Stephens1998b, Reference Matthews and Stephens1998c), and has also been used to study the influence of irrigation potential on tea yield in Northeast India (Panda et al., Reference Panda, Stephens and Matthews2003).
The objective of the research in this paper is to analyse factors affecting tea productivity through statistical and modelling approaches. The study reports on a three-year (2007–2009) agronomic field trial on tea in Assam, India. The factors looked into are based on the earlier analysis of secondary data (Dutta et al., Reference Dutta, Stein, Smaling, Bhagat and Hazarika2010), and include variety (clonal vs. seedling) and age (G), rainfall, temperature, soil pH and organic carbon (E) and tea bush density. As a number of sections contained considerable gaps, the analysis was repeated for ‘adjusted’ yields, considering 100% coverage of sections by tea bushes. Next, the results are used to perform a calibration of the CUPPA Tea model for the conditions in Assam. A sensitivity analysis is carried out to check the robustness of the CUPPA Tea model.
METHODOLOGY
Study area and field data
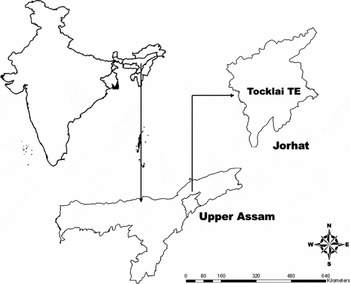
The study was carried out in the Tocklai Experimental Tea Estate of Tea Research Association (TRA) located in Jorhat district in the South Bank region of Assam in Northeast India (Figure 1). Jorhat is situated at 26.75 °N latitude and 94.22 °E longitude. The site has an average elevation of 116 m with summer temperature ranging between 15 and 35 °C and winter temperature between 7 and 18 °C. Summers are accompanied by heavy monsoon showers with the area receiving an average annual rainfall of 2244 mm. There are 135 tea estates in this region.
Location of Tocklai experimental tea estate.

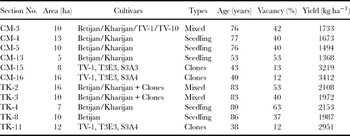
The estate has an area of 205 ha, out of which 118 ha is under tea. It has 11 sections with the area of each section ranging from 4 to 14 ha. The sections contain tea plants of different cultivars (Table 2) and are managed on individual basis. Tea yield data were collected both at the estate and at section levels for 2007, 2008 and 2009. Daily rainfall data were collected by the weather station of TRA. Soil pH and SOC data were collected in 2007 only for the topsoils (0–15 cm) of all sections. Soil samples were collected using random sampling (Dang, Reference Dang2007). The pH was measured by the standard potentiometric method with glass electrode (Jackson, Reference Jackson1973), whereas SOC was determined by the wet digestion method (Jackson, Reference Jackson1973; Tandon, Reference Tandon1993; Walkley and Black, Reference Walkley and Black1934).
Gaps (vacancies), cultivars, bush spacing and plant age were also recorded at the section level. The collected data were used for modelling the influence of environment on tea productivity. Different statistical models were applied to the data to see the association of different factors on tea yield.
Statistical analysis
For each year, descriptive statistics were performed at the section level. The mean was calculated as the sum of the annual yields (Y(s,t)), where Y(s,t) is the yield in year t and section s, divided by the number of years and sections. The standard deviation was also calculated as a measure of variability within a dataset.
Secondly, a correlation analysis was carried out both for actual and adjusted yields at the section level.
Thirdly, linear regression analysis was carried out for actual and adjusted yields with monthly rainfall as an explanatory variable at the section level:

where Y(s,m(t)) is the section-specific monthly yield (m(t)) for years (t) = 2007, . . ., 2009; rain(s,m(t)) is the monthly rainfall at the section and ɛ(s,m(t)) is the independent site and time-specific error term. A similar analysis was carried out with the rainfall of one month (x) as an explanatory variable and the yield of the following month (x + 1) as a dependent variable.
A section-wise linear regression analysis was carried out to see the effects of explanatory variables, i.e. age, vacancy, pH and SOC. In the parallel run, yields were adjusted by considering that vacancies within the sections do not exist.
Yield and age: This model is written as follows:

where age(s,t) is the age of plantations in section s in year t, and ɛ(s,t) is the independent site and time-specific error term.
Yield and vacancy: This model is written as follows:

where vac(s, t) is the number of vacancies within sections s in year t.
Yield, pH and SOC: First, a linear model was implemented to relate pH with yield at the section level:

where pH(s,t) is the pH in section s in year t. Similarly, a model for SOC equals to

where SOC(s,t) is the amount of organic carbon in section s in year t.
Finally, a section-wise multiple regression analysis was carried out to find out whether the combination of ‘age’ and other variables gave a better explanation of actual and adjusted yields. The different models are written as follows:

CUPPA tea simulation model
The CUPPA Tea simulation model (Matthews and Stephens, Reference Matthews and Stephens1998b) simulates the growth and yield of tea by taking into consideration the effects of solar radiation, atmospheric humidity, temperature, day length and soil water availability on crop growth and development. The model operates on a daily time step and includes routines describing shoot growth and development, dry matter production and partitioning and the crop water balance (Matthews and Stephens, Reference Matthews and Stephens1998b, Reference Matthews and Stephens1998c). It simulates the growth and development of shoots on a daily basis thereby representing the behaviour of the whole crop. The rate of shoot growth and development is calculated as a function of temperature, day length, humidity and crop water status. The amount of water taken up by the crop is calculated as a function of the potential evaporative demand by the canopy, the amount of soil water and the root distribution in the soil profile. The potential evaporative demand is determined by the crop leaf area, level of sunlight, temperature, humidity and wind speed. The model also calculates the water stress factor as the ratio of actual water uptake to the potential water demand to modify shoot development and extension rates and also dry matter production. This model is designed to extrapolate the results of field experiments to wider ranges of similar environments, and has the ability to evaluate the effects of different management decisions on yield and its distribution over a range of years.
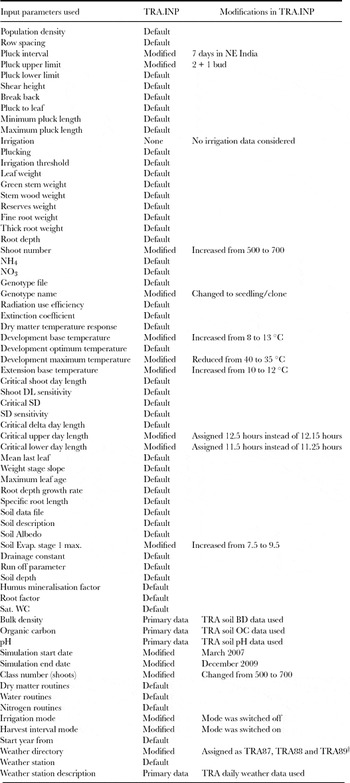
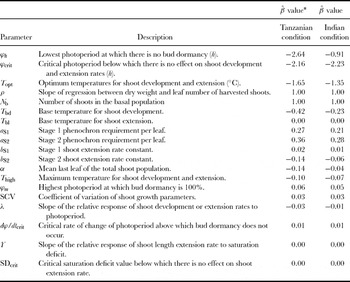
In order to calibrate the model, weather, soil and yield data from TRA were used. The model was run by changing the input parameters such as temperature, shoot numbers and day length according to Indian conditions (Table 1). As no data were available on shoot growth and development for cultivars grown in India, the genotype parameters for clone 6/8 (a widely grown Kenyan cultivar also validated by Panda et al. (Reference Panda, Stephens and Matthews2003) in Northeast Indian conditions) were used as an alternative. Yield was simulated for the Indian conditions by modifying the weather parameters. Most of the growth parameters of the TRA clones or seedling varieties are not known and hence calculations had to rely on the clone 6/8 characters. A previous study carried out by Panda et al., (Reference Panda, Stephens and Matthews2003) using the CUPPA Tea model in Terai and Tezpur regions of Assam for modelling the influence of irrigation on tea yields also considered the clone 6/8 characters. For our study, the model was calibrated under Indian conditions to compare the simulated yields with seedling, clonal and mixed (seedling + clones) tea at the estate level.
Input parameters of the original CUPPA tea model*, and modifications made for the Tocklai tea estate.

* TRA.INP is the general input parameter file of the CUPPA Tea model.
† TRA87, TRA88 and TRA89 represent the weather data of 2007, 2008 and 2009.
Day length influences growth and dormancy in tea bushes. According to Panda et al. (Reference Panda, Stephens and Matthews2003), the day length in Northeast India varies from 10.3 hours in December to 13.7 hours in June. When day length is below 11.15 hours for six weeks, tea bushes become dormant as stated by TRA. Hence, in Northeast India (25–27 °N latitude), tea bushes remain dormant during the winter season for approximately three months due to the combined effects of short days and low temperature. As Northeast India is situated much farther away from the equator than the tea growing zone in Tanzania where the model was developed (6 °S latitude), the critical lower day length was set at 11.5 hours to match with the conditions in Assam. The minimum temperature required for shoot extension was set at 13 °C (De Costa et al., Reference De Costa, Mohotti and Wijeratne2007), while the optimum temperature in the CUPPA Tea model was set to 24 °C. Leaf temperatures in Northeast India are often 5–10 °C above air temperature (Hadfield, Reference Hadfield and Evans1976). Thus, the critical temperature used in the CUPPA Tea model is equivalent to the leaf temperature of around 30–35 °C, identified as the optimum temperature for photosynthesis (Hadfield, Reference Hadfield and Evans1976; Panda et al., Reference Panda, Stephens and Matthews2003). Based on the Indian conditions, maximum temperature for shoot development and the extension base temperature were set at 35 °C and 12 °C, respectively. Based on the section size. the total number of actively growing shoots per unit area (1 m2) has been assigned to 700. The weather files have been created using daily temperature, wind, rainfall, evaporation, mean vapour pressure and sunshine hours. Using the TRA data, the soil evaporation stage was set at 9.5 mm. Soil pH, SOC and bulk density data were taken from the 2007 experiment. The original model can simulate yields at different plucking intervals from seven to 21 days. For TRA, seven days plucking intervals were assigned to the model, because this is the standard plucking interval in Northeast India.
The model was set up to run from 1 January onwards. Early January is the time of ‘skiffing’ in which the top layer of foliage is removed during the winter season as part of the pruning practices (Panda et al., Reference Panda, Stephens and Matthews2003). In TRA, the first flush of plucking occurs in the middle of March followed by the second flush at the end of April. The model was also calibrated to the standard plucking of two leaves and a bud. As root depth was not recorded, maximum root depth was assumed to be 100 cm, corresponding to the approximate depth of water table during monsoon (Panda et al., Reference Panda, Stephens and Matthews2003). The model was run under ‘without irrigation’ conditions, and assuming no limitations due to nutrients, pests or diseases. As the model currently does not allow handling such limitations, the simulations mimic water-limited yields that are cultivar-specific.
Simulated yields were compared with observed yields for three years and correlations were established. Yields were categorised into three groups: (i) sections with seedling tea, (ii) sections with clonal tea and (iii) sections with mixed (seedling + clonal) tea.
The sensitivity of the CUPPA Tea model output to changes in the input parameters was investigated by running the model with the assigned input parameters held constant at default values, except for the one under consideration. We subjected the model to 1–5% variation in the standard values. The model sensitivity was measured by the ratio β of the percentage change in the predicted yields to the percentage change in the input parameter.
Photoperiod and shoot activity
The simulation modelling indicated that the influence of seasonal variations in temperature or photoperiod on shoot growth rates alone was not able to explain the occurrence of large peaks. Earlier studies have concluded that the best explanation is the regulation of the numbers of shoots available for harvesting through the effect of photoperiod on shoot activity. This indicates that synchronisation of shoot growth is necessary to explain the observed peaks and troughs of tea production, and that the influence of seasonal fluctuations in temperature and photoperiod on shoot growth rates alone is not able to cause synchronisation (Matthews and Stephens, Reference Matthews and Stephens1998a). The switching of shoots in and out of the resting state in response to some environmental cue appears to be the most likely way in which synchronisation can be achieved. The factors influencing the resting state of shoots in tea are also not well understood. The regularity of the onset and release of bud rest suggests that an external influence, such as temperature or photoperiod, is involved because endogenous rhythms alone (Herd and Squire, Reference Herd and Squire1976) are likely to become unsynchronised eventually with seasonal changes. According to Barua (Reference Barua1969), 100% bud rest occurs below photoperiods of 11.25 hours even under artificially increased temperatures (Das and Barua, Reference Das and Barua1987). Further evidence also suggests that the prevailing photoperiod influences the transfer of shoots between the active and dormant populations (Matthews and Stephens, Reference Matthews and Stephens1998a). When photoperiod declines, shoot buds undergo an increased probability of remaining in resting phase even when they are released from apical dominance by the removal of their subtending shoot during harvesting. When the photoperiod is below 11.25 hours, all buds on the bush remain at rest. Then, when the photoperiod begins to increase again from the winter solstice onwards, these resting buds commence development simultaneously, resulting in a large number of shoots being harvested together. Further details of the way in which these mechanisms are incorporated into the model are given by Matthews and Stephens (Reference Matthews and Stephens1998a). Besides photoperiod, another possible mechanism that might explain the triggering of shoot development during the winter period is the alteration of supply and demand balance of carbohydrates resulting from the build up of reserves as shoot growth is slowed by low temperatures (Stephens and Carr, Reference Stephens and Carr1990). Accumulation of carbohydrates may also imply that there is an arbitrary threshold level of reserves that must be reached to trigger shoot development (Matthews and Stephens, Reference Matthews and Stephens1998a). Moreover, either daily mean or night temperatures below a threshold level may also prevent development and extension of shoots in the bud-burst phase, but leave quiescent shoots unaffected. This implies that the base temperature is higher for the bud-burst phase than the quiescent phase. If this is so, then there would be a gradual accumulation of active shoots in the quiescent/bud-burst transition point over the cool season, so that when temperatures again rise above the threshold, all such shoots would commence development simultaneously resulting in the production peak (Matthews and Stephens, Reference Matthews and Stephens1998a).
Further studies by Matthews and Stephens (Reference Matthews and Stephens1998b) also suggest that photoperiod influences the onset and release of bud dormancy, and therefore the number of actively growing shoots at any one time. As shoots are generally harvested at a specific developmental state or size, the number of shoots plucked at each harvest is the main determinant of yield variation. The total number of buds and shoots per unit area is defined as the ‘basal population’, with the number of these that are actively growing being the ‘active population’ and those that are not active the ‘dormant population’. Active shoots develop and extend according to the parameter values allocated to them, or they may temporarily leave and later re-enter the active population through the onset and release from dormancy, which is defined in the model to include both ‘resting’ buds and ‘banjhi’ shoots. The initial number of shoots in the basal population must be specified and, although the model permits the size of this population to change over time, for simplicity it is assumed that it remains constant during a given season (Tanton, Reference Tanton1981).
RESULTS
Tea yield and associated management practices
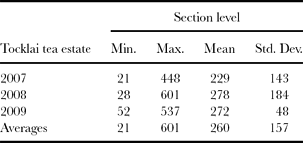
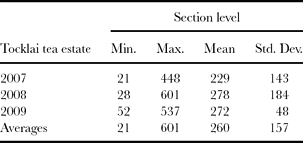
Table 2 shows average tea yields, cultivars and age and vacancy percentage of individual sections. It is observed that tea yields of younger clonal bushes (>3000 kg made tea ha−1) outyield the older bushes with seedlings (1400–1800 kg made tea ha−1). As the mentioned factors differ largely between sections, the yield range turns out to be substantial, i.e. 1368–3412 kg made tea ha−1. Table 3 shows that mean monthly tea yield ranges between 229 and 278 kg made tea ha−1. The survey carried out by Dutta et al. (Reference Dutta, Stein, Smaling, Bhagat and Hazarika2010), covering the tea growing areas of Northeast India, shows a mean tea yield ranging between 1500 and 2500 kg made tea ha−1 over a period of 5–10 years.
Average sectional yields, varieties, age and vacancy percentage for Tocklai tea estate for the period 2007–2009.

Descriptive statistics of monthly tea yield at the section level (kg ha−1) from 2007 to 2009.
Statistical analysis
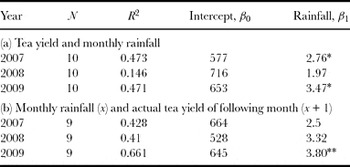
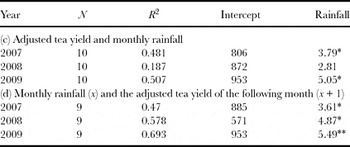
Applying equation (1), significant positive linear effects could be observed at the estate level between actual and vacancy-adjusted monthly yields and monthly rainfall for 2007 and 2009 (Tables 4a and 4c). The R 2 is relatively low, ranging between 0.15 and 0.47 in Table 4a and between 0.19 and 0.51 in Table 4c. Applying the same equation to explain yield in month x + 1 by rainfall in month x gave a marked improvement for actual yield in 2009 (R 2 = 0.66), and in all three years for the vacancy-adjusted yields (R 2 0.47–0.69) (Tables 4b and 4d).
(a) Linear relations between tea yield and monthly rainfall in 10 months of harvesting at the estate level (2007–2009) and (b) linear relations between the monthly rainfall (x) and the actual tea yield of the following month (x + 1) during nine months of harvesting at the estate level (2007–2009).

*Significant at p < 0.05; **significant at p < 0.01.
(c) Linear relations between adjusted yield and monthly rainfall at the estate level (2007–2009) and (d) linear relations between the monthly rainfall (x) and the adjusted tea yield of the following month (x + 1) during the nine months of harvesting at the estate level from 2007 to 2009.

*Significant at p < 0.05; ** significant at p < 0.01.
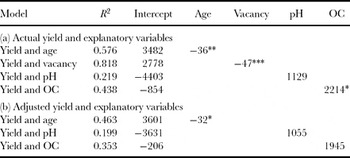
The section-wise regression analysis (equation (2)) for actual and adjusted yields with age as an explanatory variable revealed a significant, negative and linear effect on tea yield (Tables 5a and 5b). Application of equation (3) showed, not surprisingly, that vacancy percentage also has a significant negative and linear effect on tea yield (Table 5a). Soil pH for the estate ranged between 4.3 and 5.3. The section-wise regression analysis (equation (4a)) did not show any significant effect on tea yield, illustrating that the observed pH range is not limiting the tea growth. The SOC percentages for the estate ranged between 0.5 and 1.2%. Applying equation (4b) shows a significant positive effect of SOC on tea yield (Table 5a) with R 2 = 0.44.
(a) Linear relations between actual yield and different explanatory variables at the section level from 2007 to 2009 and (b) linear relations between adjusted yield and different explanatory variables at the section level from 2007 to 2009.

*Significant at p < 0.05; **significant at p < 0.01; *** significant at p < 0.001.
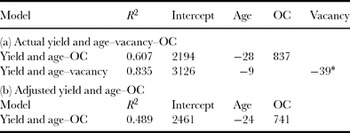
Equation (5) was applied to test the effects of the best possible combinations between age, vacancy percentage and SOC (Tables 6a and 6b). The tables show that age is significant in explaining yield differences (Table 6a). Neutralising the effects of vacancies is not adding any explanation (Table 6b).
(a) Multiple regressions of tea yield with age–vacancy–OC and (b) multiple regressions of adjusted tea yield with age–OC.

* Significant at p < 0.01.
Calibration and evaluation of CUPPA tea model
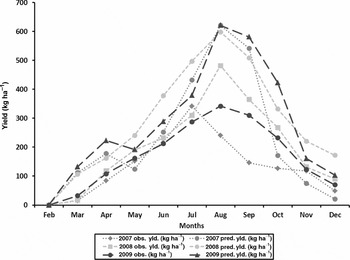
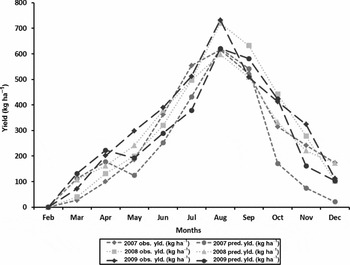
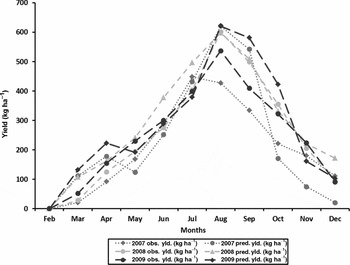
The yield distribution of made tea predicted by the CUPPA Tea model agreed closely with the observed made tea yields under rain-fed conditions (Figures 2a–c). The CUPPA Tea could predict the month of occurrence of the first flush (March) and the second flush (April) correctly, but the predicted yields show larger peaks than the observed yields during these two months. Predicted yields from July to September were higher than the observed yields in seedling tea (Figure 2a). In clonal tea, observed yields showed higher peaks from July to September for the year 2008–2009 (Figure 2b). For the mixed tea, predicted and observed yields corresponded closely (Figure 2c). Throughout the simulations, maximum tea yield was obtained during the month of August. Although the results corresponded closely, the peak differences between observed and predicted yields may be due to the calibration of the model with Indian climatic data while considering the existing genotypic data for the simulations. Following the paper by Panda et al. (Reference Panda, Stephens and Matthews2003), the model uses the information of a clonal cultivar grown under African conditions and the simulation results therefore showed that yield is more closely related to clonal tea than the seedling or mixed tea. Using cultivar-specific information for seedling, clonal and mixed tea under Indian conditions may show further variations in observed and simulated yields. Figures 2a–c show that the correlation between the predicted and observed yields during 2007, 2008 and 2009 were 0.72, 0.98 and 0.95 for seedling tea, 0.90, 0.97 and 0.93 for clonal tea and 0.87, 0.98 and 0.94 for mixed tea, respectively. The root-mean-square error (RMSE) observed is 1.30, 1.51 and 1.36 for seedling tea, 2.29, 2.25 and 2.28 for clonal tea and 1.69, 1.84 and 1.75 for mixed tea for 2007, 2008 and 2009, respectively.
Observed and predicted yields of seedling tea from 2007 to 2009 obtained from the CUPPA Tea model (correlation = 0.72, 0.98, 0.95 and RMSE = 1.30, 1.51 and 1.36).

Observed and predicted yields of clonal tea from 2007 to 2009 obtained from the CUPPA Tea model (correlation = 0.90, 0.97, 0.93 and RMSE = 2.29, 2.25 and 2.28).

Observed and predicted yields of mixed (clones + seedling) tea from 2007 to 2009 obtained from the CUPPA Tea model (correlation = 0.87, 0.98, 0.94 and RMSE = 1.69, 1.84 and 1.75).

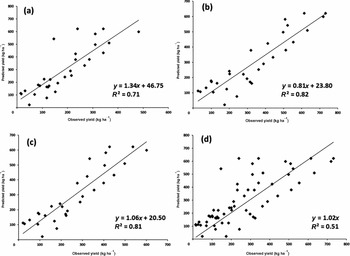
Further, regression analysis of predicted yields against observed yields shows strong linear relationships (Figures 2) with the R 2 values for seedling, clonal and mixed tea yield as 0.71, 0.82 and 0.81, respectively (Figures 3a–c). The slope of the regression lines was 1.34 for seedling tea, 0.81 for clonal tea and 1.06 for mixed tea, showing that the model tends to over-predict for seedling tea, under-predict for clonal tea and (surprisingly) predicts best for mixed tea. The RMSE observed is 1.40 for seedling, 2.27 for clonal and 1.76 for mixed tea. A combined scatterplot for all predicted and observed yields also gave a good fit by forcing the line through the origin (y = x) at an R 2 of 0.51 and an RMSE of 1.83 (Figure 3d). High R 2 and RMSE suggest that the model is more suitable for clonal cultivars but could also be used for comparing the observed and predicted yields of seedling and mixed tea.
Scatterplot showing observed and predicted yields of (a) seedling, (b) clonal and (c) mixed tea obtained from the CUPPA Tea model (R 2 = 0.71, 0.82 and 0.81 and RMSE = 1.40, 2.27 and 1.76, respectively) and (d) a combined scatterplot for all predicted and observed yields (R 2 = 0.51 and RMSE = 1.83).

Sensitivity analysis of the CUPPA tea model
Applying the sensitivity analysis to all the parameters of the model showed that changes in photoperiod and temperature result in substantial yield changes (Table 7). Both parameters have  -value > 1, unlike any other parameter. The most sensitive parameter is the critical photoperiod (ϕ crit), below which there is no shoot development and extension ( = − 2.23) followed by changes in optimum temperature (T opt) for shoot development and extension ( = − 1.35). The sensitivity analysis performed by Matthews and Stephens (Reference Matthews and Stephens1998a) showed that the model is highly sensitive to the lowest photoperiod at which there is no bud dormancy (ϕh), but this was found to be less under Indian conditions ( = − 0.91). The other input parameters did not show much effect on yield when modified in isolation, but they may have a collinear relationship with other parameters.
Sensitivity () of predicted annual yields to input parameters of the model (Matthews and Stephens, Reference Matthews and Stephens1998a).

* is the ratio of the percentage change in the annual yield to the percentage change in the specified parameter, with all other parameters held constant at standard values. Parameters are ranked according to the absolute value of .
DISCUSSION
Research conditions in tea research are more restrictive than those in annual crops. The experiment at TRA was carried out at 11 existing plantation sections, covered by plants of different ages and bush density. Moreover, a mixture of seedling, clonal and mixed (seedling + clones) tea existed and fertiliser applications were decided by the management. The average monthly tea yield at TRA for the three years was 260 kg ha−1, but with a range of 21 to 601 kg ha−1.
Although the estate uses different cultivars, their detailed information could not be used in the analysis due to the non-availability of precise cultivar and growth data. As the sections within the estate are frequently facing replanting on a gap-filling basis, the present study was not based on a controlled researcher-managed environment. Also, data on changes in plant density as a result of replanting and the effect of shade trees per section were not available either. In fact, a range of varieties that are grown in different estates include clonal varieties such as TV-1, TV-9, TV-26 and so forth and seedling varieties such as Assam, Tingamira, Rajgarh, Dangri and so forth. As new varieties were planted as they developed, it was decided that average age of plants in a section as reported by estate management could be taken as an independent variable, and used as a proxy for genotype. This is not an ideal research situation, but it was the best that we could get from estate managers. Information on pest and diseases and different pruning regimes were not known. From the current study, it was observed that the R 2 values were higher than those bringing together agronomic data for several plantations in the area (Dutta et al., Reference Dutta, Stein, Smaling, Bhagat and Hazarika2010), and hence improves the explanatory value. Also, it was shown that the ‘adjusted yield’ approach added explanation to tea yield differences by showing the degree of association between variables.
Linear analysis carried out on monthly rainfall data showed a clear positive effect on yield, but particularly during the month x+1 following the rainfall month x. Kamau (2008) stated that seasonal rainfall differences within years have a marked effect on tea yields. Annual yield distribution is largely influenced by seasonal fluctuations in weather variables such as rainfall, temperature and humidity and by soil water deficits (Matthews and Stephens, Reference Matthews and Stephens1998b). The authors stated that large yield peaks often occurred following a cool or dry season, with subsequent oscillations, which may continue throughout the remainder of the season causing uneven yield distributions. This is then followed by logistical problems in both field and factory in terms of planning labour requirement, supplying adequate transport and providing factory capacity to process the harvested shoots during peak periods.
Francis et al. (Reference Francis, Ng'etich, Omolo and Mamati2002) used different methods to study the phenotypic stability of 20 tea genotypes and stated that as age increases, yield generally decreases, but the yield fluctuations between the genotypes that were used were substantial. Dutta et al. (Reference Dutta, Stein, Smaling, Bhagat and Hazarika2010) also demonstrated that older plantations have lower yields. The stagnation and decline in productivity of older tea plantations have largely been associated with the ageing of tea bushes (Kamau, 2008).
Throughout the analysis, it was observed that the response of tea to pH is virtually absent, which makes sense given the pH range in which tea thrives well. Soil pH is influenced by many soil chemical parameters that may change depending on the external inputs used (Kamau, 2008). The tea plant acidifies the soil due to excess cation to anion uptake, releasing H+ ions from plant roots (Morita et al., Reference Morita, Ohta and Yoneyama1998). Application of acidifying (NH4)2SO4-based fertilisers may have also contributed to the high soil acidity in older tea plantations (Dogo et al., Reference Dogo, Owuor and Wanyoko1994; Ruan et al., Reference Ruan, Ma and Shi2006).
The SOC content had a significant positive relation with yield, which makes sense as SOC ranges between 0.5 and 1.2%. Dutta et al. (Reference Dutta, Stein, Smaling, Bhagat and Hazarika2010), while reviewing data from several estates in Northeast India, found that the significance of the relation between SOC and tea yield existed up to the point where SOC exceeded 2%. This seems like a useful threshold for making management decisions.
The age effects were amongst the clearest ones but require a sharper genotype focus when comparing the results with those of Kamau (2008) in Kenya. This relates closely to our multiple regression findings reported in Table 6, and the findings of Dutta et al. (Reference Dutta, Stein, Smaling, Bhagat and Hazarika2010).
The entire analysis was done using monthly actual and adjusted yields to observe differences within the sections by applying statistical approaches. This helped in modelling the factors limiting tea production using the CUPPA Tea model. Simulation models can help to investigate within- and between-season variability resulting from changeable weather and management inputs. The partial mismatch between measured and calculated tea yields may have different reasons. Fluctuations in tea yield during a year is a well-documented phenomenon in many environments, with both short-term variation within a growing season (Fordham, Reference Fordham1970) and variation between seasons of the year (Barua, Reference Barua1969; Squire, Reference Squire1979). However, Matthews and Stephens (Reference Matthews and Stephens1998a) stated that causes of seasonal variations in tea yield are not well understood. Temperature (Stephens and Carr, Reference Stephens and Carr1990) and photoperiod (Barua, Reference Barua1969) have been implicated in the decline of shoot growth in cool season. Moreover, variations in temperature alone are sufficient to explain the occurrence of production peaks through their influence on shoot growth rates (Squire, Reference Squire1979; Stephens and Carr, Reference Stephens and Carr1990), but it is not clear whether the synchronisation of shoot growth postulated by Fordham (Reference Fordham1970) and Cannell et al. (Reference Cannell, Harvey, Smith and Deans1990) is necessary for such peaks to be produced, and whether synchronisation can be caused by seasonal variations in temperature alone.
The biggest test for this model is its performance in entirely different climatic and soil conditions from which it was developed and its sensitivity to run with a limited amount of data. The model was developed and calibrated for clonal tea grown in the highlands of East Africa. It was applied in a completely different environment in Northeast India without modification to any of the crop parameters except that the daily weather data were fed into the model. The existing clonal parameters were considered based on the paper by Panda et al. (Reference Panda, Stephens and Matthews2003) who modelled the influence of irrigation on the potential yield of tea. Low-resolution input data inevitably limit the potential accuracy of the model output. The model was calibrated in the absence of Indian cultivar information and had to rely on the existing genotypic parameters by simply providing the TRA's daily weather data and modifying the temperature data in the general input parameter file according to Assam conditions. This led to the assumption that the simulated yields obtained from the model should be compared with yields of seedling, clonal and mixed (seedling + clones) tea, since the current genotype information could not be used for a specific Indian cultivar. While running the model, initial assumptions on the shoot population, structure and soil water content were also made. However, in the absence of information on the management practices, it was felt that making further changes to the input parameters was not warranted, although the results gave a better fit.
With the limited amount of available data and given the uncertainties in the starting conditions, a relatively good correspondence between observed and predicted yields could be noticed and the model could predict the first and second flush correctly. This gives an indication of the robustness of the assumptions underlying the model. The model could predict yields under Indian conditions but could not specify it to a particular clone or seedling. Instead, the results were compared for seedling, clonal and mixed tea. In order to simulate yield of a particular cultivar, more precise information needs to be collected and the general input parameter files of the model need to be calibrated according to the Indian conditions, which would then allow to compare more accurately the simulated yields to a single cultivar grown in different areas. The results presented here suggest that the CUPPA Tea model can be used with some confidence on contrasting soil types, genotypes and also on daily, weekly and monthly weather data. Comparing the descriptive statistics results, the CUPPA Tea simulation results also show a yield range of 2000–3500 kg made tea ha−1 thereby giving us an indication that the model results may fit into the Indian conditions. The statistical analysis further shows a positive effect of fertiliser application on tea yield. Although the model does not have a fertiliser application module, yet it assumes ‘adequate’ plant nutrition. The same holds for the incidence of pests and diseases. But still the simulated yields are in close correspondence with the observed yields, suggesting that applied fertiliser rates and crop husbandry are not limiting factors. Nonetheless, inclusion of a fertiliser module in future studies under Indian conditions may give a better prediction compared with the one currently done. Further simulations should also involve both irrigated and non-irrigated tea estates. Rainfall shows a positive effect on tea yield and the simulation results show high yield peaks during July–September when there is adequate rainfall during the flushing season. Therefore, comparing the statistical and simulated results helped us to simulate the model with some confidence using contrasting environmental and management parameters.
For sensitivity analysis, we followed a simple approach in which one parameter was considered at a time and subjecting it to a change of ±1–5% followed by observing their linear dependence. Strong linear dependence was observed. Although there are several other methods, such as Monte Carlo filtering, sampling-based sensitivity, variance-based methods, these methods are more time-consuming and complicated. The results of the sensitivity analysis further show that many of the input parameters do not influence much the resulting yield. This may be due to the absence of some data for the Indian conditions. A limitation of the model at present is its inability to predict the shoot population density, which must be supplied as an input and remains constant throughout the simulation. Soil nitrogen status appears to have a large influence on shoot population density. Stephens and Carr (Reference Stephens and Carr1994), for example, suggest that improved nitrogen nutrition from soil can result in a reduction in apical dominance and a consequent increase in the number of actively growing shoots. Clonal differences in shoot population density are also known to account for large differences in annual yields (Stephens and Carr, Reference Stephens and Carr1990), although there is often a negative correlation between shoot population density and mean shoot weight (Cannell et al., Reference Cannell, Harvey, Smith and Deans1990). Further work is necessary to quantify these effects for inclusion in the model. The next stage could be the integration of a nitrogen nutrition module into the CUPPA Tea model. This will allow investigation of interactions between the two important inputs, i.e. fertiliser and water, and should allow the formulation of rational plans for optimisation and input substitution of any combination of input costs and tea prices.
It is recognised that tea planters have to make strategic and tactical management decisions for improving profitability of their tea business. It is not only important for such decisions to be economically and ecologically sound but it should also be acceptable to all stakeholders. In such a scenario, the CUPPA Tea model (Matthews and Stephens, Reference Matthews and Stephens1998b, Reference Matthews and Stephens1998c) may support decision-making on how to maximise tea yields. However, such models do not have an in-built economic component but a module could be included for economic analysis in the future. During the course of the study, it was also observed that ageing tea plantations could only remain economically viable if uprooting and replanting programmes are followed. Improvement in agronomic practices and proper scheduling of fertiliser applications may result in reducing yield gaps. Regular surveys of soil quality and productivity indicators in representative tea growing areas can support management practices and can reduce the need for inputs such as fertilisers. Use of high-yielding cultivars is another way of reducing the yield gaps. Differences between seedling tea, clonal tea and potential yields are also the indicators for increasing yields through improvements in genotypes and management.
CONCLUSIONS
From this study it is concluded that statistical modelling enables us to extract relevant information from the available data that give an indication of association between different factors affecting tea productivity. The close correspondence between predicted yield and observed yield indicates that the model may be used with some confidence with contrasting soil types, genotypes and also using daily, weekly and monthly weather data. Future research should include studies on soil and plant factors at the field and bush levels. It should also involve studies on the dynamics of productivity and resource use at the plantation level. Experiments on specific Indian cultivars need to be carried out to understand the parameters that affect its growth and yield and these parameters should be incorporated into the CUPPA Tea to parameterise the model to the Indian conditions.
Acknowledgements
The authors would like to thank Dr. Mridul Hazarika, Director, Tea Research Association, for providing the daily weather data and his continuous support during the entire research period. Authors would also like to convey their heartfelt thanks to Mr. Sanjeev Ranjan Borah, Garden Manager, for providing relevant estate data for the model and the analysis for this study.