

Introduction
Even though food history has become a lively field in the last few years (see for instance Claflin and Scholliers, eds., Reference Claflin and Scholliers2012; and Pilcher, ed., Reference Pilcher2012), the historical sequence connecting the long-term changes in diet induced by industrialisation and urbanisation with more recent developments in food consumption remains relatively under-researched. The most powerful analysis of that sequence is probably the historical social science work by Popkin (Reference Popkin1993), Grigg (Reference Grigg1995) and, especially, Malassis (Reference Malassis1997). Relying on a quantitative, international approach, this work has established a chronology that is based on what Malassis, in particular, calls food consumption models (see also Fonte, Reference Fonte2002). According to this chronology, there was a succession of two distinct models of food consumption in the West from the Second World War. The first of these, unfolding approximately between 1950 and 1980, featured mass consumption of industrially processed foodstuffs and led to the generalisation across all social classes of a new kind of diet. This diet featured intakes that were more abundant, more regular, and more diverse, with an increasing role for foodstuffs of animal origin such as meat, eggs and dairy products. This was the kind of diet that, in a socially segmented way, had started to spread with the start of the ‘nutritional transition’ in the mid nineteenth century. The second consumption model, on the contrary, was one in which the intakes of energy and nutrients ceased to grow fast or ceased to grow at all, while consumers started to undertake qualitative substitutions within a rapidly expanding range of alternative products according to criteria related to health, quality, comfort, sociability and leisure. Although food historians are often less explicit in conceptual terms, this portrayal of two distinct food consumption models, with the breaking point from one to another taking place in the 1970s and 1980s, fits well with the argument in some of the main works of synthesis in the field (Montanari, Reference Montanari1996; Fernández-Armesto, Reference Fernández-Armesto2001).
The key to the transition from one model to another would seem to have been the increasing concern that biologically satiated consumers had for the health implications of their food habits, at a time when excessive food consumption seemed to be connected to emergent health problems in affluent societies, such as obesity and increased risks of degenerative diseases. However, since the aforementioned historical social scientists have not aimed at a more detailed explanation, and since few food historians have focused on the recent past, this account is still rather preliminary. This article is therefore organised around two questions that seek to take such analysis further. First, there is the question of whether we can really talk about food consumption models with the characteristics that have been presented above. The second question relates to the nature of the mechanisms leading to the transition between the two models that the literature has identified and that are in a broad sense confirmed by the evidence gathered here. In order to give an answer to these questions, I introduce two novel elements that might also be useful for research focusing on periods, countries and products other than the ones chosen here: first, an explicit definition of the components of a food consumption model, which allows for a systematic, time-consistent measuring of such components; and, second, an evolutionary political economy approach to the analysis of the transition from one model to another.
The article is based on a case study of dairy products, and more specifically on Spain. Milk was one of the key commodities in Western nutritional transitions, as seems to be the case in some contemporary, non-Western transitions, and, with the many processed products that can be obtained from it, might also illustrate the traits of the new consumption model that emerged in the last decades of the twentieth century (Valenze, Reference Valenze2011; Velten, Reference Velten2010; Atkins, Reference Atkins2010; DuPuis, Reference DuPuis2002; Wiley, Reference Wiley2011; Smith-Howard, Reference Smith-Howard2014). Focusing on Spain, on the other hand, brings a Mediterranean perspective to a topic that has often been dealt with from a North-Western European perspective. Precisely at the point when, in the decades after the Second World War, nutritionists turned the so called Mediterranean diet into a real world example of what a healthy diet was, the Southern European countries that had originally been closest to that model completed a nutritional transition that washed away much of that diet. Together with meat, dairy products were crucial in this process (Nestle, Reference Nestle, Kiple and Ornelas2000a; Cussó and Garrabou, Reference Cussó, Garrabou, Germán, Hernández and Moreno2009). Furthermore, another source of interest in the Spanish case is that, as this article will show, the divide between the two consumption models presented above was relatively sharp, making it easier to identify contrasts that shed light on the transition from one to another.
After this introduction, the article is organised in four sections. The first of these presents an overview of trends in the consumption of dairy products in Western Europe. The second section, relying on quantitative evidence constructed from official sources, tracks dairy consumption models in Spain by looking at aggregate trends and at the internal structures of consumption according to product types and consumer segmentations. After having found much to support the argument that there was a succession of two distinct consumption models, the third section relies mostly on qualitative material to analyse the transition that started in the 1980s. Finally, the conclusions in the last section discuss what the case of dairy products in Spain contributes to a more general understanding of food consumption in Western Europe since the end of the Second World War.
An overview of dairy consumption in Western Europe
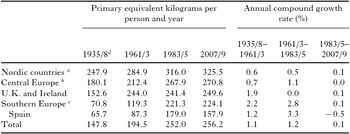
In the decades prior to the Second World War, dairy products, and milk in particular, had already gained a remarkable presence in the Western European diet. The rising purchasing power of consumers, the reorientation of the European agri-food sector towards animal production after the grain invasion of the late nineteenth century, and the emergence of the ‘newer nutrition’ paradigm, with its novel focus on proteins, vitamins and minerals, all favoured a generalised increase in the consumption of milk (Valenze, Reference Valenze2011; Velten, Reference Velten2010). By the late 1930s, there were, however, substantial regional differences (table 1). In the Nordic countries, and also, for instance, in Switzerland, there prevailed a pattern of mass dairy consumption, with consumption spreading across all social classes and regions, in both town and country, taking place at many different moments of the day (Kjaernes, Reference Kjaernes and den Hartog1995; Martiin, Reference Martiin2010; Amilien, Reference Amilien, Atkins, Lummel and Oddy2007; Moser and Brodbeck, Reference Moser and Brodbeck2007). In contrast, in the rest of Western Europe there was a more segmented pattern, which led to lower levels of aggregate consumption. In the United Kingdom and Ireland, for instance, milk consumption among the upper classes was higher than among the lower classes, whereas in France the populations in the northern parts of the country showed levels of consumption well above those in the southern regions (Nelson, Reference Nelson, Geissler and Oddy1993; Burnett, Reference Burnett1999; Crawford, Reference Crawford and den Hartog1995; Hernández Adell, Reference Hernández Adell2012). But it was in Southern Europe that the segmentation of consumption was most pronounced. In Italy, milk consumption was much higher among the upper classes and in the northern regions than among the lower classes and in the southern regions (Chiapparino, Reference Chiapparino and den Hartog1995). In Spain, consumption was relatively high in the tiny strip of Atlantic regions in the north of the country, but much of the population in the rest of the country did not regularly consume any significant quantities of milk (Hernández Adell, Reference Hernández Adell2012; Muñoz Pradas, Reference Muñoz Pradas2011; Pujol et al., Reference Pujol, Nicolau and Hernández2007). Finally, in the extreme case of Portugal, most homes did not regularly consume dairy products either (Freire, Reference Freire2011). All of this, combined with the lower consumption of butter stemming from the availability of alternative vegetable fats such as olive oil, led to Southern European populations consuming little dairy produce by the outbreak of the Second World War.
Consumption of dairy products in four groups of Western European countries

Notes: a Denmark, Finland, Norway and Sweden; b Austria, Belgium, France, Germany, Netherlands and Switzerland; c Greece, Italy, Portugal and Spain; d Butter not included.
Sources: 1935/8: Toutain (Reference Toutain1971: 1955), complemented by Angus Maddison (<http://www.ggdc.net/maddison/orrindex.htm>); rest of dates: Faostat (<www.faostat.fao.org>),
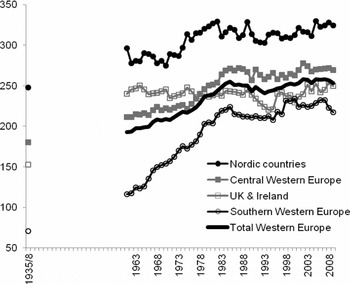
A mass consumption model was consolidated during the war and the two or three decades that followed. The rapid increase in the purchasing power of consumers in an era featuring accelerated economic growth and declining social inequality, the expansion in the production capacity of the dairy chain which came to be increasingly coordinated by its manufacturing node, and the persistence of a scientific and cultural milieu that praised milk as part of a healthy diet led to increased consumption among all social strata (Nelson, Reference Nelson, Geissler and Oddy1993; Burnett, Reference Burnett1999; Toutain, Reference Toutain1971). This growth was particularly striking in Southern Europe, where the social and territorial patterns of consumption that were still prevalent during the early post war years rapidly disappeared (Chiapparino, Reference Chiapparino and den Hartog1995; Felice, Reference Felice and Bertagnoni2004). The result was a clear convergence with the rest of Western Europe (figure 1).
Consumption of dairy products (primary equivalent kilograms per person and year) in four groups of Western European countries
Sources: See Table 1.

In the meantime, however, the rest of Western Europe was starting to move in a different direction. Increasingly affluent and satiated consumers were beginning to abandon whole milk because its high fat content could contribute to excess weight and obesity. Many consumers shifted to low-fat milks, but others reduced their consumption of any liquid milk. As a result, total milk consumption started to decline. In some countries, such as the Netherlands, the fall began in the 1950s, but in most cases it occurred in the 1970s after a short prelude of stagnation. Milk consumption has not stopped declining since, affected not only by concerns over weight but also by the spread of messages that, reflecting the shift from the ‘newer nutrition’ to the ‘negative nutrition’ paradigm (see Biltekoff, Reference Biltekoff and Pilcher2012), have linked the consumption of milk to a higher risk of cardiovascular diseases (den Hartog, Reference den Hartog1992; Buss, Reference Buss, Geissler and Oddy1993; Burnett, Reference Burnett1999; Fenton, Reference Fenton and den Hartog1995; Kjaernes, Reference Kjaernes and den Hartog1995; Teuteberg, Reference Teuteberg, Baudet and van der Meulen1982; Hietala, Reference Hietala and den Hartog1995; Velten, Reference Velten2010).
In contrast, the consumption of dairy products other than milk has not stopped growing. This has been the result of increases in more or less traditional goods, such as butter, well-known national cheeses or natural yoghourts, but an even more striking factor has been the rise in consumption of new products such as imported cheeses, ice creams, yoghourts with fruits or added flavours and a very diverse array of other refrigerated desserts (Buss, Reference Buss, Geissler and Oddy1993; Laisney, Reference Laisney2012; den Hartog, Reference den Hartog, Schärer and Fenton1998; Felice, Reference Felice and Bertagnoni2004; Spiekermann, Reference Spiekermann2009). This reorientation of dairy consumption was apparently led by the middle and upper classes, as well as by young adult populations. By the late twentieth century, these groups of consumers reached aggregate levels of dairy consumption that were broadly similar to those of the lower classes or older populations, but did so through a product mix with a higher proportion of low-fat milks and products other than milk (Collantes, Reference Collantes2015a).
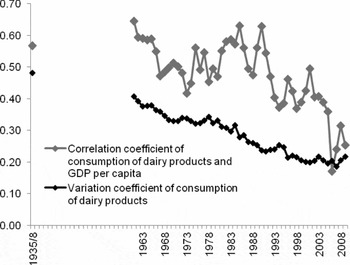
The combination of these opposite trends for milk and for the rest of dairy products seems to have resulted in aggregate stagnation from the 1980s, which contrasts to persistent growth in emerging economies such as China or India (Wiley, Reference Wiley2011). It is true that stagnation has frozen the relative position of each of the regions, with the Nordic countries clearly above the average and the Mediterranean countries below. But the dispersion of consumption levels has steadily declined, as had already been the case during the previous decades (figure 2). Furthermore, the international differences that do persist no longer hold a close connection to each country's income level. Before the Second World War, and particularly by the early 1960s, just before Southern Europe's final move towards mass consumption, there was a solid link between low levels of dairy consumption and economic backwardness, but this link started to weaken in the 1960s and early 1970s and has become of little relevance from the 1990s.
Consumption of dairy products in Western Europe: correlation with gross domestic product per capita and dispersion
Sources: Consumption, see Table 1; GDP per capita: Angus Maddison (<http://www.ggdc.net/maddison/orrindex.htm>, 1935/8–2008) and World Bank (<data.worldbank.org>, 2009).

Tracking models of dairy consumption in Spain
Before going into a more detailed analysis of the Spanish case, it may be useful to define the notion of a food consumption model. A food consumption model is a structure that emerges and unfolds through time, finding some internal coherence in the combined evolution of a given set of consumption patterns. Although Malassis (Reference Malassis1997) does not offer a systematic presentation of the variables composing his models of food consumption, both his work and the broader literature cited in the introduction suggest that the focus should be on the evolution of three groups of patterns. The first group is of aggregate levels of consumption. The second relates to the structures of consumption according to: the biological origin of foodstuff, such as products derived from cereals versus those from livestock; their degree of industrial processing, such as processed versus unprocessed products; and the practices involved in their consumption, particularly domestic versus extra-domestic consumption. The third group is of the segmentation patterns among consumers depending on income and social class, to which we might add whatever other variables that shape systematic deviations from average consumption levels (see Collantes, Reference Collantes, Gallego, Germán and Pinilla2015b, for further conceptual elaboration that links consumption models to evolutionary economics). This article will now explore these three groups of patterns for the case of dairy products in Spain.
Trend, composition and segmentation
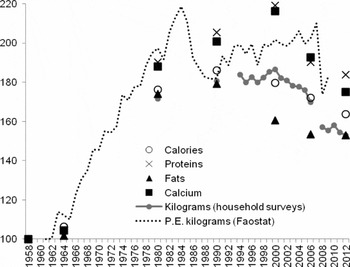
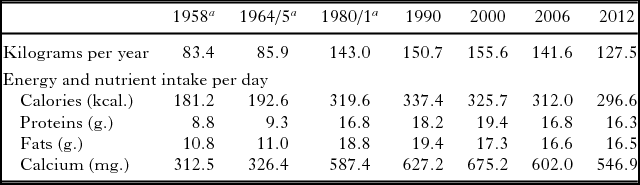
A look at the trend of aggregate dairy consumption in Spain since the late 1950s reveals the existence of a turning point around the 1980s (figure 3). During the first part of the period, and especially from the mid-1960s to 1980, the consumption of dairy products grew very fast. Growth became much slower during the 1980s, and from the 1990s signs of contraction began to accumulate. First there was a fall in the dairy-related intake of calories and fats and later on decreases in the intake of proteins, calcium and kilograms of dairy products (table 2). According to any of these indicators, the contemporary Spanish consumer has eventually returned to aggregate levels of consumption that are below those of 1980 (see Collantes, Reference Collantes2014, for a more detailed review of the evidence).
Per capita consumption of dairy products in Spain, 1958 = 100
Sources: See supplementary online material.

Per capita consumption of dairy products in Spain

Note: a Domestic consumption only.
Sources: See supplementary online material.
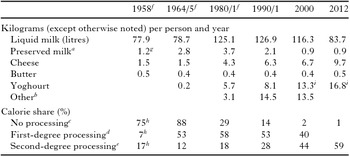
The product composition of consumption also suggests two distinct trajectories of structural change before and after the 1980s (table 3). Before 1980, structural change was mostly internal to the main item of consumption: liquid milk. In the 1950s, most of the milk consumed in Spain was raw, unprocessed milk, and most of the milk that did undergo some processing was powdered and condensed rather than liquid milk. Raw milk still held a far from unimportant albeit decreasing market share during the following two or three decades, but it was pasteurised and sterilised, that is, processed liquid milk that led the accelerated expansion that took place until 1980 (Collantes, Reference Collantes2014). During this period, however, there was some stability in liquid milk's strong predominance over second-degree processed products such as cheese, butter or yoghourt.
Breakdown of consumption according to types of dairy products

Notes: a Evaporated, concentrated, condensed and powdered milk; bMostly milk and yoghourt shakes, ice creams and refrigerated deserts other than fermented milk; cRaw milk; dPasteurized, sterilized and preserved milk; eCheese, butter, yoghourt and all other dairy products; fDomestic consumption only; gCondensed milk only; hc. 1950; iIncludes all fermented milk.
Sources: See supplementary online material.
It was from the 1980s that second-degree processed products replaced processed milk as drivers of consumption growth (Collantes, Reference Collantes2014). In fact, milk consumption has been falling steadily since the 1990s, while second-degree processed products have become one of the most dynamic segments in the Spanish food market. This has been largely related to an unprecedented expansion in the variety of (standardised) products that are consumed: while by the early 1980s traditional, hard-paste cheese and natural yoghourt accounted for a substantial share of consumption in this area, over the course of the last three decades there has been an extraordinary proliferation of alternatives, particularly for refrigerated desserts following the successive introduction of flavoured yoghourts, yoghourts with fruit bits, fat-free yoghourts, custards, flans, fermented milk other than yoghourt including milk fermented with probiotics, and dairy products with polyunsaturated fat acids.
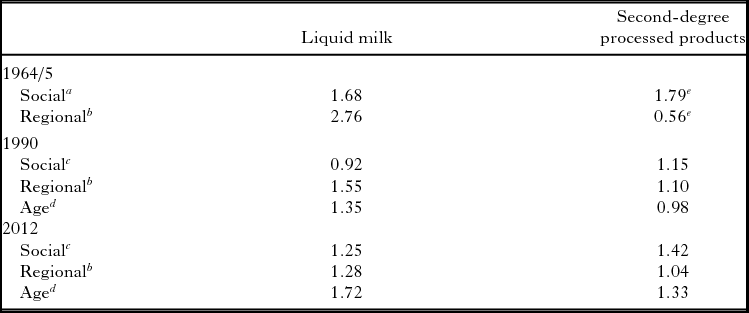
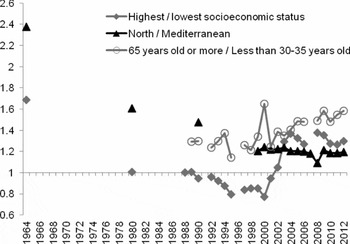
The pattern of change is less clear when it comes to the distinction between domestic and extra-domestic consumption. On the one hand, an increasing share of consumption outside the home would seem a trait of the new era that started to take shape in the 1980s (table 4). On the other hand, consumption outside the home has proved to be highly sensitive to the major economic and social crisis that started in 2008, falling to levels that are not currently very different to those of a quarter-century ago. In short, it is not evident that an increasing role for extra-domestic consumption is one of the structural components of a new consumption model. On the contrary, an analysis of the segmentation pattern of consumption according to social, territorial and demographic variables once more reveals a structural contrast between the earlier and the later parts of the period (figure 4). In the already classic vocabulary of consumption studies for the decades after the Second World War, the early part of our period could be said to be a time of massification (Collantes, Reference Collantes2015a). Still by the mid-1960s, milk consumption was much more widespread among the higher classes than it was among the lower classes, and an even larger gap could be found between the tiny strip of Atlantic regions in the north of the country, where, at a time when dairying was largely dependent on organic, locally grown feed, high rainfall levels had favoured a clustering of much of Spain's dairy farming, and all the other regions where the agricultural economy was more oriented towards cereals, wine, olive oil, fruits or horticulture. But, only fifteen years later, around 1980, consumption was nearly identical among different status groups and regional differences had become substantially smaller. This trend towards the erosion of the initial segmentation pattern would even go on during the last two decades of the twentieth century, not only through the steady reduction of regional disparities but also, and more strikingly, through the conversion of milk in a product that was more abundantly consumed by the lower classes (table 5).
Consumption of dairy products outside the home

Sources: See supplementary online material.
Segmentation ratios in the domestic consumption of dairy products

Notes: a Ratio of per capita consumption in homes belonging to the highest income quartile to homes belonging to the lowest income quartile; b Ratio of per capita consumption in the North region (Asturias, Basque Country, Cantabria and Galicia) to the Mediterranean region (Balearic Islands, Catalonia, Murcia and Valencian Community); c Ratio of per capita consumption in homes belonging to the highest status quartile to homes belonging to the lowest status quartile; d Ratio of per capita consumption in homes headed by a person who was older than 64 to homes headed by a person who was younger than 35; e Cheese only.
Sources: See supplementary online material.
Socioeconomic, regional and demographic disparities: relative levels of consumption of dairy products (kilograms per person and year)
Sources: See supplementary online material.

A different pattern of segmentation, however, emerged at the turn of the century (Collantes, Reference Collantes2015a). This comprised two elements. First, a social gap between high- and low-status groups reappeared, especially for the second-degree processed products that were playing such a crucial part as drivers of consumption growth. Although the social gap is not as large as it was once for liquid milk, it is noteworthy if we realise that income is now much higher and inequality lower, so that much more favourable conditions prevail for the spread of any new item of consumption. A second element of the new segmentation pattern was demographic, with younger populations showing consumption levels substantially below those of older populations. The decrease in liquid milk consumption, in particular, was clearly led by younger populations, in contrast to older populations whose consumption levels were falling more slowly.
Two consumption models: a discussion
In response to the first question posed in the introduction of whether we can talk about two distinct food consumption models as proposed by the literature, the answer is basically, yes. The first model unfolded between 1950 and the 1980s and, in some ways, consisted of the culmination of a trend that had started in the early twentieth century but had been halted by the Civil War and its aftermath: the incorporation of liquid milk into the regular diet of Spaniards. By the mid-1960s this process was still hampered by persistent social and territorial segmentations in consumption, the culmination of which in the years up to the 1980s was parallel to a substantial reorientation of consumption from raw to processed milk. The second model started to take shape in the 1980s as milk consumption started to decrease, but gained fuller internal coherence after around the year 2000, when all, rather than just some, of the aggregate dairy consumption indicators started to fall; when second-degree processed products, including an increasing variety of cheeses and refrigerated desserts, became dominant rather than just emergent; and when the success of these products opened up a new gap between the upper and lower classes which became a major part of a new segmentation pattern comprising significant age contrasts among consumers as well.
While there may be some chronological peculiarities in the Spanish case, this is not significant. Yes, the spread of milk consumption took place more slowly than in the typical Western European country, and the shift in the model started at least one decade later than was common in Western Europe. However, this chronological qualification is already present in previous works (Malassis, Reference Malassis1997; Grigg, Reference Grigg1995), which have credibly put it in relation to economic backwardness and, it might be added, higher levels of social inequality. More substantially, two new variables emerge as more relevant to the characterisation of both consumption models than has been argued so far. In the case of the first model, massification was not only about the erosion of social class differences as lower-status groups accessed higher income levels; it was also, and perhaps more fundamentally in the case of dairy products in Spain, about the mitigation of regional differences. This in turn resulted from the creation of an agribusiness-led dairy chain that was able to decouple consumers from the degree to which environmental conditions in their territory were suited to the production of milk (Collantes, Reference Collantes2015a). Although this does not necessarily put into question the traditional association between nutritional transition and industrialisation, it highlights the often overlooked supply-side underpinnings of that association, in line with, for instance, Fine's (Reference Fine2002) insistence on ‘systems of provision’.
When it comes to the second model, and while it is not evident that a trend towards increasing consumption outside the home is one of the latter's central elements (in contrast to, at least in this case, Malassis, Reference Malassis1997), the relevance of age as a factor of segmentation is remarkable. This may not be a radical novelty for some specialists on dairy consumption (Wiley, Reference Wiley2011) or food sociologists (Miele, Reference Miele, Cloke, Marsden and Mooney2006), but, should this variable be as relevant for other cases as it has been here, it would probably deserve a more prominent role in the characterisation of the current model. In addition, this need not imply that, as is often argued in social science literature (Miele, Reference Miele, Cloke, Marsden and Mooney2006; Fonte, Reference Fonte2002), there is an ongoing historical trend towards the ‘de-hierarchicalisation’ of food consumption. In this case, there was instead a new outbreak of class-based segmentation, in particular in relation to the most novel and dynamic products, in line with the findings of food historians such as Fernández-Armesto (Reference Fernández-Armesto2001).
One last qualification that the case of dairy products in Spain brings to the more general picture is that, rather than the uninterrupted sequence of coherent periods proposed by scholars such as Malassis (Reference Malassis1997) or Popkin (Reference Popkin1993), there was a punctuated sequence in which two more or less coherent models were separated from one another by a transition period combining elements from both and, therefore, featuring a lower degree of internal coherence. This punctuated view brings the historical study of food consumption models closer to the kind of view that is common in both historically grounded approaches to economics and sociology (see for instance Freeman and Louça, Reference Freeman and Louça2001, and Magnan, Reference Magnan and Pilcher2012) and evolutionary socio-economic history (Lloyd, Reference Lloyd2002). It is to this issue of transition, rather than the internal development of each of the models, that the rest of the article turns, and it does so drawing freely from one such approach: evolutionary political economy.
An evolutionary perspective on transition: nutritional paradigms, the dairy chain, and consumer agency
Neoclassical economics, which basically relates consumer behaviour to the evolution of consumer income and commodity prices, can surely contribute to explaining the internal development of each of the two models. The massification of milk consumption during the 1960s and 1970s, for instance, seems closely linked to an extraordinary increase in consumer income, just as the further diversification of consumption towards highly processed products with high ratios of price to nutritional value was favoured by another wave of increase in consumer income after 1985 (Carreras et al., Reference Carreras, Prados de la Escosura, Rosés, Carreras and Tafunell2005). It is also likely, even in the absence of specific research, that the making of a modern dairy chain, initially led by a small number of industries and subsequently by large retailers, exerted a strong downward pressure on the relative price of dairy products, thus reinforcing the income effects alluded to above (Langreo, Reference Langreo1995, Reference Langreo2005).
However, neoclassical economics, with its focus on individual optimisation under stable preference structures, has little explanatory power in relation to the rupture that led from one consumption model to another. The shift from a highly expansive consumption model to an eventually contractive one took place in parallel to increases in consumer income and probable decreases in relative dairy prices, which suggests that the key to the shift was a profound reshaping of consumer preferences. In fact, mainstream econometric modelling based on the implicit, unexamined assumption of stable preferences drastically failed in predicting the evolution of Spanish milk consumption even in the short run during the 1990s. Precisely when consumption was about to start to fall significantly, these models predicted that consumption, supposedly stimulated by further increases in consumer income, would continue to grow (see Briz et al., Reference Briz, Ward and de Felipe1999).
The topic of change in consumer preferences can be approached from the perspective of evolutionary economics as originally proposed by Veblen (Reference Veblen1898). In a way that today stands closer to mainstream sociology than to mainstream economics, Veblen stressed cumulative change in the structural conditions that define the field for individual action, rather than juxtaposition of individual decisions based on constrained optimisation, which led him to take institutions, broadly defined as ‘habits of thought’, as the central unit of socio-economic analysis. This is the sense in which consumer preferences can be understood as an institution that evolves cumulatively through time. Following one of the basic points in the evolutionary agenda, such evolution is not teleological or predictable, since it results from a historically contingent combination of variables coming from selection environments that are relatively autonomous from one another (Freeman and Louça, Reference Freeman and Louça2001). As it has been presented in the introduction, the literature has so far focused mainly on one of these selection environments, the one related to nutritional science and nutritional discourse. This is not unfounded, but a more realistic explanation includes other environments, such as those related to the food chain and consumer agency, as well.
From ‘newer’ to ‘negative’ nutrition
It was in the 1980s, with some lag in relation to other Western societies, that the transition from the ‘newer nutrition’ paradigm to the ‘negative nutrition’ paradigm started in Spain. This was to have major consequences, indeed, on the social image of dairy products. During the 1950s, 1960s and 1970s, nutritional discourse in Spain had insistently praised dairy products, and milk in particular, as an essential part of any complete and what was by then regarded as a modern diet. This had started in the late nineteenth century in a mostly bottom-up, local fashion, but now intensified. Physicians who praised the health benefits of consuming milk were often present in the increasingly influential mass media, while Francisco Franco's highly centralised, authoritarian state actively supported the spread of positive nutritional messages about milk. A number of public initiatives were promoted in order to foster the consumption of milk, such as school milk schemes, monographic informational events, posters in cities, films and essay prizes in schools. Milk also occupied a prominent role in broader programmes of nutritional education that were developed during these years and that, anecdotally but tellingly, stressed the need to drink milk even if its taste was not pleasant for the consumer or if the subsequent digestion process was problematic (REL, 1958; Díaz Méndez and Gómez Benito, Reference Díaz Méndez and Gómez Benito2010; Trescastro et al., Reference Trescastro, Galiana, Pereyra, Moncho, Nolasco and Bernabeu2014; Vivanco et al., Reference Vivanco, Palacios, García and López1976).
These demand side measures were combined with heavy public intervention in the dairy chain since 1952. In order to ensure a regular supply of unadulterated milk in the country's main cities, the state granted local monopolies for the production of pasteurised milk and fixed transference prices along the whole chain linking farmers to consumers. The Franco state did not abandon its enthusiastic propaganda in favour of milk consumption even when this supply side intervention was largely failing to meet its objectives, before the mid-1960s, thereby making the failure of dairy policy more relevant to public opinion (see for instance REL, 1960).
From the 1980s, however, whole milk became one of the Trojan horses of ‘negative nutrition’ in Spain. What until then had been regarded as a complete food that could not be missing in any modern diet, now became a dangerous source of weight and health problems. This message, which had originated in the international scientific community in the late 1960s, became influential among Spanish consumers once consumption of whole milk had attained massive proportions. The message may have arrived a bit later than in other countries, but it probably encountered less resistance from actors in the dairy chain. In countries such as Norway and the United States, the existence of a tradition of extensive collaboration between state agencies and dairy organisations in areas such as market regulation and promotional campaigns was clearly detrimental to the spread of the new scientific messages surrounding milk (Kjaernes, Reference Kjaernes and den Hartog1995; Nestle, Reference Nestle2000b; Wiley, Reference Wiley2011). In Spain, on the contrary, the Franco state relied on a more bureaucratic, top-down approach, which led to a dairy chain in which farming and agribusiness interests were weakly articulated and a low level of organisational density prevailed. Significantly, it was not until well into the 1990s that an inter-professional organisation articulating the interests of both farmers and processors was created (Langreo, Reference Langreo and Domínguez1997).
Enter profit-making strategies in the dairy chain
At a time when the newly established democratic state kept a lower profile than Franco's in influencing consumer preferences in dairy products, the advertising campaigns of milk processors were a major vehicle for the spread of the new messages, and of the anxieties associated with them. Perhaps the most successful of these was the campaign by the Pascual corporation. With its slogan ‘Pascual milk helps you not get fat’ and its visual associations of skimmed milk consumption with a healthy lifestyle, Pascual based the lure of its skimmed milk on an implicitly negative message about whole milk (for instance, ABC, 2nd April 1985, p. 96). It is interesting to note that, even if more specific health concerns found their way into the advertising discourse, the main consumer anxiety that the advertisements addressed was not the risk of future degenerative disease, but the risk of weight gain and a deteriorating physical image. In fact, although low-fat milk eventually became common among both male and female consumers, it was female consumers, exposed to stronger social pressures to keep their bodies thin, who embraced the new product more enthusiastically (Comunidad de Madrid, 2001; Contreras and Gracia, Reference Contreras, Gracia, Díaz Méndez and Gómez Benito2008).
The profit making strategies of dairy companies were also crucial in shaping the other major axis of transformation in the consumption model: the rise of second-degree processed products led by relatively high status consumers. After the massification of liquid milk consumption, the leading firms of Spain's dairy sector increasingly shifted to second-degree processing, introducing the many product innovations discussed in the previous section. Because second-degree processed products had played a modest part in the previous consumption model, they now seemed to have a potential for greater demand expansion than liquid milk. They also allowed processors to retain higher profits at a time when large retailers were starting to absorb much of the profit that had traditionally been in the hands of manufacturers by the launching of supermarket own-brands and, more broadly, by selling liquid milk below cost price as a hook to attract consumers, a practice that Spanish law permitted until as late as 1996. In order to shape consumer preferences, leading firms such as Danone, Pascual and Puleva implemented large-scale advertising campaigns that focused mainly on the health benefits of their newly available skimmed yoghourts and milks fermented with probiotics. These products had relatively high-added value, from the industry point of view, and were relatively expensive, from the consumer point of view, and this favoured the eventual start of a new cycle of status based segmentation (Langreo, Reference Langreo1995, Reference Langreo2006; Díaz Méndez and González, Reference Díaz Méndez, González, Díaz Méndez and Gómez Benito2008).
This is partly in line with the Marxist approach linking the evolution of food consumption to a broader process of reproduction of the food chain (for instance, Fine, Reference Fine2002). Dairy processors were indeed central not only in the production of the cluster of new products that would form the material basis of a new consumption model, but also in the production of the social images associated with such products. This does not mean, however, that we should replace the neoclassical ideology of consumer sovereignty by a determinism of producer sovereignty (see Hamilton, Reference Hamilton, Belasco and Horowitz2009, for related criticism on food chain scholarship).
Bringing taste back in
Consumer decisions were taking place within a cultural milieu that was influenced by structural changes in nutritional discourse and the dairy chain but was also affected by autonomous impulses from consumers. Not all consumers, for instance, reacted in a similar way to the spread of new messages and social images in relation to milk. Younger populations were more sensitive, whereas older populations tended to maintain preferences that had been formed under the widely different cultural conditions of the previous era. This led to age becoming the main factor in the segmentation of milk consumption, as we saw in the previous section, and turned mere generational change into a powerful force of consumption decline over time. But the room for agency was particularly visible in the helplessly idiosyncratic relationship that consumers had with dairy products in terms of taste and pleasure. The messages coming from the negative nutrition paradigm undoubtedly underpinned the end of the long phase of growth in milk consumption, but market studies conducted at the turn of the century showed that many consumers found milk tasteless or even intrinsically unpleasant (Barreiro et al., Reference Barreiro, Losada and Ruzo2001). This may have resulted from a number of factors, from the hegemony of Ultra High Temperature (UHT) technology among processors, which had a much stronger impact on milk's taste than traditional pasteurisation, to the fact that biological rates of lactase persistence were not particularly high in Spain by European standards (Patterson, Reference Patterson2000). Aimed at consumers who did not hold a high regard for milk's taste, the ambitious advertising campaigns implemented by processors were only able to stimulate a partial substitution of whole milk with lower fat milks. Skimmed milk, for instance, was perfectly compatible with the prescriptions of negative nutrition, but many consumers originally reacted against its poor taste. A few years later, and from the 1990s in particular, consumers came to find in semi-skimmed milk a compromise between their conflicting desires on the one hand to avoid health complications and a deterioration of their physical attractiveness, and on the other to still enjoy the taste of milk. But the rise of semi-skimmed milk, which is today clearly dominant, was not enough to compensate for the steep fall that eventually took place in the consumption of whole milk (Collantes, Reference Collantes2014).
In fact, the substitution of high-fat products for their low-fat alternatives was not a structural component of the new consumption model (as in Popkin, Reference Popkin1993) as much as a trend that was most important during the transition period between both models. Over the last three decades, Spanish consumers have clearly reduced their dairy related fat intake, but, while in the latter part of the twentieth century they did so by substituting high-fat products for their low-fat equivalents, particularly whole milk for semi-skimmed milk, in the early twenty-first century the average fat content of dairy consumption has even increased (table 6). Much of this is related to cheese, which today accounts for nearly forty per cent of the dairy related fat intake. The consumption of an ever wider variety of Spanish and foreign cheeses has been persistently on the rise even though many have a very high fat content. In short, the unsettling messages about negative nutrition were much less influential on consumer behaviour when they were about tasty, intrinsically attractive products such as cheese than when they concerned UHT milk.
Annual compound rates of change in fat intake associated to dairy products

Sources: See supplementary online material.
The consumer therefore emerges as a manager of the tension between the suggestions of nutritional scientists or agribusiness marketers and their own inclinations in terms of taste, pleasure or social expression (in line with Levenstein, Reference Levenstein, Flandrin and Montanari1999, or Spiekermann, Reference Spiekermann2009) rather than as a mechanical executor of those suggestions. And, rather than resulting directly from changes in nutritional paradigms or in profit making strategies within the dairy chain, the shift from one dairy consumption model to another emerges as the result of the historically contingent, not teleological (in the sense of Veblen, Reference Veblen1898) interaction between both trajectories of structural change and consumer agency.
Conclusion
Through a case study of dairy products in Spain, this article has provided qualified support for two of the main ideas that structure our current understanding of the evolution of food consumption in the West from the Second World War. First, we can find two distinct consumption models: the first of these, until around the 1980s, was an expansive model leading to the social generalisation of a diet rich in industrially processed foodstuffs and foods of livestock origin; the second model featured the stagnation and eventual contraction of aggregate intakes, intense renovation and sophistication in the kind of foodstuffs consumed, and the emergence of a new pattern of segmentation. The second idea is that changing nutritional paradigms and consumer concerns were crucial to the transition that started in the 1980s: as had previously been the case in other Western countries, affluent and physically satiated consumers became receptive to ‘negative nutrition’ recommendations. This was in contrast to most developing societies, in which some sort of nutritional transition led by older, ‘newer nutrition’ ideas went on. Although these developments unfolded in Spain later than in most Western countries, the direction of change was basically similar.
This article, however, has also suggested a number of qualifications, extensions and discrepancies in relation to the state of the art. At least in our case study, the massification of the first period was not merely social, but also territorial. One implication of this is that, even though massification has been commonly explained as a result of consumer income growth during the extraordinary expansion of Western economies in the decades after the Second World War, we should also pay attention to transformations in the supply side, particularly to the making of an agribusiness led food chain capable of decoupling consumers from the constraints imposed by local, organic agrarian systems. On the other hand, the characterisation of the second consumption model might benefit from a more explicit consideration of age as a factor of consumer segmentation, which, contrary to the sometimes prematurely accepted hypothesis of the ‘de-hierarchicalisation’ in food consumption, has proved to be compatible with an eventual reopening of the gap between higher and lower status groups. The evidence in this case study also questions whether consumption outside the home was as essential an element in this new consumption model as has sometimes been suggested.
Finally, a more complex view of the transition between both models has been proposed. Complex, in the first place, because, rather than an uninterrupted sequence of internally coherent periods, a punctuated sequence has been found in which a transition period, in this case the last two decades of the twentieth century, combined influences derived from both the decomposition of the first model and the emergence of the second. And complex, too, because the shift in the model was driven by a transformation in consumer preferences. The explanation of this requires consideration of the evolution of nutritional paradigms; the changes in profit making strategies within the food chain, which comprise, but cannot be reduced to, the capitalisation of nutritional discourse; and the way in which both trajectories of structural change interact with consumer agency, especially in relation to the taste and pleasure that consumers obtain from eating and drinking.
Supplementary material
The supplementary material referred to in this paper can be found online at journals.cambridge.org/RUH/10.1017/S0956793315000060
Acknowledgements
I gratefully acknowledge the comments made by the anonymous referees and the participants at the 2014 meeting of the Agricultural History Society and the 2015 UNED workshop on food studies, especially Shane Hamilton and Mabel Gracia. Thanks also to Peter Atkins, Melanie DuPuis, Emanuele Felice, Carin Martiin, Peter Moser, Kendra Smith-Howard, Eva María Trescastro and Andrea S. Wiley for their generous help, and to Albert Hererria for his careful revision of my English. Funding was provided by the Government of Spain (ECO2012-33286) and the regional Government of Aragón (269.161/3).