


Introduction
In the Arctic Ocean the ocean–atmosphere heat, momentum and gas exchanges are controlled by the sea-ice thickness distribution. Thin ice with a thickness of <0.5 m produces strong heat and salt fluxes and affects the weather and deep water circulation in the Arctic. Spaceborne remote sensing of sea-ice thickness can be conducted based on Archimedes’ law and satellite radar or laser altimeter measurements of freeboard (Reference Laxon, Peacock and SmithLaxon and others, 2003; Reference Kwok and RothrockKwok and Rothrock, 2009). However, this method results in large relative errors for thin ice (Reference Laxon, Peacock and SmithLaxon and others, 2003). Passive microwave radiometer data at frequencies of 19, 37 and 85 GHz have been used to estimate thickness of thin ice up to 10–20 cm based on correlation between ice surface salinity (i.e. dielectric properties) and ice thickness (Reference Martin, Drucker, Kwok and HoltMartin and others, 2004; Reference Nihashi, Ohshima, Tamura and Fukamachi Yand SaitohNihashi and others, 2009; Reference Singh, Oza, Vyas and SarkarSingh and others, 2011; Reference Tamura and OhshimaTamura and Ohshima, 2011). However, Reference Nihashi, Ohshima, Tamura and Fukamachi Yand SaitohNihashi and others (2009) showed that at least 37GHz data cannot detect thin ice when that ice is covered with snow. Reference Kaleschke, Tian-Kunze, Maaß, Mäkynen and DruschKaleschke and others (2012) demonstrated that lower-frequency L-band radiometer data from the Soil Moisture and Ocean Salinity (SMOS) satellite can be used to retrieve sea-ice thickness up to 0.5 m. The major drawbacks are the coarse resolution of the radiometer data, grid size of 12.5–35 km, which prevents detection of smaller leads and polynyas, and the currently poorly known effect of snow cover on the thin-ice thickness estimation.
Correlation between sea-ice thickness and synthetic aperture radar (SAR) data has also been studied. For the Baltic Sea it was demonstrated that thickness estimation of deformed ice under dry snow conditions is possible through a statistical relationship between the ice freeboard and the radar backscatter (Reference Similä, Mäkynen and HeilerSimilä and others, 2010). The variance of the mean freeboard, i.e. large-scale surface roughness, increases with increasing mean freeboard, and, as the surface roughness increases, the backscatter also increases. Reference Nakamura, Wakabayashi, Uto, Naoki, Nishio and UratsukaNakamura and others (2006) found good correlation between the L- (0.87) and C-band (0.80) co-polarization ratio and the thickness of undeformed ice in the Sea of Okhotsk. Good correlation has also been found between Antarctic first-year pack-ice and fast-ice thickness and the C-band co-polarization ratio (Reference Nakamura, Wakabayashi, Uto, Ushio and NishioNakamura and others, 2009). The co-polarization ratio has little sensitivity to ice surface roughness and is related to variations in salinity, i.e. ice surface dielectric constant, that can be caused by changes in ice thickness (Reference Wakabayashi, Matsuoka, Nakamura and NishioWakabayashi and others, 2004). Airborne C-band polarimetric SAR data together with a theoretical backscattering model have been used to estimate ice thickness in the 0–10 cm range (Reference Kwok, Nghiem, Yueh and HuynhKwok and others, 1995). SAR-based methods for thin-ice thickness retrieval are still experimental, and no operational products are yet available.
The final option for spaceborne thin-ice thickness (h i) estimation is based on the ice surface temperature, T s, from satellite thermal imagery and the ice surface heat balance equation (Reference Yu and RothrockYu and Rothrock, 1996). Major assumptions here are that the heat flux through the ice and snow is equal to the atmospheric flux, and snow and ice temperature profiles are linear. This method is based on the physical relationship between T s and hi and is well established in the literature. In addition, the microwave radiometer hi estimation methods at frequencies of 19, 37 and 85 GHz are based on regression between the radiometer data and T s-based h i. The spatial resolution of T s-based hi charts is ∼1 km, which is fine enough for detection of all polynyas and leads with equivalent width. Drawbacks here are the need for external atmospheric forcing data and cold cloud-free conditions.
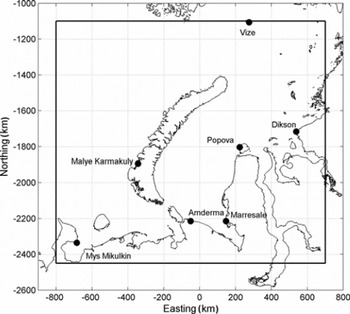
Here we study hi retrieval using Moderate Resolution Imaging Spectroradiometer (MODIS) thermal imagery, and conduct detailed analysis on the accuracy of the retrieved hi under different air temperature (T ä) regimes in the Arctic. The study area includes the Kara Sea and the eastern part of the Barents Sea (Fig. 1). The external forcing data for solving the surface heat balance come from a numerical weather prediction (NWP) model, HIRLAM (High Resolution Limited Area Model) (Reference KallénKällen, 1996; Reference UndénUndén and others, 2002). The hi estimates are obtained only from night-time MODIS data. Thus, the uncertainties related to the effect of the solar shortwave radiation and surface albedo are excluded. Snow vs ice thickness parameterization needed in the hi retrieval was estimated from climatology and Russian Sever data (NSIDC, 2004). The cloud masking of the MODIS data was conducted using three spectral cloud tests and manual methods. Our MODIS hi chart collection spans three winters (November-April) in 2008–11 with 199 charts.
Barents and Kara Seas study area for MODIS-based ice thickness retrieval. Rectangle shows the area, and dots are weather stations. Polar stereographic coordinates with mid-longitude of 63E.
The accuracy of the retrieved hi is studied in the following ways:
-
1. Using estimated or guessed standard deviations and covariances of the input variables to the hi retrieval, the h i uncertainty is estimated with the Monte Carlo method. The accuracy of the HIRLAM data is studied by comparing them to coastal weather station data.
-
2. Thickness charts from consecutive days are compared to each other. Large differences are mainly due to the cloud-masking errors and HIRLAM data inaccuracies.
Method 2 has not been used in previous studies. Unfortunately, we do not yet have any in situ thickness data for the h i validation. As another new method, the typical maximum reliable hi under different T a ranges is determined using not only the results from (1), but also the empirical mean T a — T s vs hi curves, which show how rapidly hi changes as a function of a slight change in T s or T ä. We compare our hi accuracy results and limits for the maximum reliable hi to previous studies.
Unlike some previous studies (e.g. Reference Yu and RothrockYu and Rothrock, 1996; Reference TamuraTamura and others, 2006; Reference Wang, Key and LiuWang and others, 2010), we use here for the first time a large MODIS dataset (nearly 200 swath images) combined with numerical weather forcing data (HIRLAM) for the hi retrieval and accuracy analysis of h i. We obtain uncertainty values for the weather forcing data by comparing them to the in situ weather data instead of using ‘best-guess’ values as in Reference Yu and RothrockYu and Rothrock (1996) and Reference Wang, Key and LiuWang and others (2010). For the first time, we present h i uncertainties and maximum reliable h i values under different T a and wind-speed ranges. In determining the maximum h i we take into account the sensitivity of the retrieved h i to a T s or T a change, which has not been done in previous studies. Our study gives new detailed insight into the capability of T s-based h i retrieval in the Arctic marginal seas during freeze-up and wintertime, and should benefit work on microwave-radiometer-based thin-ice thickness retrieval where T s-based h i charts are used for algorithm development and validation.
Data and Methods
In the following, datasets and methods used in the ice thickness chart calculation are described.
MODIS data
MODIS spectrometer data were acquired from NASA’s Warehouse Inventory Search Tool (WIST) service over our study area (Fig. 1) under cold cloud-free night-time conditions in November–April 2008–11. The MODIS data consist of level 1B calibrated radiances at 1 km resolution (MOD02) and level 1A geolocation fields (MOD03). We chose to use only Terra MODIS data, as their acquisition times match those of Envisat advanced SAR (ASAR) Wide Swath Mode (WSM) images which will be combined with the MODIS data in a multisensor sea-ice thickness retrieval study by the authors. The MODIS acquisition times were 07:00–08:50 UTC (descending orbits) and 15:15–17:15 UTC (ascending orbits). After 15 March, only the afternoon MODIS data are utilized, as the sun zenith angle for the morning data becomes too low. After April, air temperature becomes too high for accurate h i retrieval, and the sun zenith angle for the afternoon data becomes too low. The MODIS datasets with large cloud-free areas were visually identified using NASA’s MOD29 product (MODIS/Terra Sea Ice Extent 5-Min L2 Swath 1 km) (Reference Hall, Riggs and SalomonsonHall and others, 2007) and MODIS thermal RGB (red, green, blue) images. The total number of MODIS datasets here is 199. The MODIS data were rectified to a polar stereographic coordinate system (mid-longitude 63E, true-scale latitude 70N) with 1000 m pixel size using NASA’s MODIS Swath Reprojection Tool.
MODIS RGB Images
Two different RGB images were calculated from MODIS data: (1) brightness temperature bands 20 (red), 31 (green) and 32 (blue) (3.750, 11.030 and 12.020 μm), and (2) band difference 32–31, difference 31–22 and band 31 (this combination is used for the Meteosat SEVIRI (Spinning Enhanced Visible and Infrared Imager) instrument and is called NightMicrophysical). Both images are used in a manual cloud-masking procedure.
MODIS cloud mask
We used the following method for the cloud masking of night-time MODIS data. Based on a study of MODIS cloud masking (Reference FreyFrey and others, 2008) and our visual analysis of different cloud tests for the night-time data, we selected three cloud tests: (1) 11–3.9mm brightness temperature difference (BTD) for low clouds, (2) 3.9–12 μm BTD for high clouds, and (3) 6.7 μm brightness temperature (BT) for high clouds. The thresholds for the tests were determined using empirical BT and BTD data for clouds and cloud-free sea ice and open water. The cloud tests are performed using 10 × 10 pixel blocks (10 km × 10 km). If 10% or 20% of the block pixels are cloudy according to a cloud test, the block is labeled as cloudy. Next, morphological operations are performed to remove small isolated block groups (cloudy) and to fill isolated small holes (cloud-free). The results of the individual cloud tests are combined so that if a block is cloudy according to any cloud test then it is also cloudy in the combined mask. Clear restoration is conducted using 11 μm brightness temperature (BT11) by reasoning that if under cold conditions BT11 is >272 K it should represent cloud-free open water or very thin ice. After that, filling of the small holes is again conducted. Next, the following manual editing procedures can be conducted: filling holes, removing erroneous cloud mask elements, and masking arbitrary polygonal areas as cloudy or clear. The manual editing is conducted using the two RGB images described above. Finally, the T s image is calculated and another round of manual cloud-mask editing is conducted using the T s image and the two RGB images.
Our approach to the MODIS cloud masking yields a mask that is much less ‘grainy’ than a typical pixel-based mask (e.g. in the MOD29 product (Reference Hall, Riggs and SalomonsonHall and others, 2007)). In addition, in our cloud mask, mask errors due to the MODIS sensor striping effect are not present. However, distinguishing clear sky from clouds is nowhere more difficult than in winter night-time conditions (Reference FreyFrey and others, 2008), and there are likely cases of unmasked thin clouds and fog in the T s images.
MODIS ice surface temperature
The MODIS T s under clear-sky conditions is obtained with a split-window technique, where ‘split-window’ refers to BTD in the 11–12 μm atmospheric window (Reference Hall, Key, Casey, Riggs and CavalieriHall and others, 2004). This technique allows for the correction of atmospheric effects primarily due to water vapor. The root-mean-square error (RMSE) of T s is at least 1.3 K (Reference Hall, Key, Casey, Riggs and CavalieriHall and others, 2004).
HIRLAM
HIRLAM is a short-range NWP model (Reference KallénKällen, 1996; Reference UndénUndén and others, 2002), developed by an international consortium of 11 European countries (http://hirlam.org). HIRLAM products are not routinely available over the Arctic Ocean, so we performed dedicated HIRLAM experiments over the research domain (Fig. 1) during November-April 2008-11. The experiments were run with the HIRLAM version 7.3newsnow, which contained improved surface parameterizations, including updated schemes for predicting snow and ice. Short forecasts with a lead time up to 9 hours were initialized every 6 hours (00, 06, 12 and 18 UTC). The horizontal resolution of the experiments was 7.5 km, and the model had 60 levels in the vertical. Snow depth, sea surface temperature (SST) and ice cover analyses as well as soil temperature and moisture data assimilation were performed using optimal interpolation, based on SYNOP observations and European Centre for Medium-Range Weather Forecasts (ECMWF) SST/ice-cover analyses. Over our research domain, an average of seven SYNOP stations, located on the coastline and islands, reported surface weather observations every 3 hours. The HIRLAM upper-air analysis was replaced by an interpolation of the ECMWF analyses, which were also used as lateral boundaries for the HIRLAM experiment.
In the MODIS T s-based hi retrieval, the following HIRLAM model parameters are used: air temperature at 2 m height, wind speed at 10 m, relative humidity at 2 m and downward longwave radiation. The parameters at 2 and 10m heights are diagnostic variables obtained from the HIRLAM lowest-level (∼32 m) prognostic variables. In our polar stereographic coordinate system (mid-longitude 63E, true-scale latitude 70N) the HIRLAM parameters were interpolated to 20 km gridpoint spacing and to temporal resolution of 1 hour. For the hi retrieval the HIRLAM parameters were further interpolated to the MODIS 1 km pixels using the nearest-neighbor method.
Model relating sea-ice surface temperature and level ice thickness
Level ice thickness from T s can be estimated on the basis of a surface heat balance equation. Major assumptions here are that the heat flux through the ice and snow is equal to the atmospheric flux, and temperature profiles are linear in ice and snow (Reference Yu and RothrockYu and Rothrock, 1996). The heat balance equation at the top surface (whether sea ice or snow) during the night-time is (Reference Yu and RothrockYu and Rothrock, 1996)

where F u l p and F l dn are upward and downward longwave radiative fluxes, F s and F e are turbulent sensible and latent heat fluxes, and F c is conductive heat flux approximated as


where γ is the thermal conductance of the snow/ice sheet, k and ks
are heat conductivities of ice and snow, hs
is snow thickness and T
w is the freezing temperature of sea water approximated as T
w = —0.054Sw, where S
w is the salinity of sea water. In Eqn (1), fluxes entering the top surface are positive (
 always), and fluxes leaving the surface are negative
 always).
Based on the known T
s, the surface heat fluxes and parameterized hs, ki
and ks, the estimation of hi
can be carried out.
is obtained on the basis of MODIS-derived T
s assuming constant sea-ice thermal emissivity, e, of 0.98, and
 is from the HIRLAM model. F
s and F
e are calculated as in Reference Yu and RothrockYu and Rothrock (1996) where the bulk transfer coefficients for heat and evaporation, C
s and C
e, are assumed to be 0.003 for very thin ice and 0.00175 for thick ice. For ks
we assume a constant climatological value of 0.3WmK−1 (Reference Sturm, Holmgren, König and MorrisSturm and others, 1997). ki
is calculated using Untersteiner’s (1964) equation and estimating ice bulk temperature, T
i, with T
s as was done by Reference Yu and RothrockYu and Rothrock (1996). k also depends somewhat on bulk ice salinity, Si. According to the following general expression (Reference KovacsKovacs, 1996),

Si decreases from 13.8 ppt to 6.4 ppt when hi increases from 10cm to 50cm. To simplify the hi retrieval and to take into account that Si is in reality a complex function of sea-water salinity, ice growth rate and desalination processes, we always use in the ki calculation an Si value for 30 cm thick ice (7.7ppt). The variation of k as a function of S is very small (<10%) when Ti < 268 K and hi > 10 cm. When T s is close to T w (case of very thin ice under cold conditions) then ki decreases rapidly as a function of T s. Thus, ki is assumed to be constant when T s<270 K.
For the h i retrieval, a relationship between h s and h i is needed. If it is assumed to be linear of the form

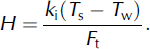
then h i is calculated from

where H is so-called thermal ice thickness (effect of snow cover excluded),
There are a number of simplifications/approximations in the above approach, in order to minimize the difficulties in retrieving h i. The accuracy of the approach is highly sensitive with respect to the model parameterizations and the accuracy of the forcing data. In a previous study in the Arctic it was assessed that the hi uncertainty increases from 27% for thin ice (20cm) to 50% for h i around 1 m during winter night-time conditions (Reference Yu and RothrockYu and Rothrock, 1996). The largest uncertainties came from F l dn and Fs. It was concluded that T s-based hi data can resolve the regional and seasonal variations in thin ice. A more recent study utilizing the same method of hi retrieval as Reference Yu and RothrockYu and Rothrock (1996) with the Advanced Very High Resolution Radiometer (AVHRR) Polar Pathfinder extended (APP-x) product (25 km pixel size), showed hi estimation capability up to ∼2.8m with an accuracy of >80% (Reference Wang, Key and LiuWang and others, 2010). Passive microwave sea-ice concentration data were used to correct T s by removing the T w contribution from overall ice-covered pixel temperature. During the night-time the largest error sources were hs, cloud amount (related to Fldn) and wind speed. Reference Yu and RothrockYu and Rothrock (1996) used uncertainty estimates of the heat fluxes in the h i accuracy analysis, but Reference Wang, Key and LiuWang and others (2010) used the variables of the heat fluxes. Neither study used NWP model data in the hi retrieval. T a was estimated as T s average over a large area plus a climatological constant, and wind speed from the geostrophic wind. Reference TamuraTamura and others (2006) retrieved h i using night-time AVHRR and ECMWF NWP data over an Antarctic polynya. The standard deviation of the difference between the retrieved h i and in situ data (max h i 0.3 m) was only 2 cm. In addition, AVHRR and ship-borne radiation thermometer-based hi retrievals matched each other.
In general, the h i accuracy decreases as h i increases, and the accuracy and the maximum retrievable h i decreases as weather gets warmer, as T s then saturates at smaller hi and the T s contrast between different ice thicknesses decreases. The above approach for T s-based h i retrieval is only valid for smooth thermodynamically grown ice.
Coastal weather station data
There are seven coastal weather stations in our study area (Fig. 1). Weather observations were conducted at 0, 6, 12 and 18h UTC. Air temperature at 2 m, wind speed at 10m and relative humidity at 2 m are used to study the accuracy of the HIRLAM model data.
Results and Discussion
The construction of the MODIS T s-based ice thickness chart starts with the determination of a statistical relationship between hs and hi. Next, the accuracy of the HIRLAM forcing data needed in the MODIS T s-based hi retrieval is studied. This is followed by presentation of the MODIS h i charts, and detailed accuracy analysis of the hi charts with different methods. Typical maximum reliable hi is also estimated.
Statistical relationship between snow and ice thickness
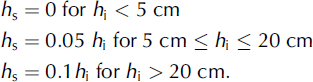
Reference Yu and RothrockYu and Rothrock (1996) used an empirical relationship between hs and hi by Reference DoroninDoronin (1971) in retrieving hi from the AVHRR data:
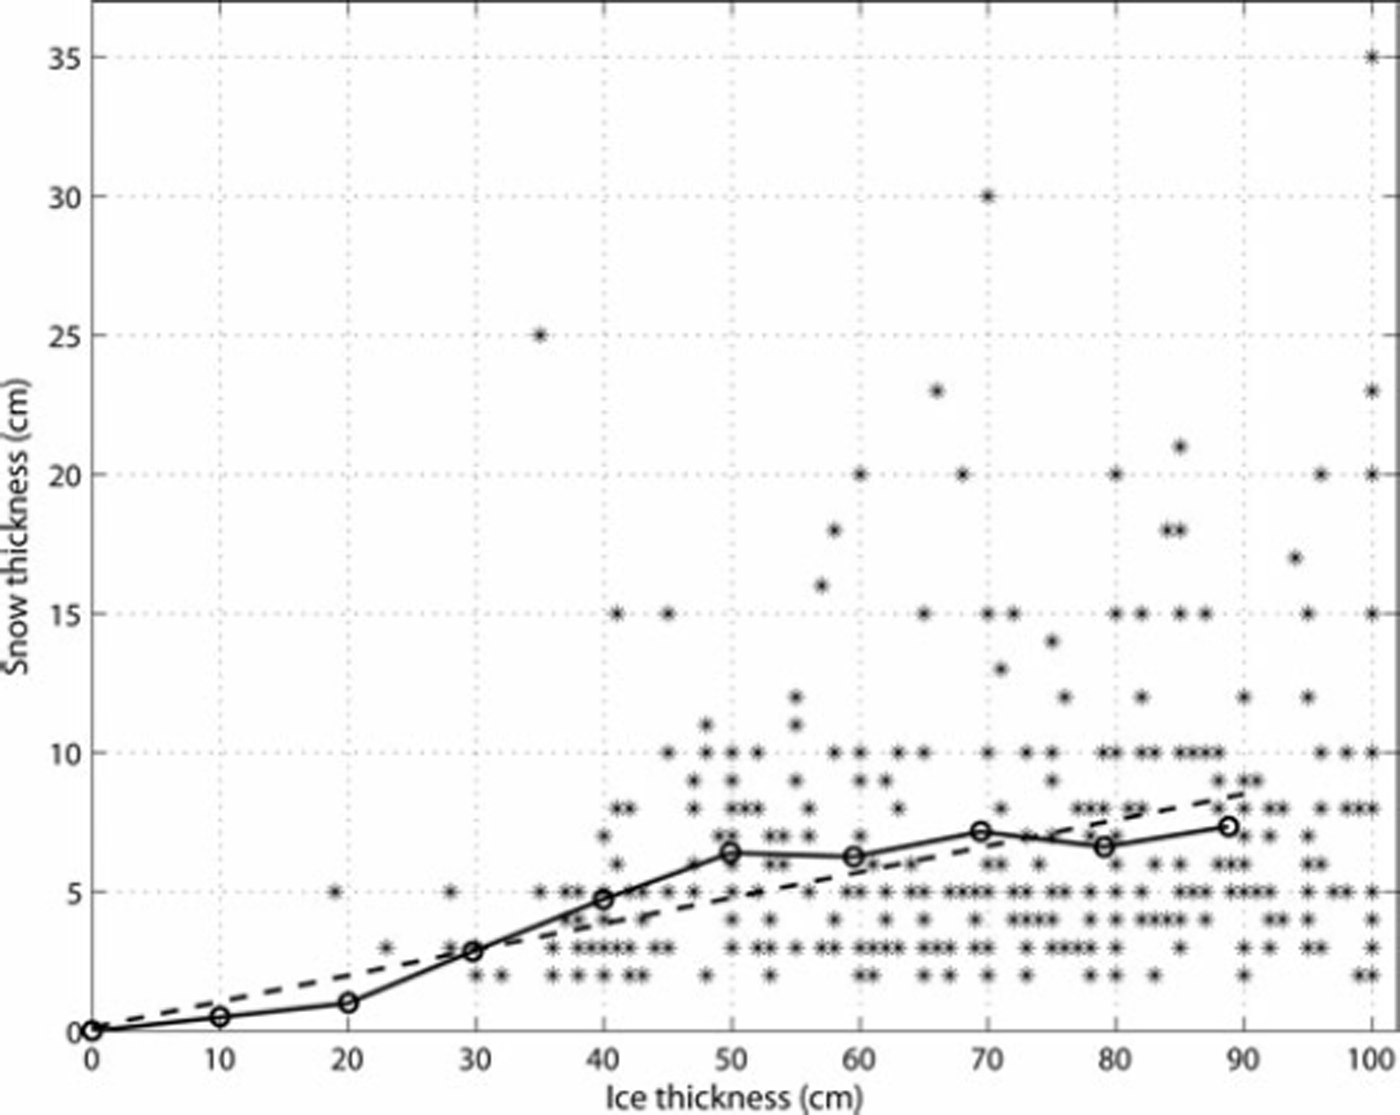
We utilize snow and ice thickness data from the Soviet Union’s airborne Sever expeditions (NSIDC, 2004) conducted in 1950–89 to determine the relationship between hs and h i. The Sever data represent late-winter conditions before the start of sea-ice melt. To estimate the hs vs hi relationship, we use only the so-called runway data up to hi = 100cm, which represent level ice, from a geographical area extending 200 km from the borders of our study area (Fig. 1). Data acquired after the end of April are not used, as this time period is not included in the MODIS datasets. The total number of data points is 322. The data amount for hi<40cm is very small, only 23 data points. The linear regression fit to the data is

The coefficient of determination, r2, is very small, only 0.04, but the p-value is 0.00, due to the large data scatter. Typically h s<10cm regardless of hi. Using Eqn (9), h s = 4.3cm when h i = 20cm, whereas Eqn (8) yields hs of only 1 cm. For ice thinner than 40 cm, Eqn (9) likely gives snow covers that are too thick.
Due to the small number of data and the large scatter of data points when hi <35 cm, these data points probably do not have a large effect on the regression coefficients, as the few data points effectively cancel out each other’s influence on the regression line. This was verified by fitting the regression line to data points with hi >35cm. The results were equal to Eqn (9), indicating a robust fit to the dataset, particularly in this ice thickness range. Consequently, we combine the Sever data and Eqn (8) as follows: (1) the Sever data are divided into 10cm thickness bins centered from 30cm to 90cm, and the mean hs and hi are calculated; (2) at hi values of 0, 10 and 20cm, Eqn (8) is used; and (3) linear regression is fitted to these data points (Fig. 2). The regression fit is

The relationship between snow and ice thickness for level ice. Stars are the Sever data acquired in 1950–89 in our study area. The solid-dotted line is the average snow and ice thickness relationship using the Sever data for thickness range 30–90cm and Reference DoroninDoronin’s (1971) empirical equation for 0–20 cm range. Dashed line is linear regression fit to the average data.
The constant term is so small that it can be dropped. When hi<20cm, Eqn (10) likely gives snow cover that is too thick, especially for polynyas. Thus, for this thickness range we use Eqn (8), yielding the following final h i vs hs relationship

The only difference between Eqns (11) and (8) is a 10% smaller slope term in Eqn (11) when h i>20cm.
HIRLAM accuracy
The accuracy of the HIRLAM air temperature, T
a
H, wind speed, uH, and relative humidity, Rh, are studied by comparing them to the coastal weather station data (
 , u
w, Rhw) from seven stations (Fig. 1). We do not have in situ data to make a comparison for the HIRLAM
 In the comparison the HIRLAM data (1 hour time-step) from the gridpoints over the ocean closest to the weather stations and coincident with the weather station data (6 hour time step) were used. The comparison was conducted using HIRLAM and weather station datasets for winter 2010/11 (1 October–30 April). Table 1 shows the comparison (HIRLAM minus weather station data) results: mean bias, RMSE, standard deviation (std) and their variation from station to station, and the correlation coefficient.
Comparison between seven weather stations and HIRLAM data (HIRLAM minus station) for air temperature, T a (°C)), wind speed, u (ms−1), and relative humidity, Rh (%). The time period is 1 October 2010 to 31 April 2011

The overall mean bias of T a H is –0.9°C (T a H is on average 0.9°C smaller than T a w ). The overall RMSE and std are rather high, 3.8°C and 3.7°C, but the correlation between the two Ta datasets is nonetheless 0.94. The high correlation between T a H and T a w shows the peaks and lows of air-temperature changes are captured well by HIRLAM. There is some variation of the statistics from station to station (e.g. from 2.9°C to 4.2°C for std). The mean bias increases somewhat with decreasing T a H: for the T a H ranges–10 to –5°C and –25 to –20°C, it is –0.1 °C and –2.3°C, respectively. Both RMSE and std increase with decreasing T a H (e.g. in the above-mentioned T a H ranges, RMSE is 3.0°C and 4.8°C). This HIRLAM underestimation of T a leads to underestimation of h i, as the T a — T s difference now resembles that of thinner ice.
These differences between the two T a datasets could be partly due to the sea-ice mask used in the HIRLAM model. The mask only shows either open water or thick sea ice, so the atmosphere over the sea ice is always insulated from the ocean regardless of the ice thickness. In addition, a modeling study by Reference Lüpkes, Vihma, Birnbaum and WackerLüpkes and others (2008) demonstrated that, for sea-ice concentrations greater than 90%, small changes in the sea-ice fraction have a strong increasing effect on the near-surface T a over thick ice under clear-sky conditions during polar night.
The correlation between the u datasets is much lower than for the T a datasets, only 0.67. Because the wind speed changes at much higher temporal frequency than air temperature, the lower correlation between u H and u w does not indicate a weak modeling skill by the HIRLAM as our closer analysis showed. The overall mean bias of uH is –1.2 ms−1, std is 3.1 m s−1 and RMSE is 3.3 ms−1. These std and RMSE values indicate >100% uncertainties (std(u H)/u H) for u H at lower wind speeds. Thus, the std of uH — u w was also studied as a function of u H. Std increases rapidly with increasing u H up to 12ms−1, but at the same time the u H uncertainty decreases from >100%, when uH ≤2ms−1, to ∼40%. When u w>9ms−1, HIRLAM mostly underestimates it. At low u w (<3ms−1), by contrast, HIRLAM slightly overestimates it. During the acquisitions of the MODIS datasets, uw was typically small: in the 2010–11 data the average was 5 ms− 1 in the Kara Sea. The HIRLAM underestimation of u leads to underestimation of absolute values of F s and F e which are linear functions of u. This in turn leads to either hi overestimation if Fs + Fe < 0, or underestimation if Fs + Fe > 0.
The overall mean bias and std for Rh — Rhw is +8% and 12%, respectively. There is no correlation between the Rh datasets. HIRLAM significantly overestimates Rh when Rhw<80%. Rh is the input parameter only for the turbulent latent flux, F e, whose contribution to the heat balance equation (1) is the smallest. In some previous studies, Rh has been simply assumed to be constant: 90% in Reference Yu and RothrockYu and Rothrock (1996) and Reference Wang, Key and LiuWang and others (2010).
For the std of the HIRLAM F d ln we assume a value of 20Wm−2 based on a study where different F ld n schemes were compared to in situ F d ln measurements on Baltic Sea ice (Reference Zhang, Cheng, Launiainen, Wu and LiuZhang and others, 2006).
MODIS ice thickness chart
In calculating the MODIS hi charts, the following restrictions and procedures are applied: (1) The MODIS sensor scan angle (max 558) of the T s data is limited to be <408 in order to restrict the effect of atmosphere and deterioration of spatial resolution. At a scan angle of 40° the across-track resolution is ∼2 km (at nadir it is 1 km). (2) The calculated hi is rounded to 1 cm resolution. (3) The hi retrieval yields sometimes erroneous negative hi values for thick ice (F t > 0 in Eqn (7) which is erroneous) due to errors either in the HIRLAM data or in the model parameterizations. These erroneous hi values are flagged in the hi chart. (4) For very thin ice (few cm), negative hi values are sometimes obtained; these are marked to 0 m (i.e. open water). (5) Using 10 × 10km block averages of T s and T a the following changes are made to the calculated hi chart: (a) If T a >–5°C then the calculated hi is masked away. It is assumed that at these high air temperatures the sensitivity of h i to T s is too small for accurate hi retrieval. (b) If T a >–5°C but T s — T w > –1 °C, then the block is flagged as open water. It is not possible to separate accurately open water and 1–3 cm thick ice due to the inaccuracies of the T s and heat fluxes. (6) Finally it is assumed that hi values greater than 1.0 m are too unreliable and they are flagged away. Figure 3 shows examples of the calculated MODIS hi charts.
Ice thickness charts derived from the MODIS ice surface temperature images acquired on (a) 31 December 2009, (b) 14 January 2010 and (c) 23 February 2010. Dark blue is either cloud (thickness –0.2m), no data mask (–0.3m) or scan angle mask (–0.2 m), and light blue (–0.1 m) indicates areas where ice thickness retrieval was unsuccessful or resulted in thickness values more than 1 m. Polar stereographic coordinates with mid-longitude of 63E.

The areal coverage percentage of the hi charts over our study area (land excluded) varies from 5% to 45%, with an average of 19%. Here the areas of unsuccessful hi retrieval are included, as they indicate areas of thick ice (hi > 1 m), although without any thickness estimate. Due to the MODIS scan angle limitation, a totally cloud-free MODIS T s image (none was found) would cover, on average, only 77% of the study area. The percentage of T s pixels for which the hi retrieval was unsuccessful varied from 0% to 79%, with an average of 18%, and it increased from November to April as sea-ice thickness in general increases during the ice season due to thermodynamic growth and deformation. The average time difference between two MODIS hi charts is 2.4 days, and the difference varies from 0.6 to 12.4 days. The temporal coverage is worst (fewest hi charts) for November and April due to prevailing cloud cover, and best for February and March. The hi chart coverage is most frequent over the northeastern part of the Kara Sea (top-right quarter in Fig. 1) and less frequent over the northwestern (Barents Sea) and southwestern (Pechora Sea) parts of our study area. The cloudiness frequency is hence very closely associated with the distance to open sea.
Accuracy and maximum value of the MODIS-based ice thickness
The accuracy of the MODIS T s-based hi is studied in two ways: (1) Using estimated or guessed standard deviations and covariances of the input variables to the hi retrieval, the hi uncertainty is estimated with the Monte Carlo method. The uncertainty, or relative accuracy, is quantified with std(hi)/mean(hi) of the sampled hi values. (2) hi charts from consecutive days are compared to each other. Large differences are mainly due to the cloud-masking errors, HIRLAM data inaccuracies and the frequency and spatial distribution of open leads. The comparison estimates stability of the hi retrieval when the true hi change is insignificant, but the forcing data and T s may undergo significant changes in a short period of time. Currently we do not have any coincident in situ thickness data for accuracy studies.
The typical maximum reliable hi under different T a ranges is determined using not only the results of the above analyses, but also an empirical mean T a — T s vs hi relationship which shows how rapidly hi changes as a function of a slight change of T s or T ä.
Ice thickness uncertainty with the Monte Carlo method
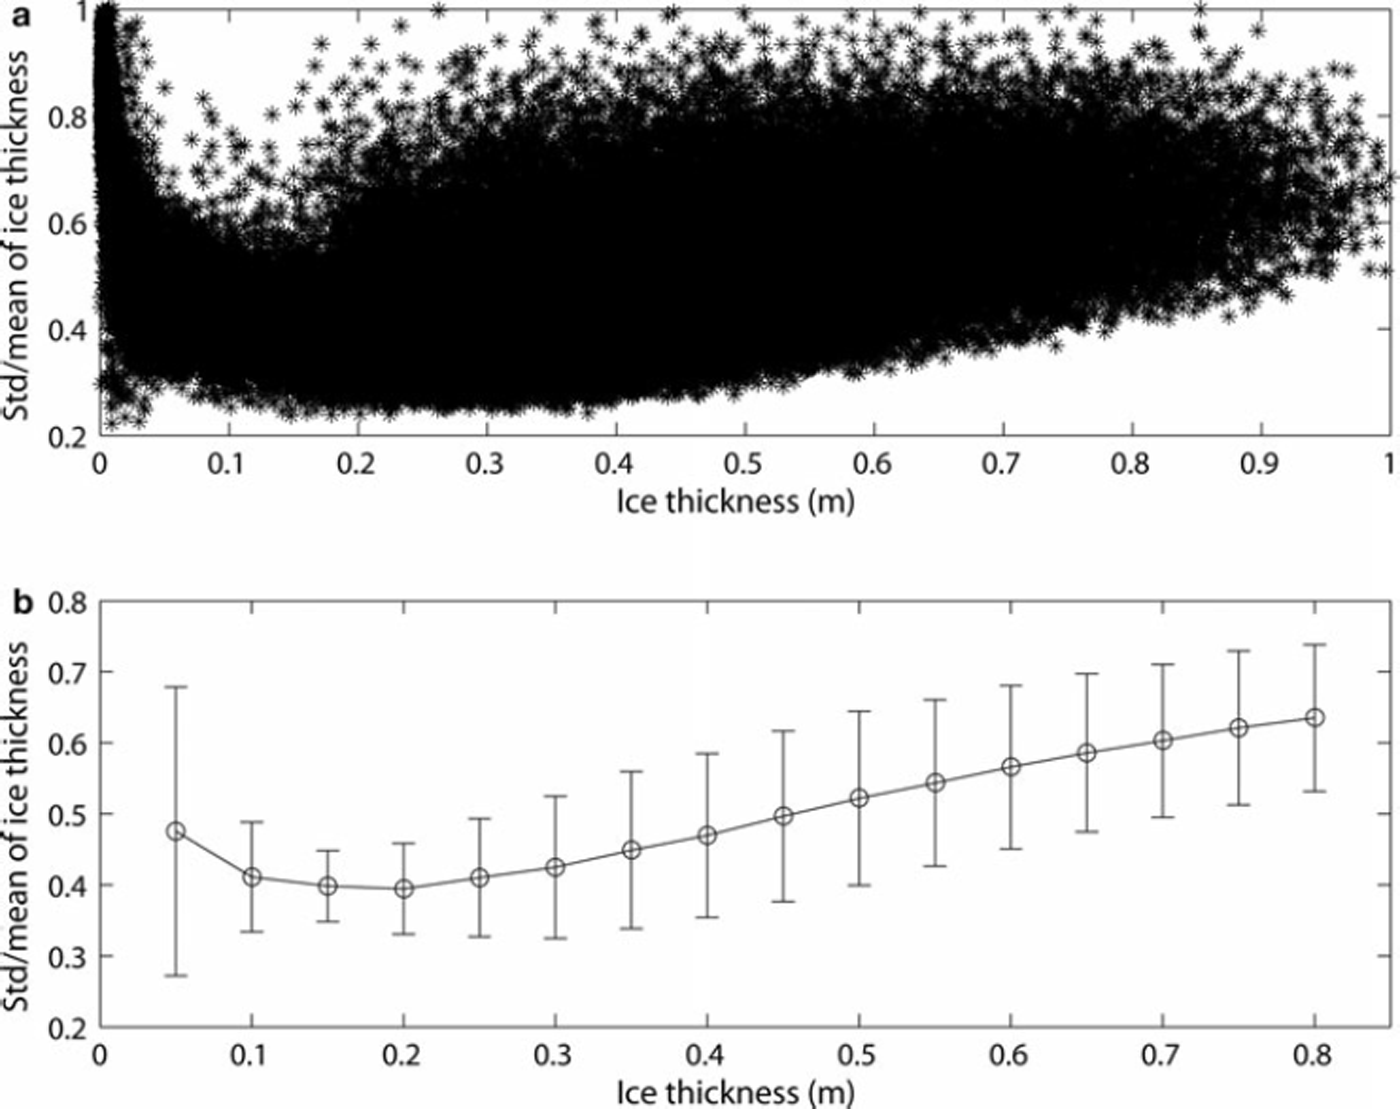
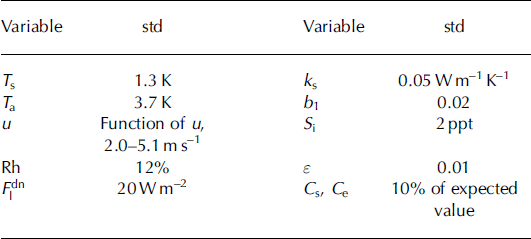
Ice thickness uncertainty with the Monte Carlo method is characterized by std(h i)/mean(h i), i.e. coefficient of variation (vc), of the sampled h values from Eqn (6). The Monte Carlo h sampling was conducted only at the HIRLAM gridpoints (20 km spacing), in order to reduce computation burden. T s is here 3 by 3 pixels average at the gridpoints, to decrease local T s variation. In total, there were 92 123 gridpoint datasets for the h sampling. Table 2 shows the estimated, or ‘best-guess’, standard deviations of the variables needed in the h sampling. The chosen std of 0.02 for b1 in Eqn (11) represents 40% vc for hs when hi ≤ 2 0 cm, and 22% when hi >20cm. For the T ä, u and Rh, stds, instead of RMSEs, from the HIRLAM and weather station data comparison are used because the observed difference distributions are characterized by the mean bias and std. Only correlations between T s and the HIRLAM T ä, u, Rh and F ldn are taken into account in the random sampling. These were estimated from the gridpoint data. The correlation is largest, +0.90, between T a and F ldn, and second largest, +0.83, between T s and T ä. For other variable combinations it varied from –0.37 to +0.78. T s, T ä, u, Rh and F ld n were sampled from a five-dimensional normal distribution. Other variables were also sampled from normal distributions. At each gridpoint, 1000 random hi values were calculated. Before calculating mean and std for the sampled h values, negative un-physical h values were rejected, as was the upper 5% of the positive h values. Very large h values (hi 3> 1 m) are due to F t in Eqn (7) having an expected value very close to zero and they would increase std(h i) considerably if not excluded. Next, the h values were divided into 5 cm wide bins, and the mean and std of vc were calculated. The results of the Monte Carlo simulation are shown in Figures 4–6.
Uncertainty of the MODIS-based ice thickness estimated with the Monte Carlo method. (a) Mean and std/mean of the sampled thickness values. (b) Average thickness uncertainty as a function of ice thickness and the variation of the uncertainty characterized by std(std/mean).
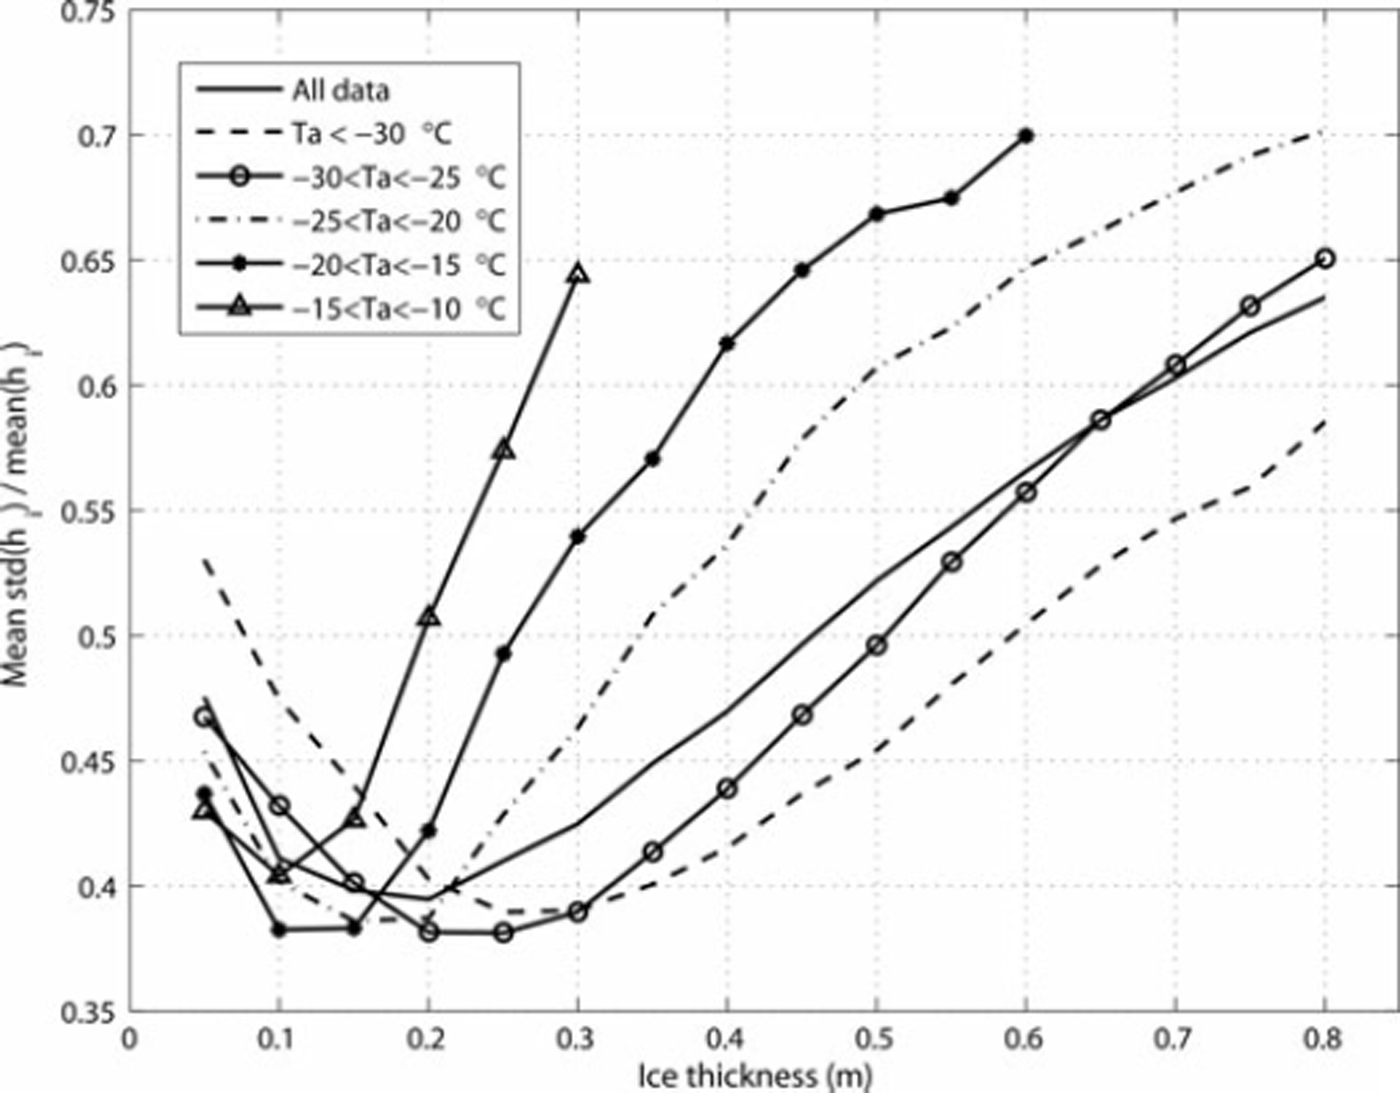
Average uncertainty of the MODIS-based ice thickness as a function of HIRLAM air temperature range.
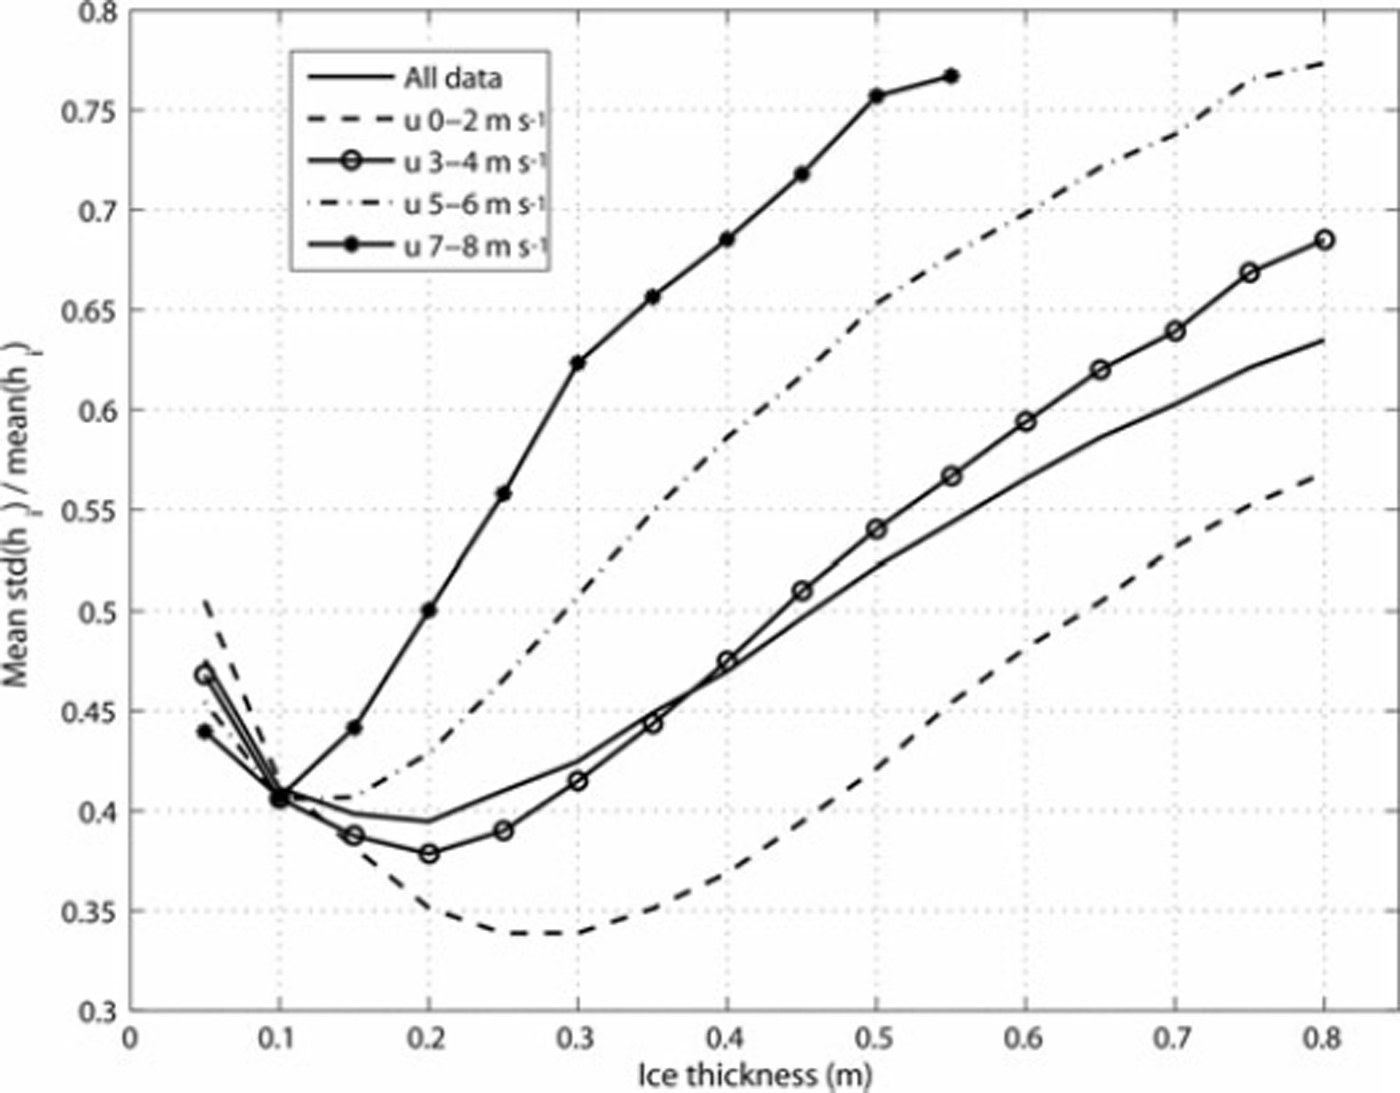
Average uncertainty of the MODIS-based ice thickness as a function of HIRLAM wind-speed range.
Standard deviations of the variables used in the Monte Carlo estimation of the MODIS-based ice thickness uncertainty
The mean vc with all the data is smallest, 39–41%, for the hi range 10–25 cm and increases slowly to 64% when h = 80 cm (Fig. 4). The mean vc is 48% when h = 5 cm and approaches 100% when h is only 1–2 cm. If the maximum allowable mean vc is set to 50% then the typical maximum reliable h is ∼45cm, and the typical minimum is 4–5 cm. The large vc for very thin ice (hi < 5 cm) does not matter when the h charts are used for ship navigation, but can be a drawback when they are used for ocean heat loss calculations.
The large scatter of data points in Figure 4 is partly due to the dependence of the h uncertainty on T a and u. Figure 5 shows the mean vc as a function of T a range. The mean vc clearly decreases with decreasing T a when hi > 20cm. If we again take the vc limit of 50% for the reliable hi then the maximum h is 60 cm when T a < –30°C, but it is only 25 cm when –20 < T a <–15°C. For all gridpoint data, the HIRLAM T a is less than –20°C in 82% of cases. The mean vc as a function of u range is depicted in Figure 6. The mean vc increases considerably with increasing u when hi > 10 cm. With the 50% hi uncertainty limit, the maximum hi is 65 cm when u < 2 m s−1 and only 20 cm when 7 ≤ u ≤ 8 ms−1. For the gridpoint data, the HIRLAM modal u is 3 ms−1 and 83% of the u values are <5 m s−1. Figures 5 and 6 show that the hi uncertainty is smallest under very cold calm wind conditions. As the h i uncertainty depends considerably on T a and u, it is difficult to determine the typical maximum for h i, but under typical weather conditions (T a <–20°C, u≤5ms−1) for the MODIS data the maximum is ∼50cm. The accuracy is best for the 15–30 cm thickness range, ∼38%.
The h i uncertainty values obtained here are larger than those by Reference Yu and RothrockYu and Rothrock (1996). They assessed that the hi uncertainty increases from 27% for 20 cm thick ice to 50% for h i around 1 m. However, they estimated much smaller std for T a and u, only 1.6°C and 0.7 ms−1, respectively. If we decrease std to 1°C and 1 ms−1 then the hi uncertainty is <40% when hi = 80 cm, and in the 10–30 cm range it is only ∼22%. When the std of b1 is doubled to 0.04, corresponding to 68% and 44% hs uncertainty when h i ≤ 2 0 cm and hi > 20cm, respectively, the hi uncertainty increases slightly, a 50% limit being reached when h i = 45cm. The contribution of different variables to the hi uncertainty was studied by taking into account std of only one variable at a time in the hi sampling. The largest hi uncertainty comes from T ä. T s and dn have somewhat smaller roughly equal contributions. When hi <30cm then u also makes a significant contribution to the h i uncertainty. The hi uncertainty from snow thickness alone is ∼10%. Direct comparison of our results to those of Reference Yu and RothrockYu and Rothrock (1996) and Reference Wang, Key and LiuWang and others (2010) is not possible as they did not use NWP model data in the hi retrieval, but in their results F ldn and u were among the largest error sources.
Comparison of thickness maps from consecutive days
The comparison of hi charts from consecutive days estimates the stability of hi retrieval when the true hi change is insignificant, but the forcing data and Ts may undergo large changes in a short period of time. Large hi differences are mainly due to the cloud-masking errors, HIRLAM data inaccuracies and the frequency and spatial distribution of open leads. Undetected high thin clouds result in a cold bias in T s, making the ice appear thicker than it actually is (Reference Martin, Drucker, Kwok and HoltMartin and others, 2004; Reference TamuraTamura and others, 2006). Ice fog generated by intense vapor flux from leads and polynyas under cold conditions is warmer than surrounding fast- or pack-ice Ts and colder than T s for thin ice. This leads to hi underestimation for pack ice and overestimation for thin ice. Hence, the presence of open leads has an unfavorable equalizing effect on the hi values. The highest lead activity is also usually associated with relatively high wind speeds, which additionally weakens the retrieval accuracy.
For this study, there are 108 hi chart pairs. The time difference between the charts varies from 15 to 33 hours, with an average of 24 hours. During these short time periods the ice growth is typically only a few centimeters (Reference LeppärantaLeppäranta, 1993). hi differences from the chart pairs were calculated using 10 × 10km block averages in order to diminish the effect of ice movement. For a block with all hi pixels valid, (0 ≤ hi < 1 m), std(hi)/mean(hi) was required to be <20% to reject ice areas in the comparison that were too heterogeneous. In total, there were 31 560 hi difference values from the chart pairs.
The overall root-mean-square difference (RMS) for the hi difference data is 8.5 cm, the mean absolute bias is 6.1 cm, and 90% of the absolute hi differences are <14cm. Within the h i chart pairs, RMS varies from 2.1 to 19.7 cm and the average is 8.3 cm. There are no correlations between the hi and T a or u differences, but the absolute T a and u differences are typically small, below 2°C and 2 m s–1, respectively. This suggests that cloud-masking errors caused the large RMS for some hi chart pairs. For the hi intervals 0–10, 10–20, 20–30, 30–40, 40–50 and 50–60 cm, RMS is 4.2, 4.9, 8.4, 9.3, 11.0 and 11.7cm, respectively. RMS is 21–32% of the hi bin centre value when the 0–10cm bin is excluded. These statistics demonstrate good stability (or repeatability) of the MODIS and HIRLAM data-based hi charts.
Maximum reliable ice thickness
Next, typical maximum reliable hi under different T a ranges (width 5°C) is studied using empirical mean T a — T s vs hi curves, which show how rapidly hi changes as a function of a slight change in T s or T ä. These curves were calculated from the T s, hi and Ta averages (3 × 3 pixel block) at the HIRLAM gridpoints. As T a — T s vs h i also depends on u it was required to be <5ms–1 to include only the most common wind conditions of the MODIS data. The number of gridpoint datasets was 72 955. Figure 7 shows the mean T a — T s vs hi curves for six different T a ranges. The mean hi in the curves was calculated inside 1°C wide T a — T s bins.
Empirical average relationship between the HIRLAM air temperature and MODIS ice surface temperature difference and the retrieved ice thickness for different air temperature ranges.
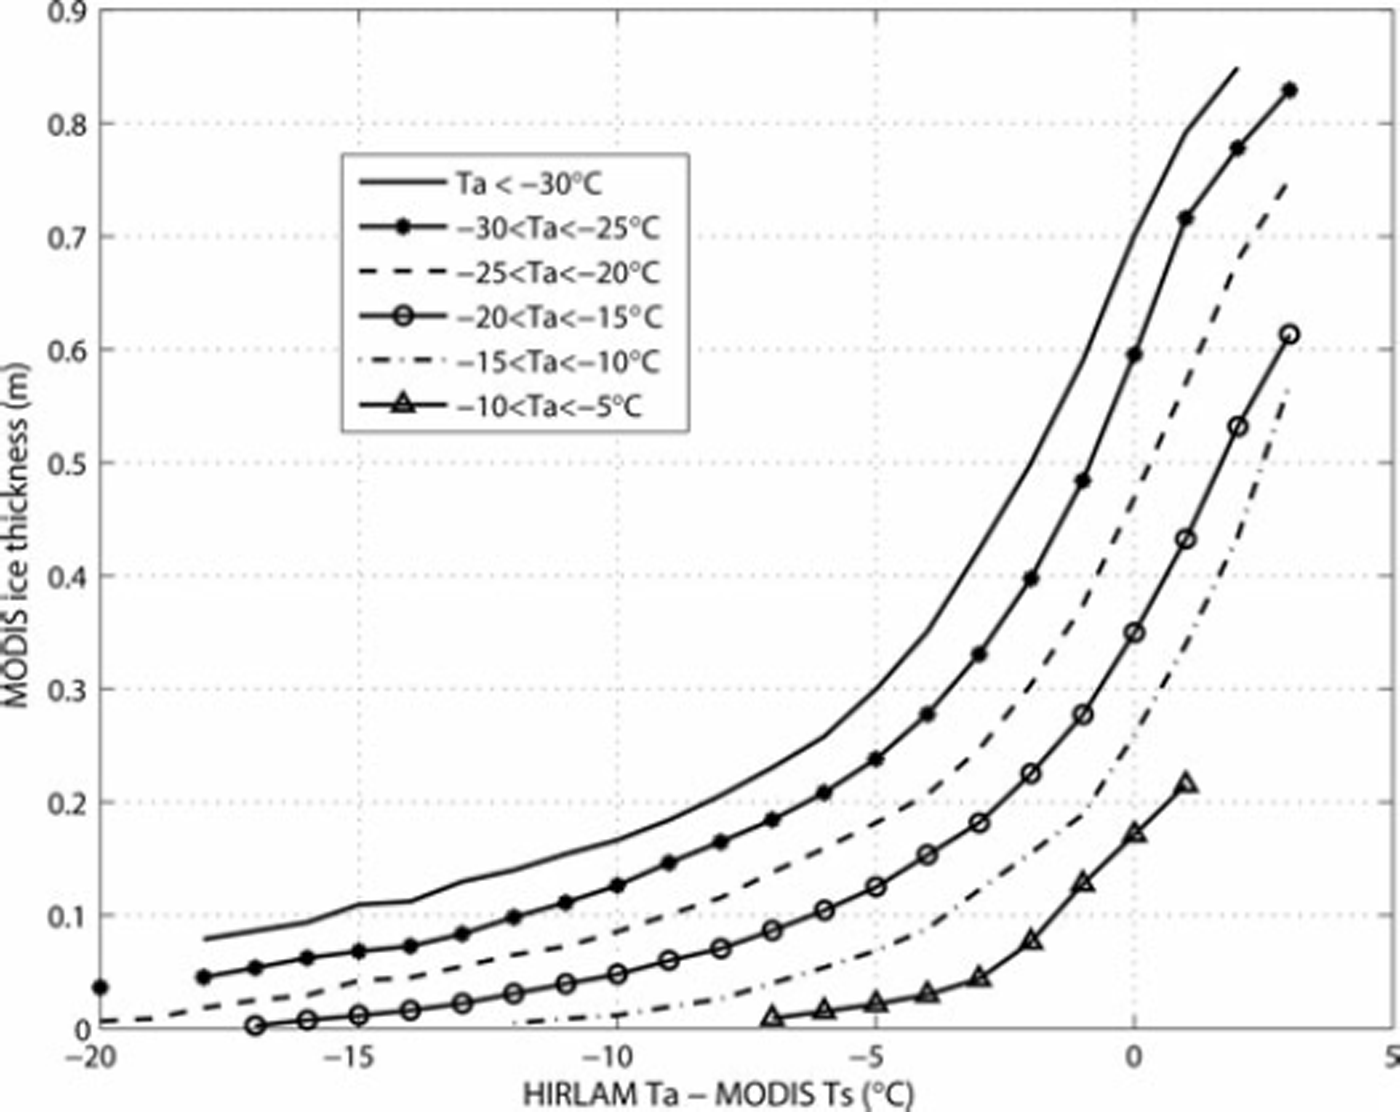
When Ta — T s approaches 0°C, the sensitivity of hi to T a — T s increases: a 1 °C change in T a — T s can cause >10 cm change in h i. Taking into account the RMSE of T s and T a (and other variables in Eqn (6)), this sensitivity is too large for accurate hi retrieval, whereas when T a — T s=–5°C, a 1°C change leads at maximum to a 4 cm change in hi. Not only the maximum acceptable T a — T s vs hi sensitivity, but also the T a — T s difference itself may be a limiting factor for the maximum reliable h i. When T a — T s > 0°C, then, due to the radiative surface cooling, the snow/ice surface is colder than the air and the simple parameterizations of the turbulent sensible and latent heat fluxes may be liable to large errors, a common problem for the stable boundary layer (Reference Hanna and YangHanna and Yang, 2001; Reference JärvenojaJärvenoja, 2005). We suggest that the maximum allowed T a — T s should be 0°C or only few degrees higher. Figure 7 shows that at a fixed T a — T s value the corresponding mean hi decreases considerably with increasing T ä.
In summary, the maximum reliable hi depends on (1) maximum acceptable T a — T s vs hi sensitivity, (2) maximum allowed T a — T s, (3) acceptable hi uncertainty based on the Monte Carlo simulation, and (4) T a. If we set the maximum T a — T s to 0°C and the T a — T s vs hi sensitivity to be <10cm°C–1, then the maximum hi varies from 50cm when T a <–30°C (max T s — T a now –2°C due to the sensitivity limit) to 35 cm when - 2 0 < T a < - 1 5 8 C (max T a — T s = 0°C). For the first T a range, the hi uncertainty is <50%, but for the second one the 50% uncertainty limit decreases the maximum hi to 25 cm. Combining the results, the typical maximum reliable hi is ∼35–50 cm under typical weather conditions (T a<–20°C, u ≤5ms−1) present in the MODIS data.
Conclusions
We have studied ice thickness retrieval in the Kara Sea and eastern part of the Barents Sea using night-time MODIS T s images and HIRLAM weather forcing data, and conducted detailed accuracy analysis of the retrieved hi for ice <1 m thick. For the cloud masking of the MODIS data we had to use manual methods in order to improve detection of cloud-covered areas, mainly thin clouds and ice fog. These manual methods are not suitable for processing a large number of MODIS images (too time-consuming) or to be included in an operative MODIS hi chart processing chain.
Our MODIS h i chart collection of 199 charts spans three winters (November-April) in 2008–11. The temporal coverage of the charts is worst for November and April due to prevailing cloud cover, and best for February and March. Over the northwestern (Barents Sea) and southwestern (Pechora Sea) parts of our study area (Fig. 1) the temporal and spatial hi chart coverage is typically too small to follow development of thin-ice areas (leads, polynyas).
We conducted detailed accuracy analysis of the retrieved h i using three different methods, taking into account the inaccuracy of the HIRLAM weather forcing data, and determined maximum reliable hi values under different T a and u ranges. The typical maximum reliable hi is 35–50 cm under typical weather conditions (T a <-20°C, u≤5ms−1) present in the MODIS data. The accuracy is best for the 15–30cm thickness range, ∼38%. Our hi limits are more conservative than those in previous studies (Reference Yu and RothrockYu and Rothrock, 1996; Reference Wang, Key and LiuWang and others, 2010) where NWP model data were not used in the hi retrieval. The large difference from the maximum hi of 2.8 m estimated by Reference Wang, Key and LiuWang and others (2010) is likely also due to the APP-× dataset (25 km pixel size, T s corrected with ice concentration data) used in that study. A straightforward way of increasing the accuracy of our MODIS-based hi is to increase the accuracy of the NWP forcing data, if possible. Further studies include h i retrieval using snow thickness information from microwave radiometer data or from a sea-ice thermodynamic model, and the effect of the ice deformation derived from SAR data on the hi accuracy.
Our results give new detailed insight into the capability of T s-based hi retrieval in the Arctic marginal seas during freeze-up and wintertime, and should also benefit work on microwave-radiometer-based hi retrieval where T s-based hi charts are used for algorithm development and validation.



