Implications
Increasing the growth rate of dairy heifers decreased their age at puberty, potentially reducing age at first calving and ultimately shortening the non-productive rearing period. Combined monitoring of the growth rates and blood levels of selected metabolites at a young age (6 months (mo) of age or earlier) could be a way to better predict oestrus onset in dairy heifers, rather than regular progesterone analysis (every 10 days or less). This information could be of interest for optimal reproduction (number of oestrus cycles before insemination for improved fertility) and/or for oocyte/embryo production in peripubertal donors.
Introduction
In seasonal calving systems where heifers first calve at a young age (around 24 mo), the moment of 1st insemination may be delayed for those born at the end of the calving period if an adequate BW is not reached (i.e. 360 to 380 kg for Holstein heifers in French dairy herds; Le Cozler et al., Reference Le Cozler, Lollivier, Lacasse and Disenhaus2008). To solve this problem, one strategy is to increase the feeding intensity and thus the growth rate for late-born heifers. A high growth rate usually results in a decreased age at puberty and, consequently, 1st calving may occur as early as 20 mo of age. Puberty onset is generally a consequence of an early attainment of a standard BW associated, within breeds, to a target body condition (Le Cozler et al., Reference Le Cozler, Lollivier, Lacasse and Disenhaus2008).
However, reaching this standard BW alone is probably not sufficient to attain puberty, and specific metabolic signals likely act to support this phase of reproductive development (Chelikani et al., Reference Chelikani, Ambrose and Kennelly2003). There are many studies published on the effect of nutrition during the rearing-phase on profiles of reproductive (progesterone, oestradiol, LH, FSH, etc.) and/or metabolic (IGF, growth hormone, leptin, etc.) hormones during pre- or post-pubertal phases (Bergfeld et al., Reference Bergfeld, Kojima, Cupp, Wehrman, Peters, Garcia-Winder and Kinder1994; Evans et al., Reference Evans, Adams and Rawlings1994; Melvin et al., Reference Melvin, Lindsey, Quintal-Franco, Zanella, Fike, Van Tassell and Kinder1999). Other authors have documented the metabolic, endocrine and/or reproductive responses with respect to growth or puberty onset in dairy (Taylor et al., Reference Taylor, Beever, Bryant and Wathes2004; Brickell et al., Reference Brickell, McGowan and Wathes2009), beef (Hall et al., Reference Hall, Staigmiller, Bellows, Short, Moseley and Bellows1995; Rodríguez-Sánchez et al., Reference Rodríguez-Sánchez, Sanz, Tamanini and Casasús2015) or mixed (Samadi et al., Reference Samadi, Blache, Martin and D’Occhio2014) heifers. All these studies provide additional information on the complex interplay among nutrition, growth and reproduction in growing cattle, but information on circulating enzymes or minerals involved in metabolism is scarce. Indeed, when accelerated heifer growth is diet-induced, it is also necessary to consider the possible outcome of these elements on metabolic profiles in terms of potential implications for puberty attainment. The relationship between plasma metabolites and late puberty attainment may stem from two factors: nutrient supply inadequately supporting the heifer’s growth potential, and nutritional or environmental stressors influencing heifer growth. The first case would likely involve a metabolic profile characterised by signals of low energy and/or protein supply, such as low plasma glucose or urea levels (Abeni et al., Reference Abeni, Calamari, Stefanini and Pirlo2000). The second case would likely involve increased signals of tissue damage, notably to the liver, as suggested by higher enzyme activities (Abeni et al., Reference Abeni, Migliorati, Terzano, Capelletti, Gallo, Masoero and Pirlo2014). The fact that rearing procedures can alter hormonal profiles in both dairy (Chelikani et al., Reference Chelikani, Ambrose and Kennelly2003) and beef (Gasser et al., Reference Gasser, Behlke, Grum and Day2006) heifers points to the hypothesis that modifying both diet composition and feeding management may also modify plasma profiles and thus affect puberty onset. If puberty onset is affected by plasma biochemical parameters, then some metabolites could serve as indicators of potential early puberty onset and thus be used to select these heifers.
Here, we designed and led an experiment to determine the effects of feeding treatments on growth parameters, age at puberty and plasma biochemical profiles, and to study the possible relationships between age at puberty and metabolic profiles at 6, 9, 12 and 15 mo of age in dairy heifers.
Material and methods
General design
Sixty-seven Holstein heifers, born during the 2011–12 calving season (September to February), were reared and followed until oestrus synchronisation (11 to 15 mo of age) at the INRA’s experimental farm in Le Rheu, France. Calves born between 1 September and 30 November were alternately allocated to one of two nutritional treatments (according to birth order) and fed either a standard diet (SD; n=27) or an intensive-plane diet (ID1; n=27) from 0 to 6 mo of age. It was expected that, thanks to the feeding intensity chosen, heifers fed SD and ID1 diets would reach 190 to 200 and 220 to 230 kg at 6 mo of age, respectively. Heifers born after 1 December (ID2; n=13) received the same intensive-plane diet as ID1 heifers from 0 to 6 mo of age, to limit the possible confusion effect between age and treatment during this period. Thereafter, a complementary diet was formulated for ID2 heifers in order to reach 380 kg at 1 year of age. The main objective of this latest procedure was to study the possibility for late-born heifers to catch up with the rest of the heifers at 1st artificial insemination (AI) at a minimum BW of 370 to 380 kg. It was expected that this corresponded to 15 and 12 mo of age for (SD and ID1) and ID2 heifers, respectively. The diets (Table 1) were formulated for the different stages of growth: birth to weaning, weaning to 4 mo, 4 to 6 mo, 6 to 9 mo, 9 to 12 mo and 12 to 15 mo, according to the recommendations and procedures presented by Agabriel and Meschy (2007). These diets were also formulated to reach a targeted average daily gain (ADG) per period, with respect to the initial BW and feeding treatment used.
Ingredients and chemical composition of the experimental diets

TMR=total mixed ration; SD, ID1, ID2: animals fed either on a standard (SD) or increased-plane (ID1 and ID2) feeding rearing programme; DM=dry matter; PDIE=metabolisable protein supply; PDIN=rumen-degradable nitrogen; UFL=unit of feed for lactation.
1 Chemical composition: DM 88.7%; CP 168 g/kg; PDIE 118 g; PDIN 114 g; UFL 1.05.
2 Chemical composition: DM 87.9%; CP 131 g/kg; PDIE 81 g; PDIN 90 g; UFL 0.96.
Heifer management
The milk-feeding phase (year 1)
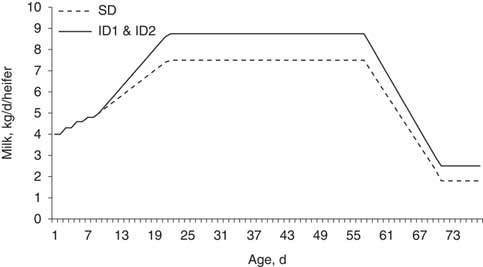
At the end of the pre-experimental phase (0 to 10 days), calves were fed reconstituted milk replacer (135 g milk power + 865 g water per litre) until weaning. The CP and fat content of the milk powder averaged 23.9% and 19.0%, respectively. Heifers were group-housed indoors on cumulated straw bedding. They were reared in dynamic groups, fed with automatic milk feeding systems (AMFS), with free access to fresh water, straw and hay. Dynamic group strategy meant that calves entered the group every week while others left it at weaning (70 to 77 days). Group size thus varied from 8 to 24 calves per AMFS. Milk was distributed according to either a standard (SD) or an increased-plane (ID1 and ID2) milk-feeding programme (Figure 1). The SD ration was routinely used in the experimental herd and (ID1 and ID2) rations consisted of 15% more milk. As a supplement to the milk, all calves were fed ad libitum total mixed ration 1 (TMR1; Table 1).
Standard (SD) or increased-plane (ID1 and ID2) milk feeding programme according to age of Holstein heifers.

From weaning until turning out to pasture (year 1)
From weaning to 6/8 mo of age, groups of calves were housed in separate pens on deep straw bedding with ad libitum access to fresh water and straw. Until 4 mo of age, the SD group received TMR1 ad libitum until the concentrate reached 2 kg DM/head per day, no restriction was applied to ID1 and ID2 heifers. From 4 to 6/8 mo of age (turning out to pasture), TMR2 (Table 1) was distributed ad libitum until the maximum daily allowance of concentrate reached 2 and 2.5 kg DM/head for SD and (ID1 and ID2) heifers, respectively, that is, a total daily allowance of 10 and 12.5 kg/head of TMR2 for SD and (ID1 and ID2) heifers, respectively. These amounts did not change until turn out to pasture.
Turning out to pasture
Starting from mid-May 2012 for SD and ID1 heifers and mid-June for ID2 heifers, heifers were turned out to pasture and rotationally grazed on a perennial ryegrass sward. After a 5-day transition phase and throughout the pasture season, SD and ID1 groups received a daily supplement of 1 kg DM/head of concentrate 2, whereas the ID2 group received 1 kg of corn silage and 2 kg of concentrate 2 per DM/heifer per day. Grass availability and/or quality were insufficient to maintain the desired growth rates during summer (heat stress). Standard diet and ID1 heifers then received, per DM/heifer per day, up to 2.5 kg of additional TMR3a, plus 1 kg of concentrate 2; ID2 heifers received up to 3 kg of TMR3b, plus 2 kg of concentrate 2. To achieve 380 kg at the end of outdoor season (when oestrus synchronisation started), the expected ADG for SD and ID1 heifers was estimated to be around 600 g/day during this period, with a feeding regime based on pasture plus 1 kg of concentrate 2, and 800 g/day when receiving grass plus TMR3a. For ID2 heifers, it was estimated that grass alone was not sufficient to reach 900 g/day during the same period and TMR3b was used (Table 1). This procedure, based on the feed intake of the heifers, grass composition and expected growth, was successfully tested during the previous 2010 and 2011 grazing seasons on similar heifers reared on the same paddocks. During the entire experiment, BW records (every 2 or 3 weeks) were compared with data collected during 2011 and 2012. If necessary, feed allowance was adjusted.
In the pasture area, a permanent headlock barrier (80 places on concrete floor) was used daily to feed SD and ID1 heifers with their concentrate. Heifers were locked for 1 h while eating. The SD2 group had free access to its ration, but was not locked, since it usually took several hours to eat the ration. At the end of the pasture season (6 November), heifers were group-housed (eight heifers per pen) on deep straw bedding and received 3.8 kg DM/head per day of a diet containing 79% corn silage and 21% soya bean meal. They had free access to fresh water, straw and mineral complements. After a 2-week adaptation period, oestrous cycles were synchronised in heifers, and the experiment ended (22 November).
Measurements and registration
Heifers were weighed every 14 days from birth to weaning, every 21 days from weaning until turning out to pasture, and every 28 days until the end of the experiment. BW of ID2 heifers at 12 and 15 mo of age was additionally retrieved and compared to SD and ID1 heifers BW at these stages. BW was corrected according to age, and daily gains were calculated. Daily feed allowances and refusals were also registered, on either an individual or a group basis. Heifer health and treatment information was recorded during the experiment; however, heifers were reared under strict control conditions and the results are not presented in detail in the present paper.
Blood samples
From 5.5 mo of age (on average), one 5 ml lithium-heparin tube was collected from the jugular vein at 10-day intervals to determine plasma progesterone. A second 5 ml lithium-heparin tube was collected at 6, 9, 12 and 15 mo of age for the plasma biochemical profile. Metabolite concentrations such as glucose or non-esterified fatty acids (NEFA) vary based on the time of feeding (Taylor et al., 2004). To limit such an effect, samples were performed at 1000 h, just before feed distribution. Plasma was separated by centrifugation at 3000 rpm for 15 min and stored at −20°C until analysis. Laboratory progesterone analysis was performed every 2 to 3 weeks, when enough samples were available to run assays. Heifers were considered pubertal once plasma progesterone concentrations were greater than 1.0 ng/ml and puberty attainment was declared. Age at puberty corresponded to the difference between the date of sample and birth date. When analysis showed progesterone level <1 ng/ml, samplings went on until the start of oestrus synchronisation.
Laboratory analysis
Blood samples were analysed to detect puberty based on changes in progesterone levels. Plasma samples were first thawed at 20°C and mixed, then progesterone analyses were performed with an AIA-360 Automated Immunoassay Analyzer (Tososh Bioscience Inc., San Francisco, CA, USA). Intra- and inter-assay variability were 12.3% and 7.5%, respectively. Blood samples collected at 6, 9, 12 and 15 mo of age were analysed to study metabolite changes and enzyme activities. Samples were thawed for metabolite analysis as above, but reaching 37°C. Analyses were performed on plasma metabolites (glucose, NEFA, β-hydroxybutyric acid (BHBA), total cholesterol, triglycerides, urea, total protein, albumin, creatinine, calcium (Ca), inorganic phosphorus (P), magnesium (Mg) sodium (Na), potassium (K), chlorine (Cl) and iron (Fe), and enzymatic activities (aspartate aminotransferase (AST), alanine aminotransferase (ALT), alkaline phosphatase (ALP), γ-glutamyltransferase (GGT) and tartrate-resistant acid phosphatase). An automated bio-clinical chemistry analyser (ILAB Aries, Instrumentation Laboratory, Lexington, MA, USA) using dedicated manufacturer-supplied kits was used, except for NEFA (NEFA-HR(2), Wako Chemicals GmbH, Neuss, Germany) and BHBA (Randox Laboratories Ltd, County Antrim, UK).
Calculations and statistical analysis
BW changes and puberty
Data on growth and puberty attainment were tested by ANOVA (SAS Institute Inc., 2009) in a randomised block design that included feeding treatments (three levels), age at reaching puberty (three classes) and their interaction as fixed effects. In these analyses, only heifers reaching puberty before oestrus synchronisation were used (n=56). Results are reported as least squares means and residual standard deviation with effects declared highly significant at P<0.001, significant at P<0.05 and as a trend at 0.05<P<0.10.
Blood and metabolites
Data on plasma metabolites were evaluated by repeated-measures ANOVA using the MIXED procedure of SAS/STAT software in SAS System for Windows v.9.3 (SAS Institute Inc., 2008). A first analysis was performed on data from all heifers (n=67) to assess the effect of dietary treatment. The main effects were diet during the experimental period (SD, ID1 and ID2), age at time of sampling (6, 9, 12 and 15 mo of age) and their interaction as fixed effects, with time of sampling as a repeated measure, and heifer within diet treatment (random effect) as an error term. A second analysis was performed on plasma data from heifers reaching puberty before oestrus synchronisation (n=56) to assess within-group differences obtained by stratification of the heifers according to age at reaching puberty. Three classes of age at reaching puberty were created: <9 mo of age (Gr1); 9 to 12 mo of age (Gr2); >12 mo of age until start of oestrus synchronisation (Gr3). The model included the three classes of age at puberty (Gr1, Gr2 and Gr3), age at time of sampling (6, 9, 12 and 15 mo of age), and their interaction as fixed effects, with time of sampling as a repeated measure, and heifer within diet treatment (random effect) as an error term. Block diagonal structure of the residual covariance matrix used in the analyses was determined by repeated measures on the same subjects. For each variable, different covariance structures were tested (simple, Compound Symmetry, Autoregressive, Ante-Dependence, unstructured), and the best was chosen by Akaike’s Information Criteria (Littell et al., Reference Littell, Henry and Ammerman1998). Least squares means were computed and pairwise-tested for each effect in each model. Simple Pearson correlation coefficients between age at puberty and the other dependent variables at the different times were calculated.
To identify which main plasma metabolites were able to predict the probability to be puberal before or at 1 year of age at 6 mo of age, a logistic regression was performed using R software (R Core Team, 2016). This way, considering the statistical significance of each factor within the regression, the relative odds ratio (OR) was evidenced to be discussed.
Results
Growth performance and puberty attainment
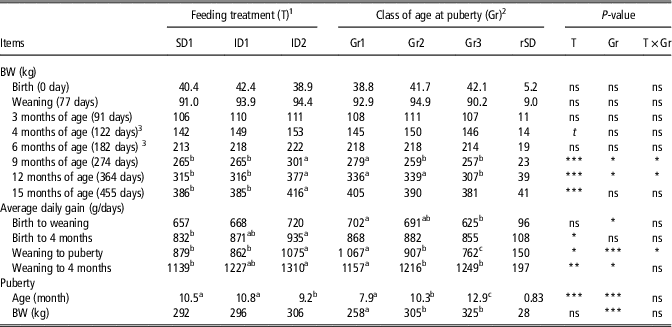
Analysis on growth performances according to feeding treatment or class of age at puberty from birth to 15 mo of age showed no significant difference among treatments or groups until 6 mo of age (Table 2). At 9 mo of age, ID2 (n=11) heifers were heavier than SD (n=22) and ID1 (n=23) heifers (P<0.001), at 301.2 v. 264.8 and 265.2 kg, respectively. The difference remained at 12 and 15 mo of age (+50 and +30 kg, respectively). Regardless of puberty onset (n=67; data not presented), no difference among treatments emerged until 6 mo of age. Thereafter, feeding treatment had an effect on growth, with ID2 (n=13) heifers having higher BW compared to SD (n=27) and ID1 (n=27) heifers at 9 mo (287±42 v. 262±21 and 263±24 kg; P<0.05), 12 mo (366±55 v. 312±24 and 313±28 kg; P<0.01) and 15 mo (405±56 v. 382±35 and 384±37 kg; P<0.01).
Main characteristics of Holstein heifers groups according to feeding treatment and class of age at puberty (least squares means, n=56)

ns=not significant; rSD=residual standard deviation.
a,b,cWithin feeding treatment or class of age at puberty, values within a row with different superscripts differ significantly at P<0.05.
1 SD, ID1, ID2: animals fed either on a standard (SD, n=22) or increased-plane (ID1, n=23 and ID2, n=13) feeding rearing programme.
2 Gr1, Gr2, Gr3 correspond to the three classes of age at puberty attainment before oestrus synchronisation: <9 months of age (Gr1, n=18), 9 to 12 months of age (Gr2, n=21), >12 months of age (Gr3, n=17).
3 4 months: total mixed ration 1 (TMR1) switched to TMR2; 6 months: turn out to pasture.
*P<0.05; **P<0.01; ***P<0.001, t: P<0.1.
The ADG calculated during these three different periods (Table 2) were higher for ID2 heifers, which consequently reached puberty 1 mo earlier than SD and ID1 heifers (9.2 v. 10.5 and 10.7 mo of age, respectively; P<0.001) but without a difference in BW (306 v. 292 and 296 kg, respectively).
By stratifying heifers on three classes of age at puberty, puberty was detected in 18 heifers before 9 mo (Gr1), 21 heifers between 9 and 12 mo (Gr2) and 17 after 12 mo and until oestrus synchronisation (Gr3) at an average age of 7.9, 10.3 and 12.9 mo, respectively (Table 2). Gr1, Gr2 and Gr3 groups of heifers were composed of 8, 7 and 3; 5, 8 and 8; and 9, 8 and 0 heifers of the SD, ID1 and ID2 feeding treatment groups, respectively. Within each group of age at puberty, age at cycling was always lower for ID2 heifers. As shown above, on average, ID2 heifers reached puberty at a lower age (Table 2) and in accordance with this, the three ID2 heifers in Gr1 were the youngest to show cyclicity (at 6.2 mo for the youngest). Gr1 heifers had a lower BW at puberty than Gr2 and Gr3 heifers (258 v. 305 and 325 kg, respectively; P<0.001). ADG from weaning to puberty significantly differed among treatments, by 1 067, 907 and 762 g/day on average for Gr1, Gr2 and Gr3 heifers, respectively.
Metabolic profiles
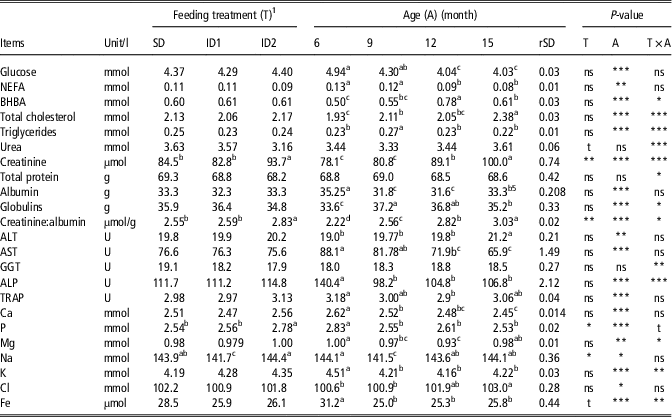
Except for plasma urea, total protein and GGT, all the other parameters showed an age effect (Table 3). Glucose, NEFA, albumin, AST, ALP, Ca, P, K and Fe levels decreased with age, whereas BHBA, total cholesterol, creatinine, the creatinine:albumin ratio, ALT and Cl levels increased from 6 to 15 mo.
Plasma parameters in each group of Holstein heifers according to age and feeding treatment during the rearing period (least squares means; all animals, n=67)

rSD= residual standard deviation; NEFA=non-esterified fatty acids; BHBA=β-hydroxybutyric acid; ALT=alanine aminotransferase; AST=aspartate aminotransferase; GGT=γ-glutamyltransferase; ALP=alkaline phosphatase; TRAP=tartrate-resistant acid phosphatase; Ca=Calcium; P=inorganic phosphorus; Mg=Magnesium; Na=Sodium; K=potassium; Cl=Chlorine; Fe=iron.
a,b,c,dWithin feeding treatment or age, values within a row with different superscripts differ significantly at P<0.05.
1 SD, ID1, ID2: animals fed either on a standard (SD, n=27) or an increased-plane (ID1, n=27 and ID2, n=13) feeding rearing programme.
Significant differences: *P<0.05; **P<0.01; ***P<0.001, t: P<0.1; ns: not significant.
Feeding treatment (67 heifers, Table 3) only affected plasma creatinine, the creatinine:albumin ratio, and P and Na levels, which were higher in ID2 compared with SD and ID1 heifers. Plasma Fe was lower in ID1 compared with SD heifers. A trend was observed for plasma urea, with lower values (P<0.05) in ID2 compared with SD and ID1. There was an age × feeding treatment interaction on many plasma parameters; some data are available in Supplementary Figure S1. This shows higher cholesterol and creatinine at 12 and 15 mo (b, d), ALP at 9 mo (e), and BHBA at 15 mo (a), but lower cholesterol at 9 mo (b), urea at 9 and 12 mo (c) and BHBA at 6 mo (a) in ID2 heifers in comparison with ID1 and SD heifers.
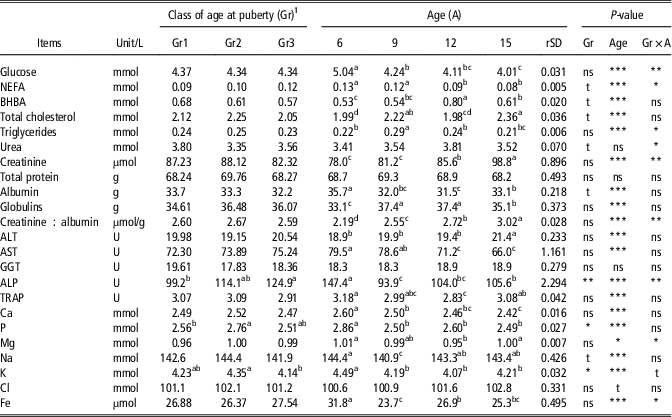
Comparison of groups classed by age at puberty revealed significant differences on some plasma metabolites and mineral concentrations (Table 4). Gr3 heifers showed lower levels of plasma BHBA, total cholesterol, albumin and K, and higher levels of NEFA and ALP compared with Gr1 and Gr2 heifers. There was a class × age interaction on many plasma parameters; some data are available in Supplementary Figure S2. This shows lower glucose at 9 mo (a), but higher NEFA at 12 mo (b) and ALP activity at 6 and 15 mo (d) in Gr3 heifers in comparison with Gr1 and Gr2 heifers. Urea was lower at 9 and 12 mo (c), but creatinine was higher at 12 mo (c) in Gr2 heifers in comparison with Gr1 and Gr3 heifers.
Plasma parameters in each group of Holstein heifers according to age and class of age at puberty attainment (least squares means; n=56)

rSD= residual standard deviation; NEFA=non-esterified fatty acids; BHBA=β-hydroxybutyric acid; ALT=alanine aminotransferase; AST=aspartate aminotransferase; GGT=γ-glutamyltransferase; ALP=alkaline phosphatase; TRAP=tartrate-resistant acid phosphatase; Ca=Calcium; P=inorganic phosphorus; Mg=Magnesium; Na=Sodium; K=potassium; Cl=Chlorine; Fe=iron.
a,b,c,dWithin class of age at puberty or age, values within a row with different superscripts differ significantly at P<0.05.
1 Gr1, Gr2, Gr3 correspond to the three classes of age at puberty attainment before oestrus synchronisation: <9 months of age (Gr1, n=18), 9 to 12 months of age (Gr2, n=21), >12 months of age (Gr3, n=17).
Significant differences: *P<0.05; **P<0.01; ***P<0.001; t: P<0.1; ns: not significant.
Pearson correlations and logistic regression on puberty attainment
As expected, age at puberty correlated with BW at puberty (r=0.68; P<0.001, data not shown). The correlation between age at puberty with BW and plasma parameters (Table 5) was negative at 6 mo with glucose and cholesterol; at 9 mo with BW, glucose and albumin; at 12 mo with BW and BHBA, and at 15 mo with BW, albumin and BHBA. On the contrary, positive correlations were observed at 6 mo for ALP, at 12 mo for glucose, NEFA, Ca and Mg, and at 15 mo for ALP.
Pearson’s correlations between age at puberty with BW and selected plasma parameters at different stages of growth in Holstein heifers (based on the 56 animals presenting oestrous cyclicity before hormonal synchronisation)

ALP=alkaline phosphatase; BHBA=β-hydroxybutyric acid; NEFA=non-esterified fatty acids; Ca=Calcium; Mg=Magnesium.
Significant differences: **P<0.01; *P<0.05; t P<0.1.
The logistic regression analysis used to estimate the probability that heifers reached puberty before or after 12 mo based on BW and plasma parameters at 6 mo of age (Supplementary Table S1) indicated positive coefficients for NEFA and cholesterol (P<0.05), but negative coefficients for Fe concentrations (P<0.05). A trend was found for BHBA (P=0.052), urea (P=0.07), ALT (P=0.09) and Ca (P=0.09). The most significant predictor measured at 6 mo of age for puberty attainment at 12 mo, with an OR=9.05 for each unit of increase in plasma, was cholesterol.
Discussion
Feeding treatment: growth performance and plasma profile
BW at the different stages of growth was considered adequate for a first calving at 24 mo of age or less, as a result of feeding treatments used to reach targeted weights. However, a huge variation in BW, as expressed by its standard variation, was noted. This is not uncommon in most studies dealing with animal growth, and often originates from individual variation in ADG during the growing period (Brickell et al., Reference Brickell, McGowan and Wathes2009). This may compromise the targeted BW for 1st AI at 15 mo or less and 1st calving at around 24 mo of age, which is around 360 kg in United States (Hoffman, Reference Hoffman1997) or 360 to 380 kg in France (Le Cozler et al., Reference Le Cozler, Lollivier, Lacasse and Disenhaus2008) for Holstein cows. A high growth rate from birth to 1st AI at 15 mo of age is generally recommended for first calving at 24 mo of age, and ADG is close to 750 g/day (Wattiaux, 1997). When first inseminated at 12 mo of age and for a similar BW, ADG should then be around 950 g/day. In the present study, heifers reached the target BW at the start of the reproductive period, even those born late during the previous calving season (ID2). In this study, the ADG from birth to weaning was higher in heifers reaching puberty at an early age (Gr1), but without any effect due to the feeding treatment. As feed availability was not limited in any groups, it is suggested that genetic and/or feed efficiency components are probably involved in such variations and differences (Pryce et al., 2014). However, the results indicate that for an early age at puberty and consequently, at first insemination, the ADG during the milk-feeding phase is of crucial importance. In complement to optimal development, puberty was also reached at an early age for most heifers. The concept of puberty attainment as a function of reaching a specific fixed proportion, not only of a mature BW but also of a mature body size (height), has been stressed by several authors (Fox et al., Reference Fox, Van Amburgh and Tylutki1999; Duplessis et al., Reference Duplessis, Cue, Santschi, Lefebvre and Lacroix2015). Mature BW and mature body height can be estimated by random regression within each breed (Cue et al., Reference Cue, Pietersma, Lefebvre, Lacroix, Wade, Pellerin, de Passillé and Rushen2012). Puberty onset at 9 to 10 mo of age or less meant that three or four oestrous cycles occurred before insemination, which is generally consistent with good fertility results in many species (Lin et al., Reference Lin, McAllister, Batra, Lee, Roy, Vesely, Wauthy and Winter1986; Byerley et al., Reference Byerley, Staigmiller, Berardinelli and Short1987; Robinson, Reference Robinson1990; Le Cozler et al., Reference Le Cozler, Dagorn, Lindberg, Aumaître and Dourmad1998). Regardless of calving strategy, lowering the age at puberty and, consequently, the age at first insemination is an efficient way to shorten the non-productive period before calving. However, as suggested by Meyer et al. (Reference Meyer, Capuco, Ross, Lintault and Van Amburgh2006), it might reduce pre-pubertal mammary gland development by shortening the allometric phase of mammary gland growth and, in some cases, impair further milk production. Investigations on these aspects are still ongoing and not presented or discussed here.
Until 6 mo of age, BW was not affected by the feeding treatment. Indeed, during the milk-feeding phase, all heifers had free access to TMR1 and thus, SD heifers probably compensated for the lower milk allowance (−15% compared with ID1 and ID2) by feeding higher TMR1. The level of feeding (milk and/or TMR) due to feeding treatments in this experiment was higher than those observed in many commercial farms and certainly could partially explain the lack of difference. After 6 mo of age, only ID2 heifers were fed an intensive diet; as a result, they presented better growth, not only reflected by BW and/or ADG changes, but also by higher plasma levels of ALP and P (at 9 mo) and total cholesterol and creatinine (at 12 mo). The possible anabolic effect of the season (Tucker et al., Reference Tucker, Petitclerc and Zinn1984) due to photoperiod exposure in the 1st mo of life was limited in the present study. It is suggested that a limited effect of photoperiod exposure during the 0 to 6 mo of age stage, when heifers were fed a high level of nutrients and/or that the effect of a photoperiod at this time of year, might be limited.
Glucose, NEFA and urea levels were within the range of those in most published papers (Taylor et al., Reference Taylor, Beever, Bryant and Wathes2004; Brickell et al., Reference Brickell, McGowan and Wathes2009). When comparing plasma parameters according to age, in many cases, the highest differences were observed at 6 mo, confirming that most biochemical variables are age-dependent in dairy (Abeni et al., Reference Abeni, Calamari, Stefanini and Pirlo2000; Abeni et al., Reference Abeni, Calamari, Stefanini and Pirlo2012) and beef (Rodríguez-Sánchez et al., Reference Rodríguez-Sánchez, Sanz, Tamanini and Casasús2015) heifers, with the same timing schedule. Throughout the trial, a marked differentiation in plasma metabolite concentrations resulting from the higher supplementation to ID2 after 6 mo of age was noted. In fact, where SD and ID1 showed similar values and globally similar changes in energy (BHBA and total cholesterol) and protein-related metabolites (urea and creatinine), ID2 heifers differed on either plasma values or changes in time. Plasma glucose and NEFA did not differ among experimental groups, thus evidencing the lack of significant difference in energy availability during the monitored period. The decline of glucose levels from 6 to 15 mo of age, also noted by Samadi et al. (2014), was not affected by the feeding treatment. Increasing the level of feed during rearing, which resulted in higher BW and body condition score, improved metabolite homeostasis for these heifers and also resulted in a decreasing age at puberty. Many hormonal changes occurred in this case (insulin, IGF1, Leptin), in favour of earlier puberty attainment (Samadi et al., Reference Samadi, Blache, Martin and D’Occhio2014).
Urea mean levels (3.4 to 3.6 mmol/l) from 6 to 15 mo of age were considered to be a moderate value suitable for dairy heifers (Brickell et al., Reference Brickell, McGowan and Wathes2009). According to previous authors, a higher level would have reflected either too high an intake or too high a catabolism of the proteins, which would reflect non-optimal feeding strategies. The lower plasma urea in ID2 at 9 and 12 mo of age is probably attributable to the limited shift from pasture to TMR intake that decreased the impact of a generally highly degradable source of protein (the pasture). Previous papers (Abeni et al., Reference Abeni, Calamari, Stefanini and Pirlo2000; Abeni et al., Reference Abeni, Calamari, Stefanini and Pirlo2012) on growing heifers also reported how plasma urea mirrors the level of nitrogen availability, both quantitatively and qualitatively (solubility). The higher plasma creatinine values of ID2 heifers at 12 and 15 mo of age were likely due to their higher body mass. If an increase in plasma creatinine-to-albumin ratio is read as a sign of body mass development (as confirmed by the trend in time during growth), then ID2 heifers evidently showed body mass growth earlier on than the other groups. These results confirmed how the supplementation in this trial supported early development in ID2 group.
The mean plasma P values were outside of the range reported for adult animals (Kaneko et al., 1997; Boudon et al., Reference Boudon, Graulet, Giger-Reverdin, Archimède and Meschy2018) but consistent for young heifers (Abeni et al., Reference Abeni, Calamari, Stefanini and Pirlo2000; Klinkon and Ježek, Reference Klinkon and Ježek2012). The higher plasma levels of inorganic P in ID2 heifers at 9 mo of age are likely attributable to the higher supplementation during pasture compared to SD and ID1. Similarly, plasma Mg and other mineral concentrations were also higher in ID2 heifers at 9 mo, and were within the physiological range reported by Boudon et al. (Reference Boudon, Graulet, Giger-Reverdin, Archimède and Meschy2018). To our knowledge, there are no papers specifically describing how to interpret Mg levels in heifers.
Growth performance and class of age at puberty
The stratification according to class of age at puberty evidenced that heifers showing puberty at a late age (>1 year) had poor energy status (higher NEFA), probably due to a lower feed intake (lower total cholesterol and albumin), resulting in lower ADG until puberty, and higher ALP activity. As the main factors that can alter plasma ALP activity are age, puberty and BW, and the bone isoenzyme is mainly responsible for this variation, it can be hypothesised that the higher values observed were a consequence of the delayed puberty. Even if plasma cholesterol changes are tricky to interpret, the results of this present study would suggest that its level at 6 mo of age could be a good predictor of precocious puberty onset. If this result was masked at group level in the ANOVA, it was clearer when evaluated at the individual level in the logistic regression. In fact, the OR=9.05 (P=0.015) for plasma cholesterol suggests an important effect of this metabolite at the individual level as a marker of a favourable metabolism for puberty attainment. At the start of metabolic profiling (6 mo), plasma cholesterol concentration was similar among the three feeding treatment groups, but overall it was tendentially lower in heifers with delayed puberty onset. Thus, lower levels of BHBA and cholesterol for progesterone synthesis at 6 mo in these heifers indicates that cholesterol levels, rather than glucose concentration, could be considered an interesting indicator to predict early puberty attainment. Anderson et al. (Reference Anderson, Kalscheur, Clapper, Perry, Keisler, Garcia and Schingoethe2015) also noted that a high level of cholesterol during early stages of growth, due to feeding strategy, was related to the precocity of puberty attainment, in agreement with Rodriguez-Sanchez et al. (Reference Rodríguez-Sánchez, Sanz, Tamanini and Casasús2015). For heifers reaching puberty at an early age, the higher uptake of circulating cholesterol to produce progesterone (Yart et al., Reference Yart, Lollivier, Marnet and Dessauge2014) explains the difference in circulating cholesterol. Results of odd-ratios obtained from the logistic regression on puberty onset confirmed that the most significant variable was the concentration of plasma cholesterol. However, the optimal circulating value is yet to be found.
In conclusion, the tested feeding strategy had minor consequences on plasma metabolites, but clear effects on growth performance and age at puberty. This finding has important implications in commercial heifer herd management to reduce dairy herd replacement costs. Plasma metabolic profiles (cholesterol, NEFA and BHBA) at 6 mo of age, in conjunction with BW monitoring, have potential power to detect heifers at risk of delayed puberty. An earlier age at puberty could also be an effective way to produce a larger number of embryos in young Holstein dairy heifers of high genetic-merit used as embryo donors, and thus accelerate the genetic progress by reducing the interval between generations.
Acknowledgements
The authors would like to thank the technical staff of INRA’s experimental farm for taking care of the heifers and running blood samplings. They also thank the GALA association for providing funding for progesterone analysis.
Declaration of interest
The authors declare that the research was conducted in the absence of any commercial or financial relationships that could be construed as a potential conflict of interest.
Ethics statement
Experimental work has been conducted in accordance with French national legislation on the use of animals for research. Protocol received agreement (00944-02) from French Ethical Committee no. 7.
Software and data repository resources
None of the data were deposited in an official repository.
Supplementary material
To view supplementary material for this article, please visit https://doi.org/10.1017/S1751731118002422