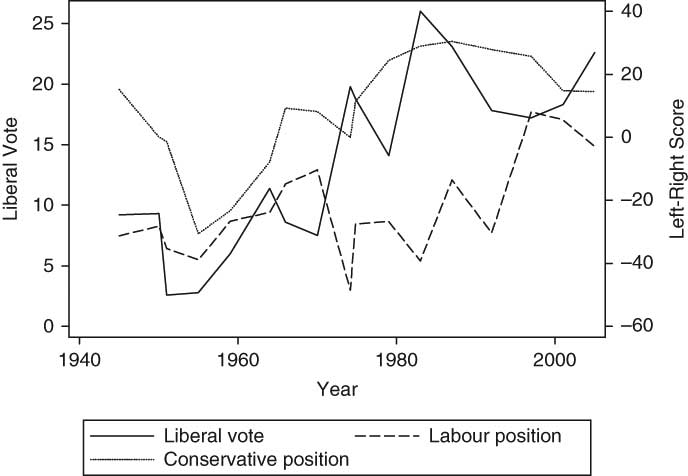
Two salient features of British politics over the past several decades must impress even a casual observer: the large share of votes won by centrist third parties – the Liberal Democrats and their predecessorsFootnote 1 – and the non-centrist policy positions frequently espoused by either or both of the major parties, Labour and Conservative. Both tendencies are evident in Figure 1, which displays left–right ideological scores of the Labour and Conservative manifestos for the seventeen elections since 1945, along with the Liberal share of the vote in Great Britain for each election.Footnote 2
Liberal Vote and Conservative and Labour Left–Right Scores, 1945–2005

After the Second World War, the Liberal vote nose-dived to near-extinction in 1951 and 1955. An upturn, modest at first, began in 1959. In 1964, the Liberal share exceeded 10 per cent for the first time in the post-war era. After declines in 1966 and 1970, the Liberals leapt to a 19.8 per cent vote share in the February 1974 election. The Liberal party and its successors have been continuously in double figures ever since, averaging 19.7 per cent of the British vote in the nine elections from 1974 through 2005. Despite their popularity at the polls, the Liberals have been cruelly under-rewarded by Britain’s first-past-the-post electoral system. Since 1974, their share of parliamentary seats has averaged only 4.6 per cent. At no time in the post-war era have the Liberals held any position in government, although for seventeen months in 1977–78, their support on motions of confidence sustained a Labour government led by James Callaghan.Footnote 3
The remarkable persistence of the Liberals despite the chronic under-representation and impotence in parliament runs counter to the usual expectation summarized in Duverger’s Law, which holds that it is difficult for third parties to form and remain successful over time in single-member-district plurality electoral systems, commonly known as first-past-the-post (FPP).Footnote 4 Even if one interprets Duverger’s argument as applying at the district level and not necessarily nationwide,Footnote 5 it is difficult to account for the Liberals. Although they have had disproportionate success in certain geographic areas, they compete throughout Britain and do not campaign as a distinctly regional party. In this they differ from most of the enduring minor parties in FPP systems, such as the numerous state-based parties in India, the Bloc Québécois in Canada, and two nationalist parties in Britain itself: Plaid Cymru and the Scottish National Party.
Just as the Liberals’ survival and relative electoral success defy Duverger, so also the positions taken by the major British parties often appear contrary to another seminal theoretical claim about politics in FPP systems – Anthony Downs’s prediction that parties will converge towards the policy position favoured by the median voter.Footnote 6 Figure 1 charts for Labour and Conservatives the left–right scores developed by the Comparative Manifesto Project (abbreviated to CMP, which we describe in more detail below). On the CMP scale, higher (positive) scores correspond to positions associated with the political right, whereas lower (negative) scores indicate positions on the left. As the graphs show, the two parties’ positions nearly converged in 1955 and 1959, when the CMP measure actually positions the Tories (Conservatives) as a left-of-centre party. This was just about the time when Downs published his famous book; but as has been observed of Karl Marx, Downs’s theory ceased to be true soon after he wrote it. By 1964, the Conservatives had embarked on a long-term movement to the right. In 1974, as Labour lurched to the left, a huge gulf opened between the major parties. Their positions remained sharply polarized through six elections and nearly two decades (1974–92), until Tony Blair and Gordon Brown moved Labour to the centre and victory in 1997, 2001 and 2005.
Thus, we observe in post-war British politics two striking phenomena – the revival and persistent strength of a centrist third party, and the non-convergent and often rather extreme left–right positions taken by two major parties. Are these unexpected tendencies connected? There are arithmetical, theoretical and empirical reasons to believe that they are.
Arithmetically, with a third party capturing 14–26 per cent of the vote, as the Liberals have for more than three decades, major parties obviously have a hard time winning an absolute majority of the popular vote (though under FPP they do not encounter comparable difficulty in winning a majority of parliamentary seats). In fact, no British government since 1931 has received the mandate of a majority of voters in the United Kingdom. Thus, British elections almost always produce pluralitarian outcomes, even though theorists mislabel the Westminster system and its rationale as ‘majoritarian’.Footnote 7 Plurality rule makes it numerically feasible for a major party to control the parliament even though its policy positions and electoral base are considerably to the right or left of centre. This is not to say that major parties will necessarily move out to the flanks, but the possibility of an off-centre victory is certainly there.
Theoretically, scholars recognize that Duverger’s and Downs’s hypotheses are interdependent. If there are just two competitors for office, each maximizes its vote by moving close to the median; but if there are more than two candidates, and electors vote sincerely for the option nearest their own position, then dispersion of competitors across the policy spectrum is likely to result. Under such multi-candidate competition, FPP systems will frequently fail to select the median optimum, even though that is the outcome prescribed pragmatically by Downs and normatively by the Condorcet-winner concept of majority rule.Footnote 8 Electing centrist, majoritarian governments thus depends on the ability of parties and/or voters to solve a co-ordination problem – they must act strategically to deny support to an ‘excess’ party even though its candidates espouse policies that many leaders and voters would favour if they expressed their true preferences.Footnote 9
Empirically, analyses of comparative politics reach similar conclusions. In a study of ten European proportional-representation (PR) systems, Hazan finds that stronger centre parties are associated with greater polarization on the part of other parties, which move more to the right and left, presumably because centrist strength makes them less able to compete for the median vote.Footnote 10 Such dispersion has benign consequences in PR systems. The need to build majorities in parliament pulls policies towards the median, because proportionality of seats and votes means that centre parties will usually have enough MPs to be pivotal in forming governmental or legislative coalitions. In contrast, under FPP, electorally strong centre parties produce self-defeating results. By under-representing centrist third parties, FPP elections manufacture a parliamentary majority for one of the major parties; and their dispersion towards the extremes frequently produces governmental outcomes relatively far from the median. Using different methods, two major studies show that the United Kingdom has performed especially poorly in this regard. In an analysis of outcomes in twenty democracies during 1977–98, Powell reports that the United Kingdom had the lowest score for average closeness of policy makers to the median citizen.Footnote 11 Over a longer period, from the early 1950s to 1995, McDonald and Budge similarly find that the British system ‘is the extreme case’ among twenty democracies in the degree of distortion between the median voter’s left–right position and the left–right position of the median party in parliament.Footnote 12
It is thus of interest not only for an understanding of British politics but also for democratic theory and the comparative study of democratic institutions to develop deeper insight into how Britain came to depart from the convergent two-partyism of the 1950s that served as a model for both Duverger and Downs. This article seeks to contribute to such an explanation by conducting a time-series analysis of party positions and electoral outcomes during 1945–2005. We first outline two mechanisms that might connect the policy stances of major parties to the votes won by a third party in the centre. After describing the data and methods that we employ, we present results confirming one mechanism for both Conservatives and Labour and the other mechanism for Conservatives only. Subsequent sections seek to explain that asymmetry and account for several distinct periods and the turning points between them. We conclude with a discussion of the implications of our findings for other democracies and for the future of British politics.
Two mechanisms
Our analysis begins with two working hypotheses, either or both of which might connect centre-party strength to major-party divergence.Footnote 13 We call these the ‘vacated centre’ and the ‘occupied centre’.
HYPOTHESIS 1. The vacated centre. This hypothesis helps explain the third party’s vote. If the major parties move to the right and left for reasons of their own – ideological convictions of leaders, internal caucus politics, influence of activists and funders – the Liberals fill the vacated centre and flourish by attracting unhappy moderates with nowhere else to go.
HYPOTHESIS 2. The occupied centre. This hypothesis seeks to explain positions taken by the major parties. Suppose that support for the centre party grows, perhaps for reasons independent of the left-right positions of the major parties–appealing leaders, effective organization or cross-cutting issues. Deserted by centrist activists and pessimistic about attracting moderate voters away from the Liberals, the Conservatives and Labour move right and left to please their remaining core supporters.Footnote 14
Hypothesis 1, the vacated centre, implies that non-centrist policy positions taken by one or both major parties during a particular electoral campaign are conducive to a larger Liberal vote in the same election. Hypothesis 2, the occupied centre, implies the opposite sequence – major-party divergence follows Liberal electoral success. Of course, it is also possible that both hypotheses are true. If so, major-party divergence and the centre vote would mutually influence each other over time in a positive-feedback spiral, as schematized in Figure 2. Needless to say, any such process in Britain must have been limited by other influences; otherwise, the Liberals would have either disappeared or displaced one of the major parties.
Vacated-centre and occupied-centre effects over time

Data and tests
The Liberal vote is easily available from the results of each election. As noted earlier (in footnote 2), we measure it as a percentage of the total popular vote in Great Britain only, i.e., excluding Northern Ireland. To test our hypotheses, we also need measures of major parties’ policy positions. Fortunately, such measures exist for all seventeen British elections since 1945, thanks to the work of Ian Budge and his collaborators in the Comparative Manifesto Project, formerly the Manifesto Research Group. As part of a continuing study of parties’ ideological positions in numerous democracies, the CMP developed a left–right scale based on the content analysis of party manifestos. The measure summarizes the frequency in a manifesto of statements about issues that the coders believe are generally identified with the political right (positive scores) compared with statements about issues identified with the left (negative scores).Footnote 15 Although not derived directly from a spatial assessment of policy positions, the CMP left–right scores over time correspond remarkably well to informed observers’ judgements; and political scientists often use them to track the ideological movements of British parties.Footnote 16
Because British parties publish manifestos at the beginning of a well-defined election period and usually adhere closely to manifesto themes in their campaigns, it is reasonable to posit a causal ordering in which manifesto positions influence voters’ choices in the corresponding election. If so, the vacated-centre hypothesis entails a one-period specification: the Liberal vote in election t will be greater when the Labour and Conservative manifestos for that election are relatively far to the left and right, respectively. The occupied-centre hypothesis, on the other hand, suggests a lagged relationship: if the Liberals have already demonstrated their appeal to centrist voters in the election at t, then the major parties will take manifesto positions relatively far to the left (Labour) and right (Conservatives) for the next election at t + 1.
Of course, it is also plausible that the value of each variable at t + 1 depends in part on its previous value at t, though statistical diagnostics indicate that this is not true in any of the regressions that follow.Footnote 17
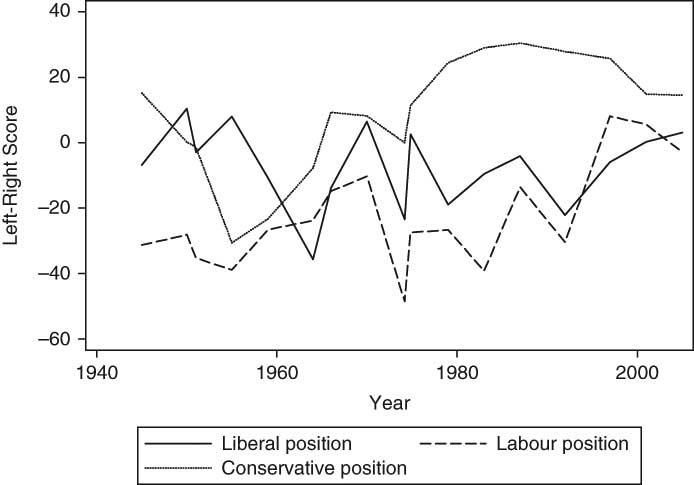
In tests of the vacated-centre hypothesis, we will measure the Labour and Conservative left–right positions by their distance to the left and right, respectively, from the score of the Liberal manifesto for the same election – i.e., by the algebraic difference between the major-party score and the Liberal score. This implies that the Liberals not only do not benefit from a relatively extreme stance taken by a major party if their own position is equally extreme, but also they lose rather than gain by out-flanking a major party. We will also test an alternative specification using absolute differences between major-party scores and the Liberal score. This model would imply that the Liberals gain from any distance between their own position and that of a major party, even one that results from out-flanking a major party. As Figure 3 and the data in the Appendix show that, according to CMP scores, on three occasions the Conservative party was positioned to the left of the Liberal party (1950, 1955 and 1959); and that on three other occasions (1964, 1997 and 2001), Labour was positioned to the right of the Liberals. (Figure 3 is similar to Figure 1, except that the graph for the Liberals in Figure 3 traces their left–right scores, whereas the Liberal line in Figure 1 shows their vote share.)Footnote 18
Left–right scores for the three parties, 1945–2005

Finally, our equations testing both the vacated-centre and occupied-centre hypotheses will include a control for time.Footnote 19 As is evident in Figure 1, over the period of our study there are overall (though very rough) tendencies towards an increasing Liberal vote and rightward movements in both the Conservative and Labour manifesto scores. Although the two mechanisms that we posit combine to generate a positive-feedback process that could account for some of these trends in the major variables, there could be other causes related to time at work. For example, sociologically speaking, Liberal support is greatest among the new middle class of well-educated knowledge workers in the public sector.Footnote 20 The growth of this group since the Second World War may help explain the upward trend in the Liberal vote. Similarly, global intellectual influences in favour of neo-liberal economics from the 1970s into the 1990s may help explain shifts to the right in both Conservative and Labour manifestos. Time will serve as a proxy for these unmeasured influences. We measure time in months, ranging from zero for the July 1945 election to 718 for May 2005, the last election in our series.
Results
To determine whether the Liberal vote was highest in years when Conservatives and Labour vacated the centre, we begin by regressing the Liberal share of the popular vote, VLib, on terms measuring how far the major parties diverged to the left and right of the Liberals for the same point in electoral time, t. These are LRCon–LRLib for the Conservatives and LRCon–LRLib for Labour. In addition, the regressions include Mt, the number of months since July 1945 that had elapsed for the election at t. The results follow, with figures in parentheses giving the t-statistic and two-tailed significance level for each regression coefficient:

N = 17; adjusted R 2 = 0.82; Durbin–Watson d (3, 17) = 2.29
Equation 1 strongly supports the vacated-centre hypothesis. The coefficient for the Conservative term is positive, meaning that the Liberal vote is larger the farther the Conservatives stand to the right of the Liberals. The negative coefficient for the Labour term implies that the Liberal vote is also greater when Labour takes positions farther to the left of the Liberals. (Remember that on the CMP scale negative scores mean that a manifesto emphasizes Left policies.) Although the coefficient for Labour is slightly larger than that for the Conservatives, in statistical terms, they are indistinguishable. This tells us that the positions of each party matter approximately the same to the Liberal vote.Footnote 21 Note also that the coefficient for Mt is positive and highly reliable, indicating that the Liberal vote has increased due to the influence of unmeasured variables associated with the passage of time over the 1945–2005 period.
Does the Liberals’ vote increase with any distance between their Left–Right position and that of a major party, even if the Liberals do not occupy the centre ground relative to that party? To test that possibility, we estimate Equation 2, which is the same as Equation 1 except for the use of absolute rather than algebraic differences in CMP scores.

N = 17; adjusted R 2 = 0.59; Durbin–Watson d (3, 17) = 1.36
Clearly, results for Equation 2 are far weaker than for Equation 1, as neither party distance measure is significant, or even close. Taken together with Equation 1, the results indicate that the Liberals have lost rather than gained when they were positioned to the right of the Conservatives or to the left of Labour. It would appear that their identity or ‘brand’ is as the centrist party, which gains them votes when either major party moves towards a more extreme position.Footnote 22
We turn now to our second hypothesis, the occupied centre. Do Liberal successes affect the next election by encouraging the major parties to adopt positions to the left and right, respectively? To test for this possibility, we estimated separate equations regressing the Labour and Conservative left–right scores against the Liberal vote in the preceding election.Footnote 23 The equations also include a control for time. We look first at the effect of Liberal success on Labour’s manifesto for the next election:

N = 16; adjusted R 2 = 0.27; Durbin–Watson d (3, 16) = 2.06
In Equation 3, we can see that the Labour position trends slightly to the right over this time period as a whole, but it has no association with the Liberal vote in the preceding election – the coefficient has the predicted negative sign, but is not even close to conventional levels of statistical significance.
Are the Conservatives similarly unresponsive to Liberal strength or weakness? The answer is a resounding ‘No’:

N = 16; adjusted R 2 = 0.76; Durbin–Watson d (3, 16) = 1.65
Here, there is an impressive relationship between the Liberal vote in the preceding election and the Conservative left–right position in the next election. The sign of the coefficient is as predicted by the occupied-centre hypothesis – larger Liberal votes tend to be followed by rightist Conservative positions. Remarkably, the effect of the lagged Liberal vote overwhelms the control for trend over time, which is insignificant in this equation.Footnote 24
To sum up, the statistical results confirm the vacated-centre hypothesis. The Liberal party and its successors have tended to win more votes the farther Labour stood to their left and the more the Tories stood to their right. The effects for the two major-party positions also are essentially the same. This finding is consistent with standard spatial models of voting, if one assumes that centrist voters (or at least a substantial fraction of them) cast sincere ballots despite the risk that votes for Liberal candidates will be ‘wasted’. In contrast to the symmetry of the vacated-centre effects, our test of the occupied-centre hypothesis yields asymmetric results. Although Labour’s position has not responded in any statistically reliable way to the Liberal vote in the preceding election, the association between the Conservative position and the preceding Liberal vote is very strong and consistent with the idea that Liberal occupation of the centre tends to push the major party to the right. Compared with standard spatial expectations, such behaviour on the part of the Tories (Conservatives) would seem both counter-intuitive and counter-productive.
Comparison with the historical record
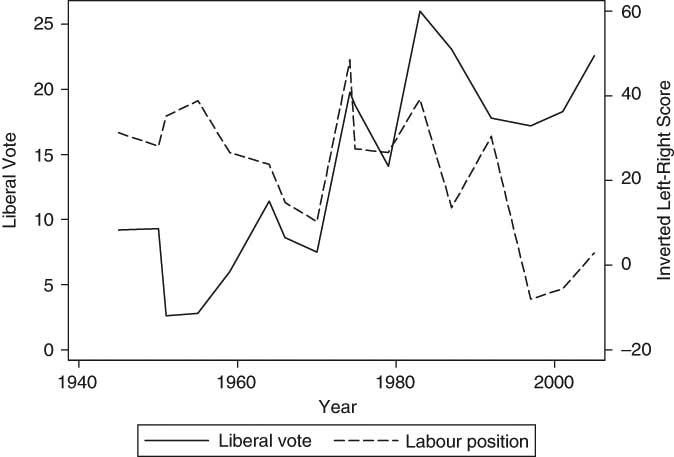
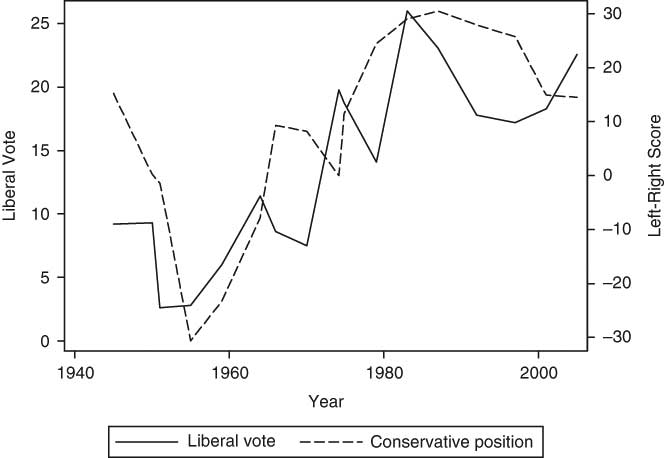
A danger in interpreting regression analyses of political data is that their results may be treated as timeless causal relations. In fact, a time-series analysis such as ours merely detects and highlights patterns in the historical record. These patterns are not necessarily invariant, because they can be influenced by societal evolution, institutional reforms and human agency. We therefore find it instructive to juxtapose the statistical results distilled in Equations 1 through 4 with the historical record as displayed in Figures 4 and 5, which chart the Liberal vote against the Labour and Conservative left–right scores, respectively. In contrast with Figure 1, which presents the same data, we have re-scaled the variables in Figures 4 and 5 so that the Liberal vote traverses the same space on each diagram as the major-party left–right score against which it is compared. In Figure 4, we have also reversed the Labour left–right score, so that leftist positions appear as higher values, which our hypotheses predict should be associated with higher Liberal votes. If one looks closely at Figures 4 and 5 in conjunction with the regression results, certain conclusions emerge about the relationship between the Liberal vote and the Labour and Conservative programmes:
Liberal vote and Labour left–right score, 1945–2005

Liberal vote and Conservative left–right score, 1945–2005

The Labour Party and the Liberal Vote
As Figure 4 shows, the Liberal vote and Labour’s left–right position do not track well at all, except for the seven elections from 1966 through 1987. During that period, the two graphs tend to move in unison, with no visible lags, which corresponds to the unlagged relationship posited by the vacated-centre hypothesis, with the Liberal vote responding to Labour’s manifesto. During 1966–87, did the Liberals’ occupation of the centre ground that Labour vacated push the latter even further to the left? The answer is ‘No’. Correlational analysis confirms our eyeball inference that there was no significant association between the lagged Liberal vote and Labour’s left–right score in this period, as Pearson’s r is 0.29 (p = 0.53). From one election to the next, Labour did not move back towards the centre to recapture voters who defected to the Liberals because of its leftist positions; but, contrary to the occupied-centre hypothesis, neither did it move farther left as the Liberal vote grew.Footnote 25
The Conservative Party and the Liberal Vote
In contrast to its short-lived association with Labour’s position, the Liberal vote tracks remarkably well with the Conservative left–right position through nearly all post-war elections. One can discern in Figure 5 a noticeable tendency for the Liberal vote to lead and the Conservative position to follow – an impression confirmed statistically by the results in Equation 4. However, Equation 1 also reveals some same-period influence in the other direction – the Liberals tend to do better when the Tories stray to the right and less well when they return to the centre.
Looking at the entire path of the graphs in Figure 5, four periods can be discerned. The two earlier and more distinct periods correspond to downward and upward movements in the positive-feedback cycle predicted by the vacated-centre and occupied-centre hypotheses. Between 1945 and 1955, the Conservatives moved monotonically to the left, while the Liberal vote contracted to the brink of extinction. In 1959, the Liberal vote began a long upward movement, rising (albeit with a few dips) to its peak in 1983, while the Conservative party moved almost continuously rightward from 1959 through 1987. With the drop in the Alliance vote in that year, our theory would predict a new downward cycle. That appears to have happened through the 1992 and 1997 elections, with the Liberal Democratic vote declining and the Conservatives moving (albeit slowly and gradually) back towards the centre. But in 2001 and 2005, the pattern did not continue, as the Liberal Democratic vote climbed without any corresponding rightward movement in the Conservative manifesto score. Figure 4 shows a slight move to the left by Labour in those years, but as one can see from Figure 3, there was little distance between Labour and the Liberal Democrats in either election, and therefore divergence between the two parties’ left–right positions probably cannot explain the third party’s gains.
Questions
The evidence we have developed to this point raises two clusters of questions about the course of politics in Britain since the Second World War:
— First, over the entire period, how might we explain the most striking of our findings, the strong tendency of the Conservative party to respond to Liberal strength or weakness by moving in counter-intuitive and sometimes counter-productive directions? Why, in contrast, has the Labour party been unresponsive to the Liberal vote?
— Secondly, what causes exogenous to our vacated-centre and occupied-centre mechanisms explain the four periods that we observe in the post-war era? Why did a cycle of Liberal decline and Conservative centrism occur after 1945? Why were the Liberals not completely annihilated in the 1950s, when their vote was squeezed by converging major parties and particularly by a Conservative party that had moved all the way to the centre-left? Why did a cycle of Liberal growth and major-party divergence begin in 1959 and continue to a peak in 1983? Finally, despite considerable convergence between the major parties in 2001 and 2005, why did the Liberal Democratic vote increase?
Asymmetry
Consistent with the vacated-centre hypothesis, the Liberal vote has responded symmetrically to positions taken by the two major parties since 1945 (Equation 1). In contrast, our tests of the occupied-centre hypothesis reveal strikingly asymmetric associations between Liberal fortunes and subsequent major-party positions: the Conservative party has tended to take positions more to the right after elections in which the Liberals polled strongly, whereas the Labour left–right position has had no statistical relation to the immediately previous Liberal vote (Equations 3 and 4). We shall consider three possible explanations for this asymmetry: (a) the ‘reverse shift’ effect proposed by Adams and Merrill; (b) greater vulnerability of the Conservative party to competition from minor parties on its ideological flank; and (c) differential impact of activist recruitment and defection on internal party politics.
The Reverse-Shift Effect
James Adams and Samuel Merrill suggest a mechanism that at first blush might seem to explain asymmetric responses by Conservatives and Labour to Liberal strength. This is the ‘reverse shift effect’, in which a move by the centre party towards the left induces rightward shifts by both major parties.Footnote 26 Their argument assumes that leaders of major parties seek primarily to achieve policy goals that are, respectively, considerably to the left and right of centre. When the third party moves to the centre-left, the party on the right gains vote share relative to its main competitor in two ways – it picks up centre-right voters whom the third party left behind, while the left party loses centre-left voters to the third party. Thus, the right party can afford to adopt the farther-right policies that its leaders truly desire. Meanwhile, the left party is forced to converge towards the third party in order to compete with it for centre-left voters.
Adams and Merrill contend that the reverse-shift effect fits the broad pattern of British politics since 1975, when Margaret Thatcher became the Tory leader. As Figure 3 shows, it is true that CMP left–right scores during this time correspond in a static sense to the predicted configuration – with the Tories mostly off to the right (higher scores), and Labour and the Liberals often positioned closer together with lower (centre-left) scores. But more fine-grained evidence gives at best inconclusive support for the hypothesis. The reverse-shift implies that the Liberal manifesto score should be negatively correlated with the manifesto scores of the major parties – for example, when the Liberals are more to the left, both Tories and Labour should be more to the right. Because Adams and Merrill give causal priority to the Liberal position, the fairest test is to correlate the lagged Liberal left–right score with major-party scores. The correlations with Labour and Conservative positions are, respectively, −0.35 and −0.36. Both have the predicted negative sign, but neither is statistically significant (p > 0.17). Moreover, when the lagged Liberal left–right score is added to Equation 4, its coefficient is insignificant. The lagged Liberal vote continues to do all the work in explaining the Conservative left–right score.Footnote 27 We conclude that as an explanation of asymmetric major-party responses to the occupied centre, Adams and Merrill’s reverse-shift hypothesis is insufficiently supported by evidence.
Competition on the Flanks
In addition to the reverse-shift effect, Adams and Merrill develop a second explanation as to why major parties might adopt more extreme positions when a third party occupies the centre. They call this the ‘policy divergence result’: when there is no third party, moving to the centre gains, in effect, two votes for each elector who is induced to switch – a vote added to the moderating party’s own tally and a vote subtracted from the party with which it competes for power. When the switch occurs at the expense of a third party, the real rival for power does not lose a vote. Nevertheless, major parties still have an incentive to move to the centre, albeit only half as strong, because they do gain one vote for each convert. In the Adams–Merrill theory, this weakened incentive is offset by the major parties’ policy objectives: their leaders prefer positions well to the left and right of centre.Footnote 28
By itself, the Adams–Merrill policy divergence result cannot explain asymmetry between the responses of Conservatives and Labour to the Liberal vote. Within their framework, one could perhaps posit an ad hoc argument that Conservative leaders have had stronger policy (as opposed to office-seeking) motives than Labour leaders, and/or that Conservative leaders have preferred more extreme policies than their Labour counterparts. Perhaps that has been the case, but we would suggest another, more pragmatic explanation. Besides genuine policy preferences, another pull away from the centre occurs when adopting moderate positions might provoke defections by a party’s more extreme supporters. Non-voting is one option, but disgruntled voters may be more likely to defect when they can cast a vote for a protest party.
Over the period of our study, parties to the left of Labour on the conventional spectrum attracted more than 100,000 votes in Great Britain only once – and that was at the very beginning of the period in 1945, when both the Communist party and the Common Wealth Movement slightly exceeded that number.Footnote 29 Since then, Labour has had serious threats on its flanks, but these have come from nationalist parties in Scotland and Wales. The Scottish National Party passed the 100,000 vote level in 1966 and has been continuously above it ever since. Similarly, Plaid Cymru in Wales has exceeded 100,000 votes in every election since 1970. The concentration of the nationalists’ votes in their respective regions has enabled them to win parliamentary seats, and they are often the main competitors to Labour in Scottish and Welsh constituencies. The threats they posed forced Labour to move in their direction by espousing and eventually enacting constitutional reforms that devolved power to newly established regional assemblies for Scotland and Wales. These policies, however, are orthogonal to the conventional left–right spectrum and do not show up as leftward moves on the CMP scale.Footnote 30
The Green party also surpassed 100,000 votes in 1992, 2001 and 2005. Although commentators often place Greens on the political left, the CMP codes for their main appeal (environmentalism), but does not include it in left–right scores. In this, the CMP follows the line of thought stemming from Ronald Inglehart, who sees ‘post-materialist’ Green ideology as orthogonal to the traditional left–right spectrum. In any case, the Greens in 2005 targeted their fire on Liberal Democrats, with whom they were competing directly for disaffected Labour supporters.Footnote 31
In contrast, the Conservative party felt significant pressure from minor parties on its right flank in most elections from the 1970s onwards. The National Front surpassed 100,000 votes in October 1974 and came close to 200,000 in 1979. In 1997, the Referendum party attracted over 800,000 votes while the United Kingdom Independence party (UKIP) tallied more than 100,000. Curtice and Steed note:
Many Conservatives, particularly those of a Euro-sceptic persuasion, believed that if the Referendum Party fought the election it could only succeed in taking votes away from themselves; thus they called for the party to adopt a more Euro-sceptic tone, particularly in respect of any single European currency, in the hope that this might persuade Sir James [Goldsmith, leader of the Referendum Party] to stand down.Footnote 32
The Referendum party dissolved when Goldsmith died soon after the 1997 election, but UKIP polled strongly in the next two elections. It garnered more than 600,000 votes in 2005, when the British National Party (BNP) also attracted nearly 200,000. As Philip Norton comments, Conservative leaders Iain Duncan Smith and Michael Howard were ‘prone to heed the call of traditionalists, some of whom … argued that moving to the right was necessary to see off a challenge from UKIP’.Footnote 33
In short, since October 1974, the Conservatives have had to deal with flanking threats from parties representing the traditionalist right in five of nine elections, whereas minor parties challenging Labour have been primarily about regionalism and environmentalism. In elections since 1997, the tallies are three of three versus nil for three. The difference in flanking threats may thus help account for the asymmetry in responses along the left–right scale by Tories and Labour to the Liberal vote since 1974, and especially since 1997. Nevertheless, it cannot explain the apparent tendency of the Conservative left–right position to follow the Liberal vote before 1974 (see Figure 5). Therefore, we need to consider an additional explanation.
Activist Composition and Internal Party Politics
A close look at Figure 5 reveals that, rather than moving rightwards at a constant rate as the Liberal (Alliance) vote reached historic highs in the 1980s, the Conservative left–right score increased at a decreasing rate, nearly levelling off before starting a downward trend after 1987.Footnote 34 As the Tories’ debacle with the poll tax in 1990 demonstrates, sheer political prudence requires that a party find and respect some limit as to how far it will move towards a right (or left) extreme. However, another possible explanation presents itself if we deconstruct the Liberal vote.
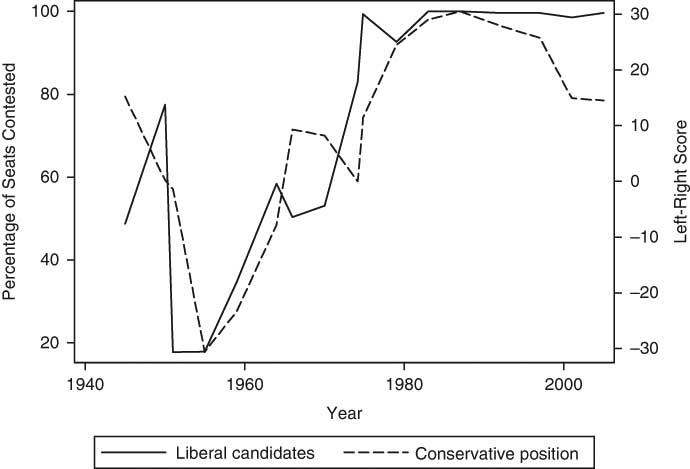
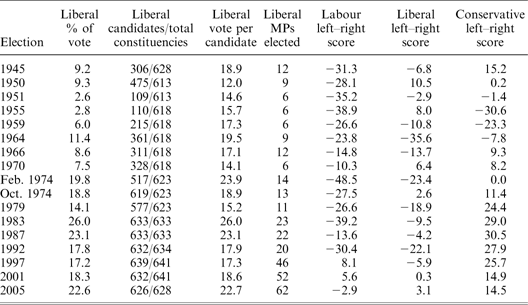
The Liberals’ share of the national vote can be analysed into two factors: the proportion of parliamentary constituencies contested by Liberal candidates, Clib, and the Liberals’ average vote share in constituencies they contest, V*lib.Footnote 35 Over the post-war period, V*lib fluctuated within a relatively narrow range of a little more than 2:1, reaching a low of 12.0 per cent in 1950 and a high of 26.1 per cent in 1983, when the Alliance of the Liberal and Social Democratic parties mounted the most formidable centrist challenge in that era. In contrast, the number of constituencies that the Liberals contested varied over a nearly 6:1 range, from a nadir of 109 in 1951 to 639 in 1997. The corresponding values of Clib range from 0.178 to 1.0. Moreover, Clib is subject to a natural upper limit of 1.0, when Liberals contest all parliamentary seats. As the data presented in Appendix Table A reveal, in all elections since 1983, the Liberal Democrats and their predecessors reached or approached that limit, contesting (at least nominally) nearly every constituency in Great Britain.
The two components of the Liberal vote are not just an analytic truism. They also serve as indicators of centre-party support at the activist and mass levels, respectively. The number of candidates reflects the willingness of notable or ambitious individuals to stand in the Liberal cause and of supporters to contribute time, money and other resources to sustain campaigns. The average vote per candidate, by contrast, roughly corresponds to the relative appeal of the party to ordinary voters when they are given the option of voting for a Liberal.Footnote 36 Which factor more strongly predicts the Conservative left–right position? To answer that question, we regressed the Conservative manifesto score (LRcon) against the two components of the Liberal vote, both of which lagged:Footnote 37

N = 16; adjusted R 2 = 0.83, Durbin–Watson d (3, 16) = 1.25
The indicator of strength among activists, the number of candidates fielded, wins hands down. Its coefficient is positive and statistically significant, whereas the coefficient of the mean Liberal vote, although positive, is weak and unreliable.
Figure 6 graphically demonstrates the closeness of the relation between constituencies contested by Liberals and the subsequent left–right position of the Conservative party. The two series correspond almost perfectly until 1997, when the Conservatives began to move back to the centre without any decrease in the proportion of constituencies that the Liberal Democratic candidates contested.
Liberal candidates and Conservative left–right score, 1945–2005

What accounts for this remarkable correspondence and for the absence of a similar relationship between Liberal candidacies and Labour’s left–right position?Footnote 38 We will suggest a possible explanation that we concede is speculative and in need of further research for confirmation. The argument depends on two propositions: (1) Because of social class, the kind of people attracted to activism in the Liberal party would be more likely to be involved with the Conservatives than with Labour if the Liberals were not an alternative – thus, Liberal strength affects the activist composition of the Conservative party; and (2) Conservative activists have had a substantial, though indirect, influence over the party’s manifesto positions.Footnote 39
Liberal strength affects the activist composition of the conservative party
As commentators often note, the Liberals and Conservatives are both middle-class parties. On the basis of an analysis of British Election Study data for 1974–2001, Fieldhouse and Russell demonstrate ‘the similarity in the class profiles of Conservative and Liberal voters’. Parallel conclusions were drawn by Alt, Crewe and Särlvik for core Liberal voters in the breakthrough year of 1974 and by Curtice for Liberal Democratic voters in 1992. As commentator David Walker observed in 2000, ‘Lib Dem voters … turn out to be remarkably similar to Tory voters in their middle-classness.’Footnote 40 Because attitudes and loyalties linked to social class are so important in Britain, we would expect that would-be party activists would usually find it easier to transfer their support between Conservatives and Liberals than between Labour and Liberals, because potential defectors from the Tories, unlike many who might consider leaving Labour, do not have to cross ‘tribal’ boundaries linked to social class and trade union membership. As Cyr noted, ‘Class and associated conflicts not only built the Labour Party and demolished the Liberals, it also made the breach between Liberals and Labour especially permanent.’Footnote 41 If the Liberal and Conservative parties are alternative political vehicles for the middle (and upper) classes, then one must suppose that the years of Liberal decline resulted in an influx of centrists into Conservative party branches, and the subsequent Liberal rise must have depleted Tory ranks of potential centrist leaders and activists. If this reasoning is correct, then Liberal occupation of the centre caused a vacation of the centre first within the Conservative party and then by the Conservative party, as activists who might otherwise have been a force for moderation turned to the third-party alternative, helping create a vicious cycle.
We do not mean to suggest that these compositional effects resulted primarily from particular individuals moving back and forth between Liberal and Conservative activism, although some no doubt did. Because these processes occurred over many years and, for most people, political activism is a relatively brief phase in one’s life, it is enough to argue that, as the Liberals gained strength, the type of middle-class moderates who would have been comfortable in a Conservative party branch in the 1950s were more likely to have found a political home in Liberal constituency organizations. We also do not mean to suggest that the actual number of activists within the Liberal and Conservative parties moved in inverse directions. Our focus is on the composition of activists in the different parties, not their sizes. Indeed, during the period of Liberal resurgence, there was a secular decline in the number of individual members in all three parties.Footnote 42 This may be part of a broader pattern across European democracies.Footnote 43
Conservative activists’ influence over the party’s manifesto positions
The Conservative party has always put the writing of its manifesto under the control of the party leader. The leader in turn was selected informally by senior party figures until 1965, when reforms established a process of election by party MPs. In 1998, new reforms gave the final vote on the leader to the party’s mass membership, with MPs first narrowing the field of candidates to two, unless they produced only one candidate, in which case the choice of leader remained entirely theirs (as happened in 2003, when MPs elected Michael Howard).Footnote 44 The shift to (or threat of) membership elections is often blamed for the Tories retaining a right-wing image so long after their defeats in 1997 and 2001, although rank-and-file members had the final say in choosing not only the relatively right-wing Iain Duncan-Smith in 2001, but also the modernizing David Cameron in 2005. However, most of our data are from elections before the membership had a direct role in selecting the leader. How would changes in the party’s activist base have influenced the leader’s policies, and thus the manifesto, in those years? One constant feature of internal Conservative party politics throughout the post-war period has been the fact that party members at the constituency level have the final say in choosing parliamentary candidates. Prospective candidates must be drawn from a pool of eligibles defined by the Conservative Central Office, but approved candidates must then apply to constituencies, which ‘themselves select candidates in three stages: a selection committee and then the constituency executive committee whittle down applications to a short-list from which the constituency members choose a candidate at a special general meeting of the constituency association’.Footnote 45
Thus, the dramatic association between Liberal candidacies and Conservative left–right positions may be explained by the following intervening chain of influence: Liberal strength or weakness on the ground → ideological composition of Conservative activists → selection of (and influence over) Conservative MPs → selection of Conservative leaders → Conservative policy positions as reflected in CMP left–right scores. Lest this schema seem too attenuated and abstract, we conclude with a pithy observation from 2001 by Paddy Ashdown, the Liberal Democratic leader in 1988–99, who commented about one link in the chain: ‘We have a huge secret weapon – the Tory membership. It always and consistently selects the wrong person.’Footnote 46
Periods and turning points
Statistical analyses only take us so far. They do a good job of explaining trends in certain periods, but do not provide a complete understanding. We will now consider what the statistics do not explain by returning to the second cluster of questions posed earlier (see subsection entitled ‘Questions’). From Figures 1, 5 and 6, four eras are visible in British politics since the Second World War. The two early periods are clear cut: in 1945–55, the Liberal vote spiralled downwards while the Conservatives moved strongly to the centre (or even, by the CMP measure, to the centre–left). During 1959–83, the Liberal vote trended sharply upwards, while the Conservatives moved almost steadily ever more to the right. The positive-feedback process implied by the vacated-centre and occupied-centre hypotheses explains both of these downward and upward movements, but it can account neither for the Liberals beginning our time series heading downwards, nor for their tailspin being arrested and reversed in 1959. Patterns in the quarter century after 1983 are less distinct, but from the peak in 1983 through 1997 one can discern a new downtrend in the Liberal Democratic vote followed by a gradual Conservative move back to the centre. However, 2001 and 2005 are difficult to explain using our substantive variables, as the Liberal Democratic vote trended upwards, even though the Tories did not move rightward according to the CMP measure. We now briefly consider what causes outside the model might account for the three turning points and the recent anomaly.
Why Did a Cycle of Liberal Decline and Conservative Centrism Begin in 1945?
Although the Liberal party’s 9.2 per cent share of the vote in 1945 was not much worse than the aggregate Liberal and National Liberal vote in 1931 and 1935, candidates of the divided party were far more successful in winning seats in those pre-war elections, with sixty-seven victories in 1931 and fifty-four in 1935.Footnote 47 The meagre total of only twelve MPs in 1945 was a severe disappointment that set in motion a spiral of decline. According to histories of the Liberal party, its poor showing in 1945 reflected well-known internal divisions from the First World War onwards and the party’s uncertain identity during the Second World War coalition government. Liberals entered the 1945 campaign organizationally ill-prepared, riven by conflicts over strategy, and sending confusing signals to voters.Footnote 48
Why Did the Liberals Not Disappear in the 1950s?
After the Liberals held steady at the low level of 9.3 per cent in 1950, the Conservatives in 1951 moved almost exactly to the centre of the CMP scale, scoring −1.4 – slightly to the left of the 5.6 estimate yielded by Equation 4. The Liberal vote in that year fell below the 7.8 per cent that would be estimated under Equation 1, as it dropped precipitously to just 2.6 per cent.Footnote 49 The proximate explanation for such a poor showing is organizational and financial weakness, as the party was able to field only 109 candidates, compared with 475 in 1950 (see the Appendix). With just six MPs elected, it appeared that the Liberals were on the verge of extinction. In 1955, the Conservatives moved even farther to the left than the −20.8 estimated by Equation 4, but the Liberals maintained their toehold on survival, winning 2.8 per cent of the vote and six seats.
Most observers agree that Liberal survival in the 1950s depended on loyalties rooted in cleavages antecedent to the twentieth-century emergence of economic class as the main source of party identification – religion and, closely associated with it, the ancient struggle of the periphery against the centre. Liberal pockets of strength in the 1950s were almost entirely confined to rural areas of the Celtic fringe – southwest England, northern Wales and parts of Scotland.Footnote 50 In those regions, many voters reject the Tories as the party of established churches and the English centre, but they are reluctant to turn to Labour because of its identification with urban industrialism and trade unions. Indeed, as Steed points out, the Liberals’ disproportionate dependence on a nonconformist, Celtic base continued well past their nadir in the 1950s. From 1945 through 1992, ‘there [were] 157 occasions on which a Liberal or Liberal Democrat [was] elected at a general election; of these more than two-thirds [were] in rural parts of the Celtic fringe,’ whereas representatives of those areas comprised only 7 per cent of the House of Commons.Footnote 51 Thus, to account adequately for Britain’s centrist third party, and particularly for its survival when most threatened by major-party convergence, one must resort to a multi-dimensional explanation of politics.Footnote 52
However, the persistence of historic cleavages cutting across the left–right spectrum is not the whole story of Liberal survival in the 1950s. As Conservative leader until 1955, Winston Churchill (himself an ex-Liberal) and his party chair, Lord Woolton, ‘believed that the Conservative Party must greatly broaden its appeal, and in particular that they must win the support of Liberals … Instead of relying mainly on wealthy people and their deferential hangers-on, they made a massive effort to recruit middle-class and even working-class members’.Footnote 53 As part of that courtship, Conservatives refrained from standing candidates against Liberal MPs except any who were considered likely to co-operate with Labour. Consequently, of the six Liberals elected in 1951 and 1955, only Jo Grimond faced a Tory opponent. Given even modest estimates of the potential Conservative vote in the other Liberals’ constituencies, it is likely that three of the five would have lost to Labour opponents were it not for the Tories’ forbearance.Footnote 54 An even more crucial juncture came after the Conservative victory in 1951, when Churchill offered a cabinet position to the Liberal leader, Clement Davies. Davies was tempted, but his colleagues persuaded him to decline. According to historian David Dutton, ‘So low were Liberal fortunes at this time that, had Davies accepted, the remaining party could easily have disintegrated.’Footnote 55
Why Did a Cycle of Liberal Growth and Major-Party Divergence Begin in 1959?
In light of the positive-feedback mechanism implied by our statistical results, special importance must be assigned to the change of direction in 1959, when Liberals emerged from their near-death experience and began an upward trend in popular votes that continued (with a few dips) through 1983. The 1959 vote share of 6.0 per cent more than doubled their 1955 vote. That improved showing was only 1.04 per cent higher than Equation 1 estimates, and therefore 1959 is not an outlier in terms of our model, but it does represent a sharp reversal after two straight results that were large negative outliers. Using CMP measures, only a small part in the change in fortune can be attributed to an exogenous move rightward by the Conservative party. From their all-time most leftward position in 1955 (−30.6 on the CMP scale), the Tories shifted only slightly to the right in 1959 (to a score of −23.3). The biggest move on the CMP scale in 1959 was by the Liberals themselves, from an 8.0 score in 1955 to −10.8; nevertheless, they remained to the right of both Labour and the Conservatives for a third (and final) year.Footnote 56 Although it was only a modest improvement, the Liberal gain in 1959 helped set in motion sharper Conservative shifts to the right in 1964 and 1966, which vacated more ground in the centre for Liberals to occupy.
Moving behind the abstractions of CMP scores and regression estimates, historians offer two explanations for the Liberal improvement in 1959. First, in 1956, Jo Grimond had replaced the ageing and uninspiring Clement Davies as party leader. Under Grimond’s vigorous leadership, the party rebuilt constituency organizations, improved finances and almost doubled the number of parliamentary candidates, from 110 in 1955 to 216 in 1959.Footnote 57 As The Times commented when Grimond stepped down in 1967, ‘Because he looked the equal of the other party leaders, it was possible to believe that the [Liberal] party itself might one day win the same equality.’Footnote 58 Secondly, the Suez debacle in 1956 attracted more candidates and supporters to the Liberal cause. According to Dutton:
[F]or the Liberal party this was a watershed, all the more poignant because of [Prime Minister Anthony Eden’s] well deserved reputation until this time for commitment to the principles of liberal internationalism … For at least a generation, the image of the Conservatives as the natural repository for the best traditions of British Liberalism had been destroyed. Many former Liberals returned to the party fold. Others looked to it for the first time.Footnote 59
What Accounts for the Electoral Topography of 1964–97?
The basic contours of British elections from 1964 to 1997 are congruent with the positive-feedback model of the vacated-centre and occupied-centre hypotheses, as refined in Equations 1, 4 and 5. Broadly speaking, the Conservatives moved rightward in tandem with a rising Liberal vote until the latter reached its high-water mark with the Alliance campaign of 1983, the year in which the left–right gap between Labour and Conservatives reached its all-time peak. In that year, the main driver of the Conservative left–right position – the number of Liberal candidates – reached its upper limit. Subsequently, the Tory CMP score remained on a plateau through 1997.
Although Figure 6 leaves little to explain about the Conservative left–right position, Figures 4 and 5 do exhibit one large drop in the Liberal vote that is not well explained by Labour and Conservative manifesto scores. That dip, in 1979, no doubt owed much to a sensational scandal. While the campaign was being fought, Jeremy Thorpe, the Liberal leader during 1967–76 and still an incumbent partliamentary candidate, was awaiting trial on charges of conspiring to murder Norman Scott, who in 1976 claimed a homosexual relationship with Thorpe, a charge that (along with a financial scandal) led to the latter’s standing down as leader.Footnote 60
Why Are 2001 and 2005 Anomalous?
In Figures 3, 5 and 6, the two most recent elections, 2001 and 2005, appear anomalous. Following New Labour’s dramatic move to the centre in 1997, much of the remaining gap between the major parties was closed in 2001 and 2005 as the Conservatives adopted more moderate manifestos. Nevertheless, the Liberal Democratic vote share rose by a modest 1.5 per cent in 2001 and a marked 4.3 per cent in 2005. The party did even better in winning seats, as its number of MPs increased from forty-six in 1996 to fifty-two in 2001 and sixty-two in 2005.
Why did the Liberal Democrats do so well in 2001 and, especially, 2005? Analyses of these elections often point to targeting of campaign resources on winnable seats and high levels of tactical voting by Labour supporters in constituencies where Liberal Democratic candidates were the main competitors to Conservatives. Tactical voting undoubtedly helps explain the Liberal Democrats’ improved efficiency in converting votes to seats from 1997 onwards, but it cannot account for higher vote shares in 2005. According to survey data from the 2005 British Election Study, 3.1 per cent of voters who preferred other parties cast tactical ballots for Liberal Democratic candidates, but an even larger 3.4 per cent of voters preferred the Liberal Democrats but deserted them to vote tactically for a major-party candidate. The corresponding figures for 2001 were 3.6 per cent and 3.3 per cent.Footnote 61 Thus, changes in tactical voting account for a net loss of 0.6 per cent in the Liberal Democratic vote between 2001 and 2005, requiring us to explain the actual gain of 4.3 per cent by other causes.
In 2005, the most obvious boost to Liberal Democrats resulted from their opposition to Prime Minister Tony Blair’s commitment of British forces to the American-led invasion and occupation of Iraq. Because Conservatives generally supported the government on this issue, the Liberal Democrats became the main outlet for voters who were disillusioned with Labour because of the war.Footnote 62 Observers sometimes also suggest that in both 2005 and 2001, the Tories’ campaign rhetoric and leadership image were not as centrist as their manifesto scores.Footnote 63 Iraq was presumably a temporary issue, and after the election of David Cameron as leader in December 2005, the Conservative party acted more decisively to modernize and moderate its image. If that move to the centre is sustained, the next election will provide a test of whether the Liberal Democrats’ prosperity in 2005 was an anomaly or a harbinger of lasting shift in the relationship of their vote to the major parties’ positions.
Conclusion
In the preceding pages, we have covered much ground, and therefore it may be useful to summarize where we have gone and what we have learned. Recall that we began with a double puzzle about politics in Britain since the Second World War: the surprising success of the Liberals and the frequent divergence of the major parties. We posited two working hypotheses – the vacated centre and the occupied centre. The data strongly confirm the vacated-centre effect – controlling for the passage of time, the Liberal vote has been greater the farther the Conservative and Labour parties diverge to the Liberals’ right and left, respectively, according to CMP left–right scores based on party manifestos. The less intuitive occupied-centre effect is confirmed also, but only for the Liberals’ relation to Conservatives – the larger the Liberal vote in the preceding election, the more the Conservative party has tended to diverge to the right. The occupied-centre effect on Conservative positions depends less on Liberal electoral strength per se than on the number of constituencies the Liberals contest, which we take (in an inferential leap) to be an indicator of their ability to attract centrist activists, some of whom might otherwise have become involved in the Conservative party and helped moderate its policies. The asymmetry in the major parties’ responses to Liberal strength may have also resulted from the frequent appearance in the last thirty years of extremist minor parties on the right but not the left, which produced a centrifugal pull on the Conservatives but not on Labour.
Our data and analysis pertain to a sixty-year swath of political history in Britain. Do our findings apply outside that place and time? What can we say about the politics of other countries with first-past-the-post voting systems and about the future of politics in Britain?
Generalizing beyond Britain is difficult because only a few major FPP systems still exist, and none of them exhibits the British pattern of a significant third party in the political centre. In Canada, the Liberal party was never eclipsed by a competitor from the left, and therefore it has continued to be a major party – indeed, usually the dominant party. The nearest analogue in India, the Congress party, similarly remains a major party in the centre of a system that is even more fragmented along regional lines than Canada’s. The United States, the only true two-party system, has had no enduring third party, whether in the centre or elsewhere in political space.Footnote 64
The vacated-centre and occupied-centre mechanisms in combination are troubling, because they imply that activism on behalf of a centrist third party can be counter-productive in terms of policy outcomes. Observers elsewhere need only reflect on how different British politics would have been in subsequent decades if the Liberals had disbanded in the 1950s. As was often noted at that time, the near-death of the Liberal party coincided with the triumph of Liberal policies through their adoption by the major parties. The poignancy of the Liberal revival is that it was both a reaction and a contributor to governmental departures from Liberal ideals, especially during the years of Conservative ascendancy. Britain’s post-war political history, therefore, offers warnings to other FPP democracies. For Canadians and Indians, it suggests a danger of polarization if the vagaries of first-post-the-post should ever relegate Canada’s Liberal party or India’s Congress party to third place. For Americans contemplating a new centre party to challenge the Republican and Democratic duopoly, the lesson from Britain might be, ‘Don’t do it!’Footnote 65
Nevertheless, even if other FPP systems included a third party in the centre, the cautionary example of the British experience might not always apply to them. In our model, the occupied-centre mechanism is the main source of perverse and counter-productive effects. Our finding that it has worked asymmetrically in Britain, with confirmation of the effect for the Conservative party but not for Labour, suggests that the major parties’ response to an occupied centre is highly contingent. It depends, we have suggested, on members and activists exercising influence over the party’s policies. A party in which pragmatic leaders retain control over policy would be more likely to take a centre party’s success as a reason to move in its direction rather than away from it. In addition, if class or other loyalties and barriers inhibit a major party’s activists from migrating to a centre party, then the spiral of centre-party success and major-party polarization is less likely to occur.
Returning to Britain itself, does our interpretation of its experience during 1945–2005 generalize enough to tell anything about the future? The strength of the occupied-centre effect on Conservative positions suggests that David Cameron may encounter substantial resistance within his own party, and that his attempt to lead it back to the centre might not succeed. But if he (or a successor) does prevail, one must expect that a strong, credible Conservative move to the centre will shrink the Liberal Democratic vote and produce a migration of activists that will be conducive to continued Tory centrism. The next election and its aftermath will provide a test of that prediction, which echoes Paddy Ashdown’s fear:
Sooner or later … the Tory Party will return from their journey to nowhere to … reoccupy the only place from which they can win elections again – the centre-right. And then all those decent moderate Tories who voted Lib Dem as a refuge from the awfulness of their own party will go home again.Footnote 66
Ironically, the Liberal Democratic party’s best hope depends on the same circumstances that threaten it with an impending downward spiral. Liberal Democratic MPs will have power in parliament only if their votes are necessary for either Conservatives or Labour to achieve majorities. Starting from the current (2009) alignment, a hung parliament requires big Conservative gains. Unless the present Labour government performs miserably on a major valence issue, the necessary advance by the Tories depends on their credibly occupying the centre. Our analysis implies that such a move will shrink the Liberal Democratic vote. The question will be: can the Liberal Democrats nevertheless retain enough seats to hold the balance of power? The answer may depend on two contingencies. First, Liberal Democratic candidates must remain plausible contenders in the required number of constituencies. Secondly, in such electorates sufficient supporters of whichever major party is expected to finish third must be willing to vote tactically for the Liberal Democrat. If Conservative moderation enables Liberal Democrats to re-establish their former policy of equidistance between the major parties, then supporters of both major parties may prefer the possibility of a hung parliament and coalition with Liberal Democrats to an outright victory by their traditional rival.Footnote 67
This scenario and the strategy it entails offer only a long shot at success for Liberal Democrats. If, against the odds, it should come to pass that they are at last in a position to negotiate effectively for enactment of proportional representation, it could help their cause if leaders of the major parties realize that electoral reform is needed to improve the systemic functioning of politics in Britain. Because efforts on behalf of the centrist third party have been counter-productive within the FPP electoral system, perhaps the chief lesson of our analysis is to reinforce the recent conclusion of McDonald and Budge, Powell, and others that proportional representation is preferable to FPP not so much because it is fairer to minor parties, but rather because it is more likely to deliver the median-voter policy outcomes that majority rule requires.
Liberal Electoral Performance in Great Britain and Parties’ Left–Right Scores, 1945–2005