INTRODUCTION
In many systems of lamb production (e.g. in the UK and Australasia), lambing occurs well before the peak of pasture growth, in order for the lambs to have time to reach slaughter weight before pasture quality and quantity decline. As a result, the ewe in early lactation faces its period of greatest nutrient demand before the nutrient supply from pasture is at its peak, and supplements are often fed to make good the shortfall in nutrients. Supplement costs are a major discretionary expenditure in sheep production systems (Dove Reference Dove, Freer and Dove2002), so it is important that supplement use be optimized.
Supplementation of ewes can result in increased lamb output from the grazing system (e.g. Milne et al. Reference Milne, Maxwell and Souter1981; Dove et al. Reference Dove, Freer, Axelsen and Downes1984a ; Molle et al. Reference Molle, Ligios, Fois, Decandia, Casu, Bomboi, Lindberg, Gonda and Ledin1997). In addition, supplements providing extra rumen-undegradable protein have led to increases in ewe milk production or lamb live weight (LW) gain (e.g. Vipond Reference Vipond1979; Loerch et al. Reference Loerch, McClure and Parker1985; Penning et al. Reference Penning, Orr and Treacher1988; Robinson Reference Robinson, Slade and Lawrence1990; Mikolayunas et al. Reference Mikolayunas, Thomas, Albrecht, Combs, Berger and Eckerman2008). However, supplement responses can also be highly variable (Dove Reference Dove, Freer and Dove2002), because of variability in the substitution rate between supplement and herbage (see Molle et al. Reference Molle, Ligios, Fois, Decandia, Casu, Bomboi, Lindberg, Gonda and Ledin1997; Dove Reference Dove, Freer and Dove2002; Dove et al. Reference Dove, Freer and Foot2000), variability in the kinetics of digestion of the herbage/supplement mix and variability in the conversion of absorbed nutrients and ewe body reserves to milk. There are published reports of the effects of supplement intake on herbage intake by lactating ewes (e.g. Dove et al. Reference Dove, Freer, Egan and Doyle1984b ; Dove et al. Reference Dove, Freer and Foot2000; Molle et al. Reference Molle, Ligios, Fois, Decandia, Casu, Bomboi, Lindberg, Gonda and Ledin1997) and there are estimates of the milk intake of lambs under field conditions (Dove Reference Dove1988). However, there are few published data on the post-ruminal flows of digesta in lactating ewes (Dove & Milne Reference Dove and Milne1994; Dove et al. Reference Dove, Milne, Sibbald, Lamb and McCormack1988; Madibela et al. Reference Madibela, Gibbs, Sykes, Laporte-Uribe and Zhao2009), partly because such measurements are difficult to conduct in grazing livestock.
Using ewes in early lactation grazing either low- or high-herbage masses while receiving (low-herbage mass only) either ‘energy’ or ‘protein’ supplements, the current study aimed to obtain data on the following variables, which can be viewed as components of the ‘mechanistic chain’ linking the ewes’ nutrient status to the lamb output of the system:
-
(a) changes in ewe LW and body condition score,
-
(b) intakes of herbage and supplement by ewes,
-
(c) ruminal content and post-ruminal flows of digesta and its components,
-
(d) production of milk and its components, and
-
(e) lamb LW gain.
MATERIALS AND METHODS
Experimental design
The experiment was conducted under a UK Home Office Licence. Four treatments were imposed in a randomized-block design with four replicates, at the Macaulay Insititute's Hartwood Research Station, Strathclyde, Scotland. The 16 plots were grazed by 96 Greyface (Border Leicester ♂×Scottish Blackface ♀) ewes and their lambs. Twelve of the plots were 0·43 ha and were grazed by six ewes and their lambs (putative stocking rate of 14 ewes/ha). Ewes in the trial were balanced approximately for parity (46 ewes with single lambs and 50 with twins) and for age (51 mature ewes and 45 young ewes). In replicate 4, there were three extra ewes/plot; these ewes were fistulated at the rumen and abomasum and were used to estimate digesta flows. Plot sizes in this replicate were increased to 0·64 ha to accommodate the three extra ewes and maintain the overall stocking rate of 14 ewes/ha.
The mean lambing date was 2 May (day 122 of the year) and the mean day of allocation into the experiment was day 125. The supplementary-feeding treatments described below were imposed between days 130 and 172, corresponding to a mean of days 8–50 of lactation. Supplements then ceased and the experiment continued until day 218, corresponding to day 96 of lactation, at which time lambs were weaned.
Pastures and their management
The ewes grazed established pastures of perennial ryegrass (Lolium perenne L.). The pasture in all plots received nitrogen (N) as a compound fertilizer (N:P:K 22:11:11 by weight) as follows: day 148=55 kg N/ha; day 178=40 kg N/ha; day 199=40 kg N/ha. On seven occasions between days 138 and 221, herbage mass was estimated by cutting 9 quadrats/plot to ground level with electric clippers. These samples were oven-dried at 100°C then ashed overnight at 450°C to determine organic matter (OM) concentration.
In two of the four replicates, herbage growth rate was estimated in each plot on six occasions between days 138 and 172 by taking two tiller cores from within exclosure cages which prevented grazing. Growth rate was calculated as the multiple of the number of tillers/core, the number of new leaves/tiller during the measurement period and the mean dry weight of new leaves.
Treatments and supplements
Four treatments were imposed. In three of these, ewes grazed a low-herbage mass (initial aim 500–600 kg OM/ha) and in the fourth treatment, ewes grazed a high-herbage mass (initial aim 1000 kg OM/ha). Herbage masses were manipulated using non-experimental sheep to maintain the differences between the herbage masses of the treatments. Ewes in one of the low-herbage mass treatments (LO) received no supplement. Those in the second treatment (LE) received an energy supplement (600 g/d air-dry of molassed sugarbeet pulp pellets; OM 926, N 19·0 g/kg dry matter (DM)), while those in the third treatment (LP) received a protein supplement consisting of 600 g/d air-dry of a pelletted 1:1 mix of the above sugarbeet pulp and formaldehyde-treated soyabean meal (OM 923, N 49·8 g/kg DM). Formaldehyde treatment was carried out as described by Freer & Dove (Reference Freer and Dove1984) and after 7 days of curing, treated meal was combined 1:1 with hammer-milled sugarbeet pulp and re-pelletted. Ewes in the fourth treatment (high herbage mass; HO) were not supplemented. In all replicates, intact ewes were fed their supplements in troughs, but in replicate 4, the fistulated ewes received their supplements each day in individual pens, as part of the procedure for the measurement of digesta flows.
To estimate the rumen disappearance rates, samples of hammer-milled beet pulp, soyabean meal, formaldehyde-treated soyabean meal and the 1:1 mix of treated soyabean meal:beet pulp were incubated in nylon bags in the rumen of fistulated housed sheep for periods up to 24 h, using the procedures described by Dove & McCormack (Reference Dove and McCormack1986).
Animal measurements
As ewes were allocated to the study, the state of their incisor dentition was scored as described by Dove & Milne (Reference Dove and Milne1991), by placing ewes in one of four categories from score 1 (a full mouth of short, firm incisors) to score 4 (2 or more incisors missing and the remainder elongated and/or loose). Ewes and lambs were weighed at the start of the study and thereafter at intervals of c. 14 days. The body condition scores of the ewes (Meat and Livestock Commission 1981) were also measured at these times.
Estimates of herbage intake and milk production of ewes
Herbage intake was estimated over four 10-day periods in both the intact and the fistulated ewes in replicate 4, from estimates of faecal output and in vivo digestibility. Intact ewes were collected each day into individual pens in the field and dosed with 1 g chromium as Cr2O3, for 10 days. After dosing for 6 days, rectal faecal samples were obtained from these ewes over 4-day periods commencing on days 15, 30, 43 and 93 of lactation. Faecal outputs were estimated from the dilution of the dosed chromium. Faecal outputs of the fistulated ewes were estimated from the dilution, in faeces, of ruthenium which was continuously infused as part of the estimation of digesta flow (see below). In both groups of ewes, herbage digestibility in individual ewes was estimated from the herbage and individual faecal concentrations of the plant alkane pentatriacontane (C35 alkane) as described by Dove et al. (Reference Dove, Milne and Mayes1990).
On days 11, 25, 40, 53 and 60 of lactation, the intact ewes were separated from their lambs and hand-milked after the administration of oxytocin. They were then allowed to graze without their lambs and milked again after 4 h. The weight of milk collected was regarded as one-sixth of the daily production.
Measurement of digesta flow
In the fistulated ewes in replicate 4, digesta flow measurements were conducted over 1-week periods commencing on days 14, 28, 42 and 91 of lactation. Over these times, ewes received a continuous, intra-ruminal infusion of the particulate-phase marker Tris (1,10-phenanthroline)-ruthenium (II) chloride (Tan et al. Reference Tan, Weston and Hogan1971) and the liquid-phase marker CrEDTA (Binnerts et al. Reference Binnerts, Van't Klooster and Frens1968) from battery-powered pumps. Procedures for marker preparation and administration have been described elsewhere (Dove et al. Reference Dove, Milne, Sibbald, Lamb and McCormack1988). Commencing on day 5 of each infusion period, 3·7 MBq/d of the radioactive sulphur isotope 35S as sodium sulphate (Na2 35SO4) was infused with the above markers, in order to estimate microbial protein production from the incorporation of 35S into microbial protein. Full details of the sample collection procedures and the calculation of digesta flows are provided by Dove et al. (Reference Dove, Milne, Sibbald, Lamb and McCormack1988) and Dove & Milne (Reference Dove and Milne1994). The data collected were rumen ammonia concentration, rumen concentrations and pool sizes of acetate, propionate and butyrate and abomasal flows of OM, non-ammonia N (NAN) and microbial N (MN).
Chemical analyses
Sample storage and analytical procedures used to estimate digesta flows are described by Dove et al. (Reference Dove, Milne, Sibbald, Lamb and McCormack1988), while procedures used to analyse herbage and faecal samples for C35 alkane were essentially as described in Dove et al. (Reference Dove, Freer and Foot2000). Milk fat and protein (N×6·38) concentrations were determined using standard methods (AOAC 1970).
Statistical analyses
All statistical analyses were conducted using Genstat 12 (VSN International, Hemel Hempstead, UK). For measurements made in all replicates, data were initially examined by analysis of variance for a replicated randomized block with four treatments, with plot means as the experimental unit. In some analyses, the three degrees of freedom for ‘Treatment’ were subdivided into single degree of freedom comparisons of high v. low herbage mass, supplement v. no supplement (within the low-herbage mass) and energy v. protein supplement. Data for variables such as LW or body condition score were also analysed by repeated measures analysis of variance. The analyses of variance showed that there was no hierarchical error structure in the data, so these results were re-examined using regression analysis to allow an assessment of the effect of non-treatment terms such as dentition score.
Data for herbage intake, milk production and digesta flow were obtained only in replicate 4, due to the labour demands and technical difficulty of such measurements. This meant that the four treatments and four plots were confounded and differences between the four treatments could not be quantified. To deal with this, the four treatments were regarded as two replicates in which ewes were supplemented (LE+LP) and two replicates in which they were not (LO+HO). This permitted comparisons of unsupplemented and supplemented ‘treatments’ by analysis of variance and by regression. In addition, relationships between digesta flow and intake, between milk production and intake, between lamb growth and milk yield and between the components of digesta flow were also examined to provide insight into the treatment effects identified across the whole experiment.
RESULTS
Herbage mass and growth rate
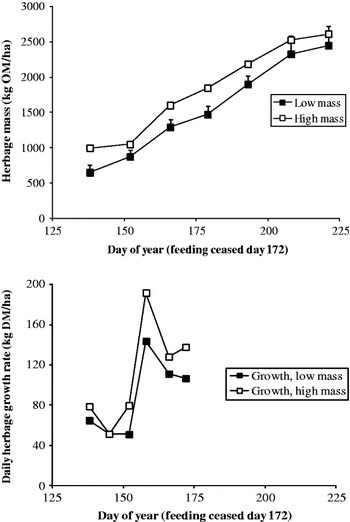
At the first harvest (day 138) the mean herbage mass of treatments LO, LE and LP of 649 kg OM/ha was significantly lower (P<0·01) than that of the HO treatment (995 kg OM/ha). Thereafter, estimated herbage mass increased throughout the experiment; the herbage mass on treatment HO also remained higher throughout, significantly so at harvests 3, 4 and 5 (P<0·05, P<0·01 and P<0·05, respectively; Fig. 1). In a repeated measures analysis of variance of these data, there were thus significant effects of both treatment (P<0·05) and time (P<0·01). Herbage growth rate was higher in the high-mass treatment (Fig. 1) and repeated measures analysis of variance showed significant effects of both treatment (P<0·05) and time (P<0·001).
Changes in herbage mass (kg OM/ha) over the course of the experiment (days 130–218) and changes in daily herbage growth rate (kg DM/ha) during the supplement feeding period (days 130–172).

Nutritive value of herbage and supplements
In vivo herbage OM digestibilities based on C35 alkane did not differ significantly across time or treatment. The mean OMD across treatment was 0·818±0·0038. The N content of the herbage at day 14 (29·1 g N/kg OM) was significantly lower (P<0·01) than those for days 28, 42 and 91, which did not differ significantly from each other (mean 42·1 g N/kg OM).
The in vitro digestibility of both the energy and the protein supplements was 0·90. When incubated in nylon bags in the rumen of housed sheep, 0·83 of the DM of beet pulp and 0·82% of the DM of untreated soyabean meal disappeared by 24 h. Formaldehyde treatment of the soyabean meal effected a marked reduction in DM disappearance rate, down to 0·44 after 24 h rumen incubation. The DM disappearance of the 1:1 beet pulp:treated soyabean meal protein supplement was midway between those for its components.
LW and body condition score changes in ewes
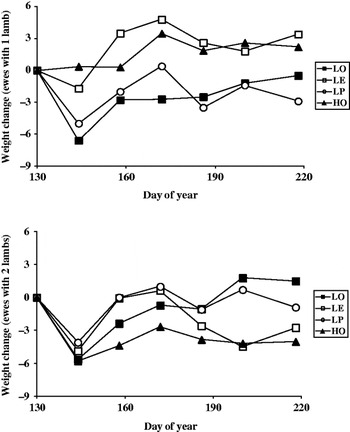
Changes in ewe LW from their starting values are shown in Fig. 2. Analyses of variance showed that mature ewes were significantly heavier at allocation into the experiment, as expected, and remained so throughout the experiment. At the start of supplementary feeding (day 130), ewes with twin lambs were significantly lighter and also remained so throughout the experiment. Over the period of supplementation, ewes with one lamb gained LW slightly (35 g/d), whereas ewes with twins lost weight (−11 g/d; P<0·05). By the end of supplementary feeding (day 172), supplemented ewes were significantly heavier than unsupplemented ewes and during this period, ewes in treatment LO lost significantly more weight (−40 g/d) than those in the other treatments (mean 30 g/d; P<0·05). In contrast, after supplementary feeding ceased, there seemed a degree of compensation in that ewes on treatments LP, LE and HO lost weight (mean −42 g/d; P<0·01), while LO ewes gained weight (47 g/d; Fig. 2).
Change in LW in grazing ewes during lactation (upper panel, ewes with single lambs; lower panel, ewes with twins). LO=low-pasture mass; LE=low-pasture mass plus daily supplement of 600 g pelletted, molassed sugarbeet pulp; LP=low-pasture mass plus daily supplement of 600 g of pelletted mixture of molassed sugarbeet pulp and formaldehyde-treated soyabean meal (1:1); HO=high pasture mass.

In ewes with one lamb there were significant effects of treatment on LW change and within that, a significant effect of supplementation v. no supplementation (P<0·05 to P<0·01). In the supplementary-feeding period, ewes in treatment LO with one lamb lost LW (−61 g/d), whereas ewes in the other treatments gained weight (mean 64 g/d; P<0·05). After the feeding period, these trends reversed; ewes with one lamb in treatment LO gained significantly more LW (51 g/d; P<0·05) than like ewes in the other treatments (mean −36 g/d). Perhaps surprisingly, trends in LW change were less marked in ewes with twins (Fig. 2). Supplemented ewes were significantly heavier by the end of the feeding period (P<0·05). In the period after feeding ceased, supplemented ewes with twins lost weight (−57 g/d), whereas their unsupplemented cohorts gained very slightly (9 g/d; P<0·05) and as described above, ewes in treatment LO gained LW (48 g/d), whereas those on the other treatments lost weight (−48 g/d; P<0·05).
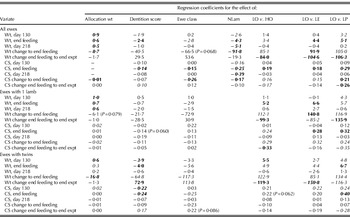
Data for ewe LW and body condition scores were re-analysed by regression in an attempt to better quantify the treatment and non-treatment terms. In particular, it has been shown that ewe dentition score can have a marked impact on such variables (Dove & Milne Reference Dove and Milne1991) and dentition score was thus included in the regression model. Regression coefficients for model terms are shown in Table 1 for all ewes, ewes with one lamb or ewes with twins.
Regression coefficients for the effect of allocation wt (kg), dentition score (1–5), ewe class (young, Y v. mature, M), number of lambs suckled (NLam) and the imposed treatments on the LWs (kg) and LW changes (g/d) and the condition scores and changes in scores of all ewes, ewes with 1 lamb and ewes with twins, during and after the period of feeding supplements

LO, HO=unsupplemented ewes grazing low- and high-herbage mass, respectively; LE, LP=ewes grazing low-herbage mass and supplemented with energy or protein supplements (see text for supplement description).
Significance of regression coefficients shown thus: P<0·05 (italics); P<0·01 (bold); P<0·001 (bold italics).
When all ewes were considered, ewes that were 1·0 kg heavier at allocation were 0·9, 0·6 and 0·5 kg heavier at days 130, 172 and 218 (the end of the study), respectively. They also lost significantly more LW (P<0·001) and body condition (P<0·01) during the supplementary-feeding period. Dentition score had a marked effect, with penalties of over 2 kg in ewe LW (P<0·01) and 0·14 in body condition score (P<0·001) by the end of feeding, for each unit increase in dentition score. During the feeding period, both HO ewes and supplemented ewes (LE, LP) gained significantly more LW and body condition score than LO ewes (Table 1), but lost significantly more LW and condition than LO ewes after feeding ceased. Differences in LW change or body condition score change between LE and LP ewes were not significant.
When the responses in ewes with single or twin lambs are compared (Table 1) it is clear that the effect of allocation weight is similar for the two groups, but the effect of dentition score was only significant in ewes with twins. For example, by the end of the feeding period in ewes with twins, there were penalties of 4·0 kg LW (P<0·01) and 0·24 in body condition score (P<0·001), for every unit increase in dentition score. In general, effects of treatment were similar in both groups. In ewes with one lamb, and compared with LO ewes, both HO ewes and supplemented ewes (LE, LP) gained more LW and condition during feeding, but also lost more in the period between the end of feeding and the end of the study (Table 1). Treatment effects on LW changes of ewes with twin lambs were similar to those with single lambs, but the effects of treatment on changes in body condition score were only significant for ewes on treatment LP.
LW gains of lambs
Analyses of variance of the effects of ewe maturity class, lamb birth type and treatment on lamb LW gain showed that twin lambs, as might be expected, had lower birth weights (P<0·01) and grew more slowly throughout the experiment (P<0·001) than single lambs. In addition, lambs from young ewes had significantly lower birth weights (P<0·01) and remained significantly lighter at the end of the feeding period (day 172; P<0·001) and the end of the experiment (day 218; P<0·01). Lambs from ewes which were offered the supplements grew significantly faster during the supplement-feeding period (P<0·05) and were significantly heavier by the end of that period (P<0·05). Analyses of variance did not indicate any other significant treatment effects.
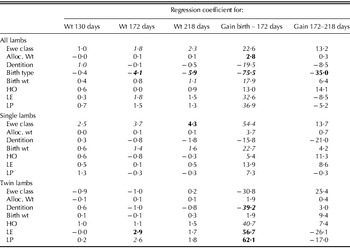
Treatment effects on lamb LW gains were more evident when data were re-examined by regression analysis with ewe allocation weight, ewe dentition score and lamb birth weight (within birth type) included in the regression model (Table 2). When all lambs were considered, lambs from older ewes were heavier at both day 172 (1·8 kg; P<0·01) and day 218 (2·3 kg; P<0·05). From birth to day 172, there was a significant penalty in lamb LW gain of −19·5 g/d (P<0·05) for every unit increase in ewe dentition score. Twin lambs grew more slowly (P<0·001) and within birth type, lambs with heavier birth weights had higher LW gains (P<0·05). Over the period from birth to the end of feeding and relative to lambs in treatment LO, lambs from ewes receiving the energy supplement (LE) grew c. 33 g/d faster (P<0·05) and those from ewes receiving the protein supplement (LP) grew c. 37 g/d faster (P<0·05). Lambs in treatment HO had a slightly higher LW gain than those in treatment LO but this effect was not significant (Table 2). The differences in LW gain of LE and LP lambs from birth to day 172 were not significant; there were no effects of treatment on LW gains of lambs after the end of the supplementary-feeding period.
Regression coefficients for the effect of ewe class (mature v. young), ewe allocation weight (kg), ewe dentition score (1–5), birth type (single v. twin), birth weight (kg) and treatment on LWs (kg) and LW gains (g/d) of lambs during supplementation of ewes (130–172 days) and the end of the experiment (172–218 days). All values expressed relative to unsupplemented mature ewes with a single lamb, on the ‘low pasture’ (LO) treatment

HO=lambs from unsupplemented ewes grazing high herbage mass; LE=lambs from ewes grazing low herbage mass and given energy supplement; LP=lambs from ewes grazing low herbage mass and given protein supplement.
Significance of regression coefficients shown thus: P<0·05 (italics); P<0·01 (bold); P<0·001 (bold italics).
Separate regression analyses in single and twin lambs showed that the effects of dentition score of ewes and of the imposed treatments were significant only in twin lambs. For every unit increase in the dentition score of their dams, twin lambs grew c. 39 g/d more slowly (Table 2, P<0·001). Relative to twin lambs on treatment LO, twin lambs grew significantly faster over the feeding period in treatments HO (40·7 g/d; P<0·05), LE (56·7 g/d; P<0·01) and LP (62·1 g/d; P<0·01).
Intakes and milk yields of ewes
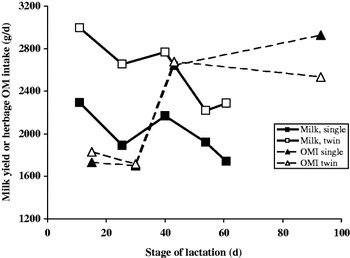
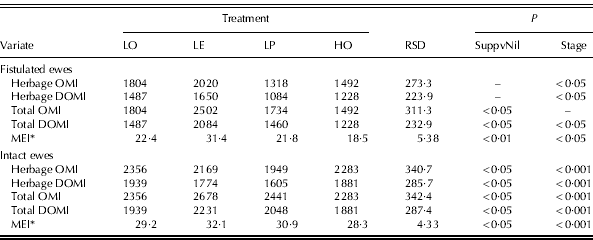
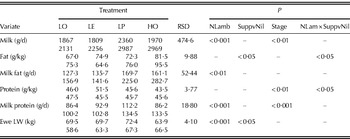
Greater lamb LW gains over the first 50 days of lactation (birth-day 172) imply differences in ewe milk production, which in turn suggest differences in OM intakes of ewes. Intakes of herbage and total OM intake (OMI, g/d) were estimated in both intact and fistulated ewes in replicate 4, and the yield of milk and its components was also estimated in the intact ewes in replicate 4 (Fig. 3; Table 3). In the intact ewes, herbage OMI was c. 1800 g/d at days 15–30 of lactation, after which there was a marked rise to c. 2650 g/d (Fig. 3), resulting in a significant effect of stage of lactation on herbage OMI and digestible OMI (DOMI; Table 3, both P<0·001). Similar responses were observed in the herbage OMI and DOMI of fistulated ewes in relation to stage of lactation (Table 3; P<0·05); herbage OMI by fistulates was c. 1440 g/d at days 14–28 of lactation (i.e. c. 0·80 that of intact ewes) after which it rose to c. 1880 g/d (i.e. c. 0·70 that of intact ewes). The differences in intake partly relate to differences in LW between fistulates (c. 55 kg) and intact ewes (66 kg; Table 4). Herbage OMI per kg LW was similar in fistulated (26·2 kg OM/kg LW) and intact ewes (27·3 kg OM/kg LW) over the first 30 days of lactation but thereafter, OMI/kg LW was still c. 20% lower in fistulated ewes. As might be expected, supplementation increased total OMI and total DOMI in both fistulated (Table 3; P<0·05) and intact ewes (Table 3; P<0·05). Intakes by ewes with twin lambs were not significantly different from those rearing single lambs (Fig. 3). Ewes receiving supplements (LE, LP) had significantly greater total OMI, total DOMI and calculated metabolizable energy intake (MEI) than unsupplemented ewes (LO, HO; P<0·05). Arithmetically, the difference in calculated MEI for LE ewes cf. LP ewes was small (<4%).
Changes in mean milk yield (g/d) and herbage OM intake (OMI, g/d) in ewes with single or twin lambs, in relation to stage of lactation.

Herbage and total intakes (all g/d) of OM intake (OMI) and digestible OMI (DOMI) and MEI (MJ/d) by fistulated and intact ewes grazing perennial ryegrass pasture, while receiving no supplement or 600 g/d of an energy or a protein supplement (see text for supplement descriptions)

* Calculated using equation (1·9A) of CSIRO (2007) plus equation (31) of Freer et al. (Reference Freer and Dove1997).
RSD, residual standard deviation.
SuppvNil=supplemented (LE+LP) v. unsupplemented (LO+HO) ewes; Stage=effect of stage of lactation (no significant interactions detected).
Yield of milk (g/d) and the content (g/kg) or yield (g/d) of milk fat and protein, and LW (kg) in intact ewes grazing perennial ryegrass pasture while receiving no supplement or 600 g/d of an energy or a protein supplement (see text for supplement descriptions). For each variate, the upper row is for ewes with single lambs and the lower row for ewes with twins

RSD=residual standard deviation; NLam=ewes with twins v ewes with single lambs; SuppvNil=supplemented (LE+LP) v. unsupplemented (LO+HO) ewes; Stage=effect of stage of lactation; NLam×SuppvNil=interaction between these terms.
Ewes rearing twin lambs produced c. 400–1000 g/d more milk than those rearing singles (Fig. 3, Table 4; P<0·001). They also had higher daily yields of milk fat and milk protein (Table 4; both P<0·001). The effect of stage of lactation was significant for milk yield (P<0·01), milk protein content (P<0·01) and milk protein yield (P<0·05). The only effect of supplementation detected by analysis of variance was on milk fat content (P<0·01; Table 4), for which there was also a significant interaction between supplementation and number of lambs being reared (P<0·01).
Ewes rearing twin lambs were, on average, 5 kg lighter over lactation than those rearing single lambs (Table 4; P<0·001) and had significantly lower body condition scores (0·31; P<0·001). Supplemented ewes had an advantage in LW of 3·6 kg, cf. unsupplemented ewes (P<0·05) but there was no significant effect of supplementation on body condition score in this group.
Once again, these responses were clarified further by regression analyses that included terms such as herbage mass, herbage growth rate and their interaction, plus ewe LW, body condition score and dentition score. In this small subgroup of ewes, the last three terms did not contribute significantly to the variance in milk parameters. The regression analyses indicated that higher herbage growth rate led to significant increases in daily milk yield (P<0·01), fat content (P<0·01), daily fat yield (P<0·001) and daily protein yield (P<0·01) (data not shown). Increased herbage mass led to increased yields of milk (P<0·01), fat (P<0·001) and protein (P<0·05), but there were also significant interactions between herbage mass and herbage growth rate for the yields of milk (P<0·05), fat (P<0·001) and protein (P<0·05). Taken together, these effects indicated that, starting from the mean herbage mass of 1250 kg OM/ha and the mean herbage growth rate of 84 kg DM/d during milk production measurements, a combined increase of 100 kg DM/ha in herbage mass and 10 kg DM/ha per day in herbage growth rate would result in significant increases of 215, 34 and 8 g/d in the yields of milk, milk fat and milk protein, respectively.
Similarly, regression analyses indicated that ewes rearing twin lambs had higher milk yield (P<0·001) and milk with higher fat content (P<0·01) and thus higher yields of milk fat (115·4 g/d; P<0·001). Milk protein yield was also significantly higher (44·8 g/d; P<0·001). Supplementation significantly increased milk yield (687 g/d; P<0·05), fat content (13·3 g/kg; P<0·01) and the daily yields of fat (78·9 g/d; P<0·01) and protein (32·4 g/d; P<0·01). However, for milk fat content and yield, there were also significant interactions between lamb rearing type and supplementation, such that compared with unsupplemented ewes rearing one lamb, supplemented ewes rearing twins produced milk of significantly higher fat content (6·2 g/kg; P<0·01) and had a significantly higher milk fat yield (110·5 g/d; P<0·01).
Responses in rumen metabolites and digesta flows in fistulated ewes
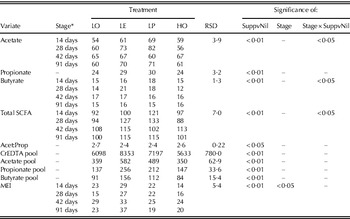
The concentrations of rumen metabolites and the daily flows of digesta components were estimated in the fistulated ewes at days 14, 28, 42 and 91 of lactation. The rumen concentrations of acetate, propionate and butyrate are shown in Table 5, together with their rumen pool sizes estimated from concentrations and the rumen pool size of the liquid-phase marker CrEDTA.
Rumen short-chain fatty acid concentrations (SCFA, mmole/l), CrEDTA rumen pool size (ml) and SCFA pool sizes (mmole) in fistulated ewes grazing perennial ryegrass pasture while receiving no supplement or 600 g/d of an energy or a protein supplement (see text for supplement descriptions)

* Values for different stages of lactation shown only where interaction term significant.
RSD=residual standard deviation. SuppvNil=supplemented (LE+LP) v. unsupplemented ewes (LO+HO); Stage=effect of stage of lactation; Stage×SuppvNil=interaction of these terms. Pool sizes not determined at day 91.
Stage of lactation had no effect on these variables but consumption of supplements significantly increased the rumen concentrations of individual short-chain fatty acids (all P<0·01) and their total (P<0·01; Table 5). Supplementation also markedly increased CrEDTA pool size in the rumen and thus the pool sizes of acetate, propionate and butyrate (all P<0·01). As in the intact ewes in replicate 4, calculated ME intakes in the fistulated ewes were significantly increased by supplementation (P<0·05 to P<0·01; Tables 3 and 5) and increased over the course of lactation in line with increases in OM intake (P<0·05; Table 5).
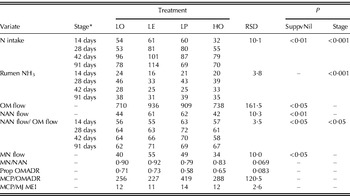
The N intake of fistulated ewes (Table 6) significantly increased with advancing lactation (P<0·01), presumably also reflecting the higher herbage OM intakes observed in both fistulated and intact ewes later in lactation (Fig. 3; Table 3) and the higher N content of herbage later in lactation. Overall, the N intakes of supplemented ewes were significantly higher (81·6 g/d; P<0·05) than unsupplemented ewes (64·6 g/d). There was no effect of supplementation on rumen ammonia concentrations. Supplementation significantly increased the daily flows (g/d) of OM, NAN and MN from the abomasum (P<0·05 to P<0·01), and the daily flow of NAN/kg OM flow (P<0·05). There were no significant differences in MN flow per unit NAN flow, in the proportion of apparently digested OM which disappeared across the rumen (OMADR) or in the measures of efficiency of microbial protein synthesis.
Nitrogen (N) intakes (g/d), rumen ammonia concentrations (mmole/l), duodenal flows of OM, NAN and MN (all g/d) and efficiencies of microbial protein (MCP) synthesis in fistulated ewes grazing perennial ryegrass pasture while receiving no supplement or 600 g/d of an energy or a protein supplement (see text for supplement descriptions)

* Values for different stages of lactation shown only where main effect of ‘Stage’ is significant.
RSD=residual standard deviation. SuppvNil=supplemented (LE+LP) v. unsupplemented (LO+HO) ewes; Stage=effect of stage of lactation (interaction never significant). Prop OMADR=proportion of DOM apparently digested in the rumen.
These responses were further clarified by examining the relationships between the various components of daily digesta flows. In unsupplemented fistulated ewes, daily flows of OM from the abomasum were significantly related to total OMI (P<0·001) and total DOMI (P<0·001) by the following relationships:

The equivalent relationships for supplemented ewes, while significant (both P<0·01) only explained c. 0·30–0·35 of the variance in flow.

Similarly, in unsupplemented ewes, the relationship between OM intake and abomasal NAN flow explained 0·67 of the variance in NAN flow (P<0·001), but the equivalent relationship for supplemented ewes, while significant (P<0·001), explained only 0·34 of the variance (data not shown).
The relationships between N intake and NAN flow explained slightly more of the variance in flow than those related to OM intake. In unsupplemented and in supplemented ewes, the relationships between N intake and abomasal NAN flow were:

The regression relationships for NAN flow v. OM intake and for NAN flow v. N intake differed significantly (P<0·05) between unsupplemented and supplemented ewes.
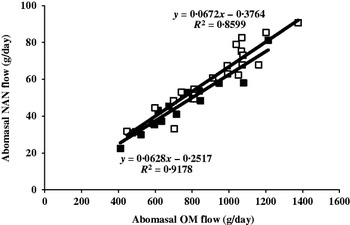
The daily flow of NAN from the abomasum was closely and linearly related to abomasal flow of OM (Fig. 4) in both unsupplemented (P<0·001; R 2=0·918) and supplemented ewes (P<0·001; R 2=0·860). However, these two relationships did not differ significantly and the data were equally well described by the single regression:

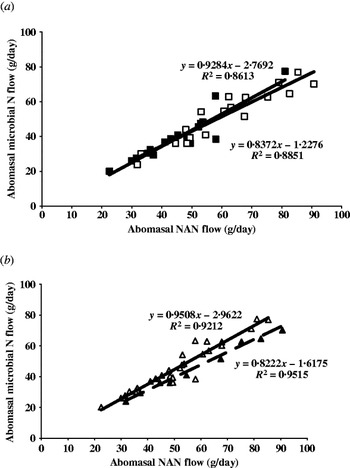
Similarly, abomasal MN flow was closely and linearly related to abomasal NAN flow (Fig. 5 a) both in unsupplemented ewes (P<0·001, R 2=0·861) and supplemented ewes (P<0·001, R 2=0·885). These two relationships were not significantly different and the data for supplemented and unsupplemented ewes were equally well described by the single regression:

The relationships between MN and NAN flows in Fig. 5 a thus suggest little difference between unsupplemented and supplemented ewes in the proportion of MN in the daily NAN flow. However, this may not be the appropriate comparison. The relationships were therefore re-evaluated by comparing ewes receiving the protein supplement v. all other ewes (Fig. 5 b). In ewes on treatment LP, the relationship between MN and NAN flows (Fig. 5 b) differed (P<0·01) from that fitted to data for all other ewes, due principally to the significantly lower slope of the former relationship. These data suggest that in ewes receiving the protein supplement, 0·82 of NAN flow consisted of MN, significantly lower than 0·95 found for all other ewes.
Relationships between the abomasal flows of NAN and OM in unsupplemented (solid symbols; equation in regular text) or supplemented ewes (open symbols; equation in italic text).

Relationships between abomasal flows of MN and NAN in: (a) unsupplemented (solid squares; equation in regular text) or supplemented ewes (open squares; equation in italic text) or (b) ewes given the protein supplement (solid triangles, equation in regular text) or all other ewes (open triangles, equation in italics).

DISCUSSION
The initial herbage masses, being 649 and 995 kg OM/ha, respectively, were reasonably close to the intended amounts. Although herbage height was not measured in the current study, from height (mm) and mass (t OM/ha) measurements taken in an adjacent perennial ryegrass pasture, the following relationship was established:

Based on this relationship, initial herbage heights can be calculated to be 28 and 38 mm on the low- and high-herbage mass treatments, respectively. The data of Molle et al. (Reference Molle, Ligios, Fois, Decandia, Casu, Bomboi, Lindberg, Gonda and Ledin1997) and Morris & Kenyon (Reference Morris and Kenyon2004) suggest that a height of 28 mm would certainly constrain the herbage intake of ewes in early lactation. Molle et al. (Reference Molle, Ligios, Fois, Decandia, Casu, Bomboi, Lindberg, Gonda and Ledin1997) recommended pasture heights of not less than 40 mm for ewes in early lactation (up to day 50) and 70 mm in late lactation (to day 100). In the present study, it can be calculated that for ewes on treatment HO, these heights were attained by days 30 and 64 of lactation, respectively. In contrast, these heights in the low-herbage mass treatments were not attained until days 37 and 78 of lactation, respectively, i.e. 1–2 weeks later than in treatment HO.
LW and condition score responses of ewes
The current results indicate that the higher herbage mass and supplementary feeding during lactation resulted in significant positive effects on both LW change and changes in body condition scores (Table 1; Fig. 2), though these effects were more obvious in regression analyses in which the effects of non-treatment terms were also evaluated. The results of these analyses also confirmed earlier reports of the importance of dentition in relation to the performance of grazing animals (e.g. Sykes et al. Reference Sykes, Field and Gunn1974; Dove & Milne Reference Dove and Milne1991), especially during lactation.
The positive response to high-herbage mass (HO) cf. low-herbage mass (LO) before day 50 of lactation confirms the results of previous reports (e.g. Molle et al. Reference Molle, Ligios, Fois, Decandia, Casu, Bomboi, Lindberg, Gonda and Ledin1997; Morris & Kenyon Reference Morris and Kenyon2004). The inclusion in the regression model shown in Table 1 of a term for mean herbage mass up to the end of the supplementary feeding period removed the significant difference in LW change between treatments LO and HO, suggesting that this difference had indeed been due to the treatment difference in herbage mass. In contrast, inclusion of mean herbage mass as a regression term in the post-feeding period (days 172–218) had no effect on the significance of treatment differences in LW change or body condition score change of ewes, probably because herbage mass/height on all treatments was no longer limiting herbage intake.
The higher DOMI in both the supplemented treatments also resulted in positive responses in LW change and in body condition score, as in many previous reports (e.g. Dove et al. Reference Dove, Freer, Axelsen and Downes1984a ; Frey et al. Reference Frey, Thomas, Ansotegui, Burfening and Kott1991; Mikolayunas et al. Reference Mikolayunas, Thomas, Albrecht, Combs, Berger and Eckerman2008). However, when considered across all four replicates, the current data provide no evidence of a difference in response between the two supplements. Considered across ewe maturity class, the responses to supplements were more marked in younger (2-year-old) than in older (3–6-year-old) ewes but in relation to the number of lambs being reared, responses of LW change to supplementation were similar in ewes with single lambs and ewes with twins. Nevertheless, ewes rearing twins consistently lost more LW and body condition throughout the experiment.
It is of interest that the observed positive treatment responses to supplementation (LE, LP) or higher herbage mass (HO) in the first 50 days of lactation were reversed in the 36 days between the end of supplementary feeding and the end of the experiment, during which time ewes on treatment LO gained LW and body condition. Although this might call into question the value of supplementation during lactation, such an assessment must also consider responses in the lambs to the supplementation of their dams.
Lamb LW gains
Supplementation of ewes in early lactation has resulted in variable responses to rumen-undegradable protein and variable LW responses in their lambs. In an indoor study, Vipond (Reference Vipond1979) found that providing lactating ewes with a fishmeal supplement increased lamb LW gain, while Loerch et al. (Reference Loerch, McClure and Parker1985) reported increased milk production after ewes were fed a blood meal or a dried meat and bone meal supplement. Similarly, Penning et al. (Reference Penning, Orr and Treacher1988) reported increased daily milk protein and total solids yield in grazing ewes given fishmeal supplement during the first 7 weeks of lactation.
Frey et al. (Reference Frey, Thomas, Ansotegui, Burfening and Kott1991) reported that supplementation of lactating ewes with 80 g/d of protein (of which 40 g/d was rumen-undegraded protein) resulted in increased yield of milk protein and fat, but only an 8% and non-significant increase in lamb LW gain. Hoon et al. (Reference Hoon, Herselman, van Heerden and Pretorius2000) found that supplementation with extra rumen-undegradable protein from 4 weeks before lambing to 8 weeks after lambing increased lamb LW at 42 days by 14% and the weight of lamb weaned/ewe by 17%. Dove et al. (Reference Dove, Freer, Axelsen and Downes1984a ) supplemented lactating ewes for 6 weeks after lambing with 0·5 kg/d of either an ‘energy supplement’ (oat grain) or a ‘protein supplement’ (sunflower meal). Relative to the daily gains of lambs from unsupplemented ewes, oat grain supplementation led to 17 and 30% increases in the daily gain of single and twin lambs, respectively. The equivalent responses with sunflower meal were 24 and 33%, respectively. In the current study, the difference in response between the supplements was not significant.
In the current study, there were marked responses in lamb LW gain due to supplementation but not to the type of supplement, although these only became evident in regression analyses including non-treatment terms such as ewe allocation weight and dentition score (Table 2). In the supplementary-feeding period, during which lambs would have been entirely or substantially dependent on milk intake, the higher herbage mass treatment (HO) or the supplements (LE, LP) significantly increased LW gain in twin lambs by 40–60 g/d (Table 2). Smaller but non-significant responses were found in single lambs. In contrast with some studies (Vipond Reference Vipond1979; Loerch et al. Reference Loerch, McClure and Parker1985; Penning et al. Reference Penning, Orr and Treacher1988; Frey et al. Reference Frey, Thomas, Ansotegui, Burfening and Kott1991), the LW gain responses of lambs in the current study were similar whether their dams were supplemented with energy (LE) cf. rumen-undegradable protein (LP).
Twin lambs grew more slowly, as is frequently observed (e.g. Dove et al. Reference Dove, Freer, Axelsen and Downes1984a ; Dove Reference Dove1988) and within single lambs, lambs with lighter birth weights also grew more slowly. Ewe dentition score had a marked effect on the LW gain of twin lambs (reduction of 39 g/d per unit increase in dentition score). The reduction in single lambs was smaller (16 g/d per unit increase in dentition score) and not statistically significant.
These patterns in the responses in ewe and lamb LW to the imposed treatments presumably relate to the effect of the treatments on the intake of herbage and supplement (and the substitution between them), the resultant provision of nutrients in and beyond the rumen, and the effect of this and the mobilization of body reserves on milk production. These were measured on a subset of the ewes in order to gain insight into the supplement responses of ewes and lambs.
Herbage intake and milk production
The main factor influencing herbage OMI and DOMI in the current study was stage of lactation. Intakes of herbage OM and DOM increased rapidly between weeks 4 and 6 of lactation (Fig. 3), consistent with other studies in which herbage supply has been restricted (Treacher & Caja Reference Treacher, Caja, Freer and Dove2002). Although herbage intakes are usually higher in ewes with multiple lambs (Treacher & Caja Reference Treacher, Caja, Freer and Dove2002), in the current study there were no significant differences in intakes between single-suckling and twin-suckling ewes, despite the higher milk production of the latter group. Morris & Kenyon (Reference Morris and Kenyon2004) also reported no effect of litter size on herbage intake. The higher milk production (Table 4) yet similar herbage OMI of twin-suckling ewes in early lactation is consistent with their greater loss of LW and body condition score over this period (Table 1).
In the current analyses of variance in the intact ewes, the effect of supplementation was to effect a significant reduction in the OMI and DOMI from herbage (P<0·05). Data for the fistulated ewes (Table 3) were less consistent. To explore this further, substitution rates were calculated from the intake data in Table 3 for treatments LO, LE and LP and then analyses of variance used to examine the effects of the type of ewe (fistulated v. intact), stage of lactation and supplementation. These analyses indicated that over the course of lactation, substitution rates between supplement and herbage were 0·60 for intact ewes and 0·37 for fistulated ewes, though this difference was not statistically significant. Mean substitution for intact ewes on treatment LP over the course of lactation was 0·83, whereas on treatment LE, mean substitution rate was lower (0·37), though this difference was not significant. Overall, there was a consistent pattern with stage of lactation (P<0·05) such that substitution fell from 0·69 at day 15 to −0·49 by day 30 of lactation, after which it rose again (day 43, 0·78; day 93, 0·96). Due to differences in herbage mass/height and supplement composition, comparisons of these mean substitution rates with other reported values require caution. However, the current estimated substitution rates are consistent with the rates reported by Dove et al. (Reference Dove, Freer, Egan and Doyle1984b ), Molle et al. (Reference Molle, Ligios, Fois, Decandia, Casu, Bomboi, Lindberg, Gonda and Ledin1997), Dove et al. (Reference Dove, Freer and Foot2000) and Madibela et al. (Reference Madibela, Gibbs, Sykes, Laporte-Uribe and Zhao2009). For example, the effect of stage of lactation is similar to that reported by Dove et al. (Reference Dove, Freer and Foot2000), in which the substitution rate in ewes grazing at 17/ha fell from 0·55 at day 9 of lactation down to 0·15 at day 23.
Despite the different rates of substitution found in the current study, the total OMI and DOMI of supplemented ewes and thus their calculated ME intakes were significantly higher than in unsupplemented ewes and significantly higher as lactation progressed (Tables 3 and 5).
In the current study, there was no evidence of any peak in daily milk yield, which declined throughout the period of milk yield measurement (P<0·01; Fig. 3). A continuing post-lambing decline in milk production is evident in many other published studies (e.g. Dove Reference Dove1988; Frey et al. Reference Frey, Thomas, Ansotegui, Burfening and Kott1991; Mikolayunas et al. Reference Mikolayunas, Thomas, Albrecht, Combs, Berger and Eckerman2008). The rate of decline of milk production with time was significantly faster in twin-suckling ewes than in ewes with one lamb (mean declines of 16·1 v. 7·3 g/d, respectively; P<0·01). Nevertheless, twin-suckling ewes still produced 29% more milk, 34% more milk fat and 25% more milk protein per day. This is consistent with many published comparisons of ewes with single v. twin lambs (see Treacher & Caja Reference Treacher, Caja, Freer and Dove2002).
Statistically, there was little effect of supplementation on milk yield or composition in the current study (Table 4) because in this comparison, the two treatments with the arithmetically greatest yields of milk and its components included an unsupplemented (HO) and a supplemented (LP) treatment. These data can be reanalysed by adopting the null hypothesis that treatments HO and LP constitute two replicates of treatments likely to result in increased crude protein intake, cf. treatments LO and LE. Based on this comparison, and considered across lamb rearing type, there were significant effects of (HO+LP) cf. (LO+LE) on milk yield (2572 v. 2016 g/d; P<0·001), milk fat content (81·3 v. 70·5 g/kg; P<0·001) and milk fat yield (209·6 v. 140·4 g/d; P<0·001). Milk protein content was slightly lower in (HO+LP) cf. (LO+LE) (45·1 v. 47·6 g/kg; P<0·05) though daily protein yield was significantly higher (116·6 v. 95·6 g/d; P<0·001).
The relationships in the current study between lamb LW gain (to day 36 of lactation) and mean ewe milk yield (to day 40 of lactation) or the yield of milk components are shown in Table 7. Although these relationships are based on milk production by the ewe, comparison with similar relationships based on milk intake by lambs suggests that the current milk production estimates closely represent milk intakes. For example, the relationship between lamb LW gain and milk production in the current study is almost identical to that which can be calculated from Dove (Reference Dove1988) for isotope-based estimates of lamb milk intake over the first 42 days of lactation, i.e.

At a milk intake of 2000 g/d, the above equation implies an LW gain of 323 g/d, similar to the gain of 336 g/d which can be calculated from the first relationship in Table 7. Similarly, at this level of milk intake the feed conversion efficiencies that can be calculated from Dove (Reference Dove1988) and the relationship in the current study are 1·08 and 1·07 g milk DM/g LW gain, respectively, very close to previously published values of 1·0–1·1 g milk DM/g LW gain in pre-ruminant lambs (e.g. Dove & Freer Reference Dove and Freer1979; Dove Reference Dove1988).
Regression parameters relating lamb LW gain (g/d; birth – day 158) to mean yields of ewe milk and its components (g/d; to day 162). For the purposes of regressions, the mean gains of sets of twins were related to 0·5×daily yield of milk or its components

Responses in rumen metabolites and digesta flows in fistulated ewes
Measurements of rumen metabolites and digesta flows were made in an attempt to gain insight into the observed responses of ewe milk production and ewe and lamb LW change to differences in herbage mass or to the different supplements. In particular, digesta flow measurements were conducted to quantify the effect of supplements on post-ruminal flows of OM, NAN and MN.
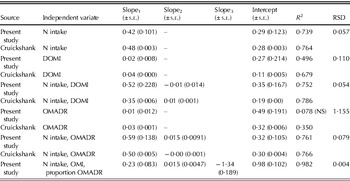
Of the published data for rumen metabolites and post-ruminal digesta flows in grazing sheep, only a few relate to lactating ewes (Dove et al. Reference Dove, Milne, Sibbald, Lamb and McCormack1988; Dove & Milne Reference Dove and Milne1994; Madibela et al. Reference Madibela, Gibbs, Sykes, Laporte-Uribe and Zhao2009). Nevertheless, the data of Cruickshank et al. (Reference Cruickshank, Poppi and Sykes1992) for early-weaned lambs allow some useful comparisons with the present data. For example, Cruickshank et al. (Reference Cruickshank, Poppi and Sykes1992) reported daily duodenal MN flows of 40·6 g/kg OMADR and 28·9 g/kg OM truly disappearing across the rumen (OMTDR) of lambs grazing grass pastures. The equivalent values for unsupplemented ewes in the current study are similar at 43·6 g/kg OMADR and 28·9 g/kg OMTDR, respectively. Cruickshank et al. (Reference Cruickshank, Poppi and Sykes1992) also drew together their own data and previously published information to establish relationships between NAN flow to the small intestine, N intake, DOM intake and the amount of OMADR, all expressed in g/d/kg LW. Their calculated relationships are shown in Table 8 together with those derived in the present study.
Regression parameters relating NAN flow (g/d per kg LW) to the intakes of N (g/d per kg LW) or DOMI (g/d per kg LW) or N intake and amount of OM apparently disappearing across the rumen (OMADR, g/d per kg LW), derived in the present study or from the tabulated relationships in Cruickshank et al. (Reference Cruickshank, Poppi and Sykes1992)

NS: not significant.
In both cases, NAN flow/kg LW was closely related to N intake/kg LW, to DOMI/kg LW and to the combination of these, by relationships that were similar between the two studies (Table 8). Moreover, the relationship in Table 8 between NAN flow and DOMI (both per kg LW) in the current study is similar to that which can be calculated from Dove & Milne (Reference Dove and Milne1994) for similar, non-lactating ewes during autumn grazing of the same pasture used in the current study, i.e.

The relationship between NAN flow and the combination of N intake and the amount of OMADR was also similar in each of the studies and explained >0·76 of the variance in NAN flow. Based on the mean values for N intake/kg LW and OMADR/kg LW in Cruickshank et al. (Reference Cruickshank, Poppi and Sykes1992), their equation predicts a daily NAN flow of 0·87 g NAN/kg LW, while the equation derived in the current study predicts a very similar NAN flow of 0·88 g NAN/kg LW. In the current study, the relationship that explained the greatest proportion of the variance in NAN flow/kg LW was that which included N intake/kg LW, OMI/kg LW and the proportion of the digested OM which apparently disappeared across the rumen (Table 8). This regression explained >0·98 of the variance in NAN flow/kg LW.
The microbial protein yield in unsupplemented ewes in the current study can be calculated to be 272 g MCP/kg OMADR (Table 6), equivalent to 174 g MCP/kg DOMI. These values are completely consistent with the values of 279 g MCP/kg OMADR and 182 MCP/kg DOMI cited by CSIRO (2007) from a review of data in sheep grazing spring forages. Using the relationships in CSIRO (2007) to estimate the proportion of MCP which is true protein (=amino acids), the daily flow of amino acids in unsupplemented ewes in the current study was estimated to be 91·2 g/kg DM intake. This is almost identical to the value of 91·9 g/kg DM intake over days 43–68 of lactation recently reported by Madibela et al. (Reference Madibela, Gibbs, Sykes, Laporte-Uribe and Zhao2009) for lactating ewes grazing perennial ryegrass/white clover pastures.
Taken together, the above comparisons indicate that the digesta flow data in the current study are in close agreement with previous data and can thus be used as the basis to interpret the measured responses in milk production and in ewe and lamb LW.
A number of studies of the supplementation of lactating ewes have reported that protein supplements with low rumen-protein degradability resulted in increased lamb LW gain (Vipond Reference Vipond1979) or increased milk production (Loerch et al. Reference Loerch, McClure and Parker1985; Robinson Reference Robinson, Slade and Lawrence1990). Subsequently, other studies with grazing ewes have demonstrated milk yield or lamb growth responses to supplementation with rumen-undegradable protein (e.g. Penning et al. Reference Penning, Orr and Treacher1988; Frey et al. Reference Frey, Thomas, Ansotegui, Burfening and Kott1991; Hoon et al. Reference Hoon, Herselman, van Heerden and Pretorius2000; Mikolayunas et al. Reference Mikolayunas, Thomas, Albrecht, Combs, Berger and Eckerman2008), while Madibela et al. (Reference Madibela, Gibbs, Sykes, Laporte-Uribe and Zhao2009) showed that fishmeal supplementation increased the post-ruminal flow of amino acids in lactating ewes. A major objective of the current study was to assess the extent to which there might be different responses to an energy supplement cf. a protein supplement based on formaldehyde-treated soyabean meal. The data for DM disappearance of supplement from nylon bags incubated in the rumen (see above) plus the fact that there was a considerably lower proportion of MN in the daily NAN flow of LP ewes (Fig. 5 b) indicate that the formaldehyde treatment of the protein supplement was successful. The current results show that compared with unsupplemented ewes on the low-herbage mass treatment, supplemented ewes lost less weight and body condition (Figs. 2 and 3; Table 1). However, considered across all four replicates, the responses of ewes on treatments LE and LP were not different. Similarly, lambs from LE and LP ewes grew 40–60 g/d faster than those from treatment LO during the supplementary-feeding period, with no difference evident between the LE and LP treatments (Table 2). Supplementation significantly reduced the herbage intakes of intact ewes, and the substitution between herbage and supplement was c. 0·83 for LP ewes and 0·37 for LE ewes. There was no statistically significant effect of supplementation on the yield of milk or its components (Table 4), though values were always arithmetically higher for LP ewes.
The data in Table 5 indicate clearly that both supplements resulted in increased rumen concentrations and pool sizes of acetate, propionate and butyrate, and thus the ruminal energy supply would be expected to be higher with both supplements compared to treatment LO. Furthermore, the data in Table 6 indicate that both supplements led to higher daily flows of NAN and MN. For LP ewes, the increased daily NAN flows and the lower proportion of MN in the NAN presumably reflect increased post-ruminal flows of undegraded dietary protein.
Hence, despite attempts to make the two supplements different in terms of their provision of energy and protein, the combination of different degrees of substitution between supplement and herbage, and the kinetics of digestion of the resultant herbage/supplement mixes, meant that the actual provisions of extra energy and protein in and beyond the rumen by the supplements were less different than intended. This serves to emphasize the point made by Dove (Reference Dove, Freer and Dove2002) that the distinction drawn between ‘energy’ and ‘protein’ supplements is ‘only a general distinction and one of convenience’. Both kinds of supplements have the capacity to alter energy supply to the animal, the amount of microbial protein synthesized and the amount of dietary protein escaping rumen degradation. The response to supplements can also be affected by differences in the mobilization of body energy reserves when animals consume different supplements.
CONCLUSION
The current results indicate marked responses of lactating ewes and their lambs to the provision of either higher herbage masses or the provision of supplements during the first 50 days of lactation, but overall, do not provide strong evidence for a difference in response to an ‘energy’ supplement compared with a ‘protein’ supplement. The measurements of intakes and digesta flows provide some clarification of why this occurred. Differences in substitution rate between herbage and each of the supplements, coupled with the fact that both supplements resulted in increased provision of short-chain fatty acids in the rumen and increases in post-ruminal protein supply, meant that the actual difference in the nutrient provision from the supplements was less clear-cut than intended and thus resulted in no marked difference in the response of the animals consuming them.
We thank Miss Vicki Farr, Mr Ed Sked and Mr John McKenzie for their excellent technical assistance. The senior author acknowledges the financial assistance provided by the Stapledon Memorial Trust and the Australia–Britain Society.