I. INTRODUCTION
Amorphous carbon (a-C) films are extensively used as protective overcoats in numerous applications, mainly due to their excellent physical properties and chemical inertness. Among various film deposition techniques,Reference Ishikawa, Takeiri, Ogawa and Takagi1–Reference Lu and Komvopoulos4 radio-frequency (rf) sputtering is a widely used film deposition method, in which the film precursors (carbon atoms and/or clusters of atoms) require low input energy compared to deposition methods using energetic ions as film-forming precursors. Moreover, inert ion bombardment of the film surface during sputtering allows the film properties to be tailored without changing the film chemical environment. Energetic Ar+ ion bombardment of the growing film is commonly used in sputter deposition to enhance the film density and hardness.Reference Lu and Komvopoulos4–Reference Schwan, Ulrich, Theel, Roth, Ehrhardt, Becker and Silva6 However, ion bombardment usually produces films with high residual stress and varying microstructures, depending on the dominance of competing kinetic processes occurring under nonequilibrium film-growth conditions.Reference Lu and Komvopoulos4,Reference Schwan, Ulrich, Roth, Ehrhardt, Silva, Robertson, Samlenski and Brenn7–Reference Lu and Komvopoulos9 Previous studies have shown that ion bombardment produces compressive residual stresses up to about −16 GPa,Reference Schwan, Ulrich, Roth, Ehrhardt, Silva, Robertson, Samlenski and Brenn7,Reference Lu and Komvopoulos9,Reference Lu, Komvopoulos and Yeh10 which may lead to film delamination, buckling, agglomeration (clustering), and other adhesion failures when a critical film thickness is reached.Reference Ohring8,Reference Lu, Komvopoulos and Yeh10,Reference Srolovitz and Goldiner11 Therefore, preventing the development of high residual (intrinsic) stresses in films deposited under sputtering conditions of energetic ion bombardment is critical to the maximum film thickness.
Because the film roughness and friction characteristics affect the tribological performance of contacting surfaces, methods of depositing relatively smooth and hard films are of particular interest. Several methods have been used to prevent the development of undesirable high residual stresses in carbon films including postprocess treatments (e.g., thermal annealingReference Friedmann, Sullivan, Knapp, Tallant, Follstaedt, Medlin and Mirkarimi12–Reference Sullivan, Friedmann and Baca15), the addition of various elements (e.g., Si, Al, W, and Ti) to modify the film structure,Reference Chhowalla, Yin, Amaratunga, McKenzie and Fauenheim16–Reference Zhang, Tay, Sun and Lau21 and the deposition of multi-layer films consisting of alternating hard and soft a-C layers.Reference Logothetidis, Charitidis, Gioti, Panayiotatos, Handrea and Kautek22,Reference Lu, Komvopoulos, Patsalas, Charitidis, Gioti and Logothetidis23
The structure and properties of sputtered a-C films greatly depend on deposition conditions. For example, ultrathin a-C films with sp 3 contents equal to ∼50 at.% and nanohardness as high as ∼39 GPa can be synthesized under optimum sputtering conditions of absorbed rf power, substrate bias voltage, working pressure, and gas flow rate.Reference Lu and Komvopoulos4 The substrate bias voltage is of particular significance because it controls the kinetic energy of bombarding Ar+ ions. The very low roughness and high hardness of a-C films synthesized under rf sputtering conditions of optimum substrate bias voltage (typically, equal to −200 V) may be attributed to the competing effects of ion bombardment, re-sputtering, and irradiation damage by highly energetic Ar+ ions.Reference Lu and Komvopoulos4,Reference Wan and Komvopoulos24,Reference Xie and Komvopoulos25
The deposition of multi-layer a-C films consisting of hard and soft ultrathin carbon layers has been the objective of several previous studies. The low residual stress of multi-layer carbon films with alternating sp 2- and sp 3-rich carbon layers has been attributed to stress relaxation caused by the soft (sp 2-rich) buffer layers;Reference Logothetidis, Charitidis, Gioti, Panayiotatos, Handrea and Kautek22 however, x-ray photoelectron spectroscopy (XPS) was used in the former study to examine the cross-sectional structure of the ultrathin layers in the film, which has limited resolution for nanoscale structural analysis. Nanoindentation, XPS, and x-ray reflectivity studiesReference Lu, Komvopoulos, Patsalas, Charitidis, Gioti and Logothetidis23,Reference Patsalas, Logothetidis and Kelires26 of the microstructure and nanomechanical properties of multi-layer films with alternating soft and hard a-C layers [deposited under rf sputtering conditions of 0 (or floating) and −200 V substrate bias voltage, respectively] showed a film hardness of ∼20 GPa, mass density of soft and hard layers equal to 2.0–2.2 and 2.5 g/cm3, respectively, and average sp 3 content of ∼46 at.%. Although the growth and physical properties of single a-C films deposited by rf sputtering have been thoroughly studied, a comprehensive analysis of the cross-sectional nanostructure of multi-layer a-C films has not been reported yet.
The main objective of this study was to investigate the friction characteristics and nanostructure of multi-layer a-C films and compare them to those of single-layer a-C films deposited under the same sputtering conditions. The surface morphology (roughness), friction properties (coefficient of friction), cross-sectional nanostructure (atomic carbon hybridization), and residual stress of single- and multi-layer a-C films having the same thickness are examined in the context of atomic force microscopy (AFM), surface force microscopy (SFM), transmission electron microscopy (TEM), electron energy loss spectroscopy (EELS), and curvature measurement results.
II. EXPERIMENTAL METHODS
A. Film deposition
Single- and multi-layer a-C films of different thickness were deposited on smooth Si(100) substrates of root-mean-square (rms) roughness equal to ∼0.1 nm by sputtering a high-purity (∼99.99%) graphite target with Ar+ ions in a low-pressure sputtering system (Randex-2400 model, Perkin-Elmer, Waltham, Massachusetts). Before film deposition, the graphite target was first cleaned by sputter etching for 15 min and then the Si(100) substrate was sputter etched for 3 min under conditions of forward rf power P f = 250 W, working pressure p = 3 mTorr, and Ar gas flow rate f = 20 sccm to produce a clean, oxygen-free silicon surface. The multi-layer films comprised five alternating hard and soft ultrathin (∼10 nm) a-C layers, with the first layer deposited onto the Si(100) substrate and the last (top) layer both being hard a-C layers. All depositions were performed in pure Ar atmosphere of P f = 750 W, p = 3 mTorr, and f = 20 sccm. Soft and hard a-C layers were synthesized under a substrate bias voltage V s = 0 and −200 V, respectively. Besides the substrate bias voltage, all other deposition parameters of soft and hard a-C layers were the same. Single-layer a-C film deposition was performed under the same plasma discharge conditions as the hard layers of the multi-layer films (i.e., V s = −200 V). The aforementioned plasma discharge conditions have been shown to produce a-C films with optimum properties.Reference Lu and Komvopoulos4,Reference Lu, Komvopoulos and Yeh10 For single-layer a-C films, the deposition time was t ≈ 4, 6, and 12 min, resulting in a film thickness h ≈ 30, 60, and 120 nm, respectively. To obtain a total deposition time equal to that of single-layer a-C films, the deposition time of the soft and hard layers of the multi-layer a-C films was set equal to 36, 72, and 144 s, corresponding to a multi-layer film thickness h ≈ 30, 60, and 120 nm, respectively. The effective hardness of single-layer a-C films deposited under the same sputtering conditions as the soft and hard a-C layers is equal to 19.7 and 39.2 GPa, respectively.Reference Lu and Komvopoulos27
B. Atomic force microscopy
The surface roughness of the films was determined from 2 × 2 μm2 images acquired with an AFM apparatus (NanoScope II, Digital Instruments, Tonawanda, New York) operated in tapping mode. The film roughness was calculated as the mean value of at least four measurements obtained from different images of each film surface. All AFM images were obtained with Si tips of nominal radius of curvature equal to ∼10 nm.
C. Friction testing
The coefficient of friction of the synthesized a-C films was measured with a SFM set-up consisting of a force transducer (Triboscope, Hysitron, Eden Prairie, Minnesota) interfaced with an AFM apparatus (NanoScope II, Digital Instruments). The friction experiments were performed with a conical diamond tip of nominal radius of curvature equal to ∼20 μm, using a normal force in the range of 50–1200 μN, constant sliding speed of 0.4 μm/s, and lateral displacement (sliding distance) equal to 4 μm. The coefficient of friction was calculated as the ratio of the measured lateral (friction) force to the applied normal force. For statistical analysis, at least five friction tests were performed at different surface locations of each film and the steady-state coefficient of friction was calculated as the average of 300 coefficient of friction measurements obtained along the sliding track.
D. Microanalysis methods
Cross-sectional samples for high-resolution transmission electron microscopy (HRTEM) were prepared by mechanical grinding, dimpling, and surface finishing by ion milling. To distinguish the a-C film from the epoxy glue and to separate the EELS carbon signal from that of the carbon-based epoxy glue, a thin (5–10 nm) Au capping layer was sputtered onto each sample before surface bonding. More details about the TEM sample preparation procedure used in this study can be found elsewhere.Reference Wan and Komvopoulos28,Reference Wang and Komvopoulos29
HRTEM images and EELS spectra were obtained with a microscope (F20 UT, FEI Tecnai, Hillsboro, Oregon) operated at 200 kV, using a charge-coupled device (CCD) camera (2048 × 2048 pixels) positioned 42 mm behind the Gatan imaging filter. A 16.3 mrad collection semiangle, 9.4 mrad C2 semiangle, and 150 μm C2 aperture were used in the present EELS study. The spatial resolution of the scanning TEM (without a monochromator) is equal to 0.14 nm. Using the full-width at half-maximum of the zero-loss peak, the energy resolution was found to be ≤0.58 eV. Considering that the band gap difference between sp 2 and sp 3 is about 0.8–0.9 eV, this energy resolution is sufficiently low for distinguishing sp 2 from sp 3 hybridization.
E. Film thickness measurement
Film thickness measurements were obtained with a mechanical stylus profilometer (Dektak IID, Veeco Instruments, Plainview, New York) with 0.5 nm vertical resolution. The film thickness was determined by traversing the lightly loaded stylus over a step produced by partially masking the Si(100) substrate with a small piece of a sharply cleaved silicon wafer. To validate the profilometry measurements, the thickness of single- and multi-layer a-C films (t ≈ 6 min) measured with the profilometer was confirmed by cross-sectional HRTEM and EELS.
F. Residual stress measurement
The residual stress in the films was determined from the sample curvature measured with a Flexus system (FLX-2320, KLA-Tencor, Milpitas, California). For these measurements, 4-in.-diameter p-type Si(100) wafers were coated with 60-nm-thick a-C films synthesized under the same deposition conditions as the 60-nm-thick single- and multi-layer a-C films. The residual stress σ in the films was determined from Stoney's equation
 $$\sigma = \left( {{E \over {1 - \nu }}} \right){{{d^2}} \over {6Rh}}\quad ,$$
where E/(1 − ν) is the biaxial elastic modulus of the substrate (equal to 180.5 GPa for Si(100)), d and h are the substrate and film thickness, respectively, and R is the measured radius of curvature of the coated Si(100) substrate.
III. RESULTS AND DISCUSSION
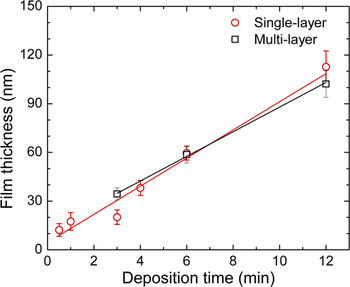
Figure 1 shows that, for the present sputter deposition conditions, the thickness of both single- and multi-layer a-C films varies linearly with the deposition time, consistent with the findings of previous studies.Reference Logothetidis, Charitidis, Gioti, Panayiotatos, Handrea and Kautek22,Reference Lu, Komvopoulos, Patsalas, Charitidis, Gioti and Logothetidis23 The close agreement of the film thickness measurements implies a similar film growth rate of ∼9.2 nm/min for both types of a-C films deposited under these sputtering conditions.
Thickness of single- and multi-layer a-C films versus deposition time.

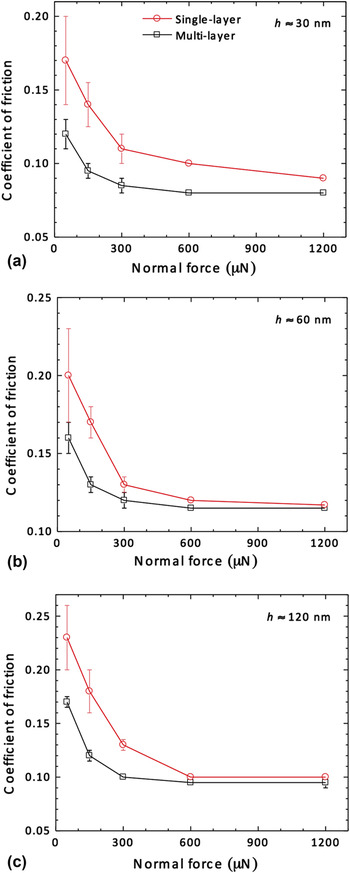
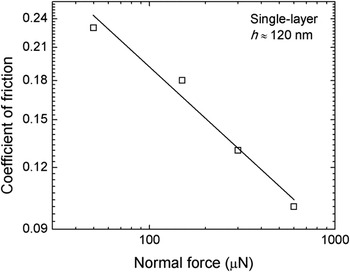
Figure 2 shows the variation of the coefficient of friction of single- and multi-layer a-C films with the normal force and film thickness. In the low-force range (<600 μN), the coefficient of friction decreases with the increase of the normal force in a nonlinear fashion. This trend indicates the dominance of elastic deformation at the film surface for sliding under a normal force of <600 μN. It is well known that the friction coefficient of elastic spherical contacts is inversely proportional to the cubic root of the applied normal force and that the friction force is mainly controlled by surface adhesion and roughness.Reference Lu and Komvopoulos27Figure 3 shows a log–log plot of the coefficient of friction of ∼120-nm-thick single-layer a-C films versus normal force. The slope of the best-fit line shown in Fig. 3 is equal to −0.34, which confirms the dominance of elastic deformation at the film surfaces for sliding in the low-force range (<600 μN).
Coefficient of friction of single- and multi-layer a-C films of thickness h approximately equal to (a) 30, (b) 60, and (c) 120 nm.

Coefficient of friction of ∼120-nm-thick single-layer a-C films versus normal force.

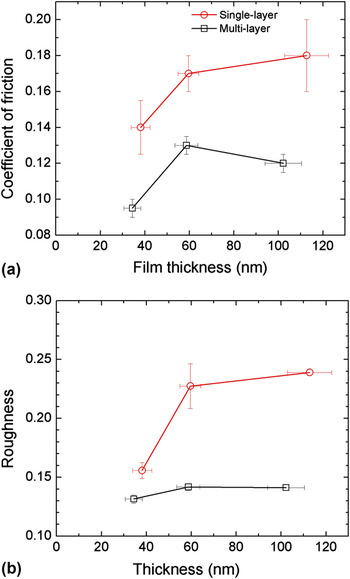
Figure 2 also shows that the multi-layer a-C films consistently demonstrated lower friction than the single-layer a-C films regardless of the film thickness. This result may be explained by considering the effect of surface roughness on sliding friction. Figures 4(a) and 4(b) show the coefficient of friction (for a normal force of 150 μN) and rms roughness of single- and multi-layer a-C films versus film thickness, respectively. The general trend is for the coefficient of friction of both types of film to increase with the rms roughness; however, the rougher single-layer films yielded significantly higher coefficients of friction than the multi-layer films.
(a) Coefficient of friction (normal force = 150 μN) and (b) rms roughness of single- and multi-layer a-C films versus film thickness.

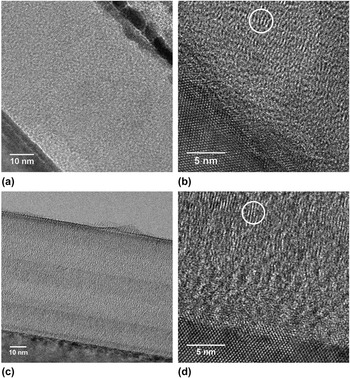
Figure 5 shows cross-sectional HRTEM images of single- and multi-layer a-C films of thickness equal to ∼60 nm. Figures 5(a) and 5(c) show overall cross-sectional views, while Figs. 5(b) and 5(d) show high-magnification images of the interface between the Si(100) substrate and the a-C films. The single-layer film shows an overall uniform thickness [Fig. 5(a)]. The five alternating hard and soft a-C layers of the multi-layer film can be distinguished by the contrast differences (the three hard layers are darker than the two soft layers) [Fig. 5(c)]. The high-magnification images reveal the formation of crystalline nanodomains in both single- and multi-layer a-C films, indicated by circles in Figs. 5(b) and 5(d), respectively. The formation of crystalline nanodomains has also been observed in a previous TEM study and has been attributed to deposition of carbon atom clusters ejected from the graphite target by the bombarding Ar+ ions.Reference Wan and Komvopoulos28 In addition, an intermixing layer of ∼2–3 nm thickness can be observed at the interface of both films with the crystalline Si(100) substrate, also in agreement with previous findings.Reference Wan and Komvopoulos28
Cross-sectional TEM images of ∼60-nm-thick single- and multi-layer a-C films: (a and c) overviews of the through-thickness film structure and (b and d) high-magnification images showing the formation of an intermixing layer at the film/substrate interface. The three hard layers shown in (c) appear to be darker than the two soft layers. The circles in (b) and (d) reveal the formation of crystalline nanodomains in the amorphous film structure.

The cross-sectional elemental composition and nanostructure (atomic carbon hybridization) of the a-C films can be interpreted in the context of analytical EELS results. The energy loss of electrons traveling through a material due to inelastic electron–electron collisions obtained from EELS analysisReference Williams and Carter30,Reference Egerton31 can be used to study the chemical composition and nanostructure. Beam electrons interacting with electrons of the conduction and/or valence bands of the sample material are detected in the low-energy-loss range (<50 eV) of the EELS spectrum, whereas information about inelastic interactions between beam electrons and inner (core–shell) electrons can be obtained from the high-energy-loss range (>50 eV). Thus, insight into the elemental composition can be obtained from ionization edges.
The C K-edge EELS spectra in the range of 280–305 eV were analyzed to determine the sp 2 and sp 3 contents of a-C films, using the pre-edge peak at 285 eV, which is due to electron excitation from the ground-state 1s core levels to the vacant π*-like antibonding states, and the edge at 290 eV, which is due to electron excitation to the higher σ* states.Reference Cuomo, Doyle, Bruley and Liu32 The π* peak was fitted with a Gaussian distribution, whereas the σ* peak was integrated over the small energy range of 290–305 eV to minimize plural scattering effects. Since the area ratio of these two peaks is proportional to the relative number of π* and σ* orbitals, which is 0/4 for 100% sp 3 and 1/3 for 100% sp 2, the content of sp 2-hybridized carbon atoms in the film x is given byReference Cuomo, Doyle, Bruley and Liu32
 $${{{{\left( {{{{\pi ^*}} \mathord{\left/ {\vphantom {{{\pi ^*}} {{\sigma ^*}}}} \right. \kern-\nulldelimiterspace} {{\sigma ^*}}}} \right)}_{{\rm{film}}}}} \over {{{\left( {{{{\pi ^*}} \mathord{\left/ {\vphantom {{{\pi ^*}} {{\sigma ^*}}}} \right. \kern-\nulldelimiterspace} {{\sigma ^*}}}} \right)}_{{\rm{std}}}}}} = {{3x} \over {4 - x}}\quad ,$$
where the standard (std) sample is an evaporated carbon film consisting of 100% sp 2. More details about the curve fitting method and the calculation of the sp 3 fraction are given elsewhere.Reference Wang and Komvopoulos33
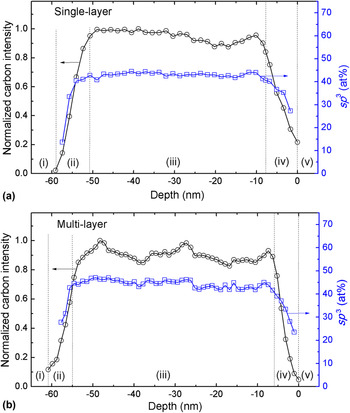
Figures 6(a) and 6(b) provide insight into the through-thickness nanostructure of ∼60-nm-thick single- and multi-layer a-C films, respectively. The carbon intensity obtained by integrating the EELS spectrum from 280 to 305 eV was normalized by the maximum carbon intensity among all spectra of each scan line, while the sp 3 depth profiles were calculated from the C K-edge spectra using Eq. (2). The carbon atom concentration and sp 3 distribution through the film thickness reveal the existence of different regions. Figures 6(a) and 6(b) indicate that both single- and multi-layer a-C film samples comprise the following five distinct regions: (i) crystalline substrate (the carbon signal intensity is not detectable because the substrate consists of silicon); (ii) intermixing layer (both carbon concentration and sp 3 content increase sharply); (iii) bulk layer (small variation in carbon concentration and almost constant sp 3 content); (iv) surface layer (both carbon concentration and sp 3 content decrease sharply); (v) capping layer (a carbon signal is not detected because this is the Au capping layer). Figure 6(b) shows that within the bulk layer of the multi-layer a-C film, the carbon intensity changes periodically showing a positive slope in the hard layers and a negative slope in the soft layers; however, the sp 3 fraction remains almost constant and there are no obvious differences between hard and soft layers. In addition, a comparison of the depth distributions shown in Figs. 6(a) and 6(b) indicates that the low in sp 3 content intermixing and surface layers of the multi-layer film are thinner than those of the single-layer film.
Depth distributions of normalized carbon intensity and sp 3 content determined from the C K-edge EELS spectra of ∼60-nm-thick (a) single- and (b) multi-layer a-C films. Dashed lines indicate the boundaries between (i) Si(100) substrate, (ii) intermixing layer, (iii) bulk layer, (iv) surface layer, and (v) capping Au layer.

Table I shows a comparison of the film thickness (determined from the TEM and EELS analysis), rms roughness, coefficient of friction (normal force = 150 μN), average sp 3 content of bulk layer, and residual stress [Eq. (1)] of ∼60-nm-thick single- and multi-layer a-C films. The sum of the thicknesses of all the layers (i.e., intermixing, bulk, and surface layers) is referred to as the film thickness. The agreement between TEM and EELS results of the film thickness is fairly good. The surface roughness of multi-layer films is ∼50% lower than that of single-layer films, consistent with the lower coefficient of friction of the multi-layer a-C films in the low-force range (Fig. 2). The similar sp 3 contents of single- and multi-layer a-C films are also consistent with the similar coefficients of friction in the high-force range (Fig. 2), where plastic shearing (plowing) is the dominant mode of deformation. Plastic shearing greatly depends on the film nanostructure, particularly the type of carbon atom bonding. Since the sp 3 fraction controls the nanomechanical properties, the single- and multi-layer a-C films should exhibit similar plastic shear resistance, which explains the similar coefficients of friction in the high-force range (>600 μN). In addition, despite the slightly higher sp 3 content of the bulk layer of multi-layer a-C films, the residual stress is ∼55% lower than that in the single-layer a-C films. Hence, rf sputtering of alternating hard (V s = −200 V) and soft (V s = 0) ultrathin (∼10 nm) a-C layers produces smoother carbon films characterized by lower friction and significantly reduced residual stress and preserves the overall nanostructure (hybridization state) compared to single-layer films of similar thickness deposited under the same sputtering conditions as the hard layers of the multi-layer a-C films.
Total thickness determined from TEM and EELS analysis, rms roughness, coefficient of friction, average sp 3 fraction in bulk layer, and compressive residual stress of ∼60-nm-thick single- and multi-layer a-C films.

* Normal load = 150 μN.
IV. CONCLUSIONS
The deposition rate, roughness, coefficient of friction, residual stress, and nanostructure of single- and multi-layer a-C films were examined in the light of profilometry, AFM, SFM, curvature method, HRTEM, and EELS results. The multi-layer films synthesized under low-pressure plasma discharge conditions of substrate bias voltage equal to 0 (soft layers) and −200 V (hard layers) demonstrated smoother surface topographies, lower coefficient of friction, significantly reduced residual stress, and slightly higher sp 3 content compared to single-layer a-C films deposited under −200 V substrate bias voltage. Sliding under a normal force of <600 μN resulted in predominantly elastic deformation of both films; however, the multi-layer films exhibited significantly lower friction than single-layer films of similar thickness. TEM revealed the existence of crystalline nanodomains in both films, whereas EELS confirmed the existence of a layered structure consisting of intermixing, bulk, and surface layers. The results of this study show that the surface roughness, friction, and residual stress of rf sputtered a-C films can be greatly reduced by depositing alternating hard and soft ultrathin a-C layers.
ACKNOWLEDGMENTS
This research was funded by the Computer Mechanics Laboratory (CML), University of California, Berkeley. The TEM/EELS studies were carried out at the National Center for Electron Microscopy, Molecular Foundry, Lawrence Berkeley National Laboratory (Proposal No. 1886). Work at the Molecular Foundry is supported by the Office of Science, Office of Basic Energy Sciences, U.S. Department of Energy (Contract No. DE-AC02-05CH11231).