


Introduction
Numerous studies in the Weddell Sea have reported sea ice with the ice surface below sea level (negative freeboard), and infiltration of brine, or flooding, at the base of the snow cover (e.g. Reference Wadhams, Lange and AckleyWadhams and others, 1987; Reference Lange, Schlosser, Ackley, Wadhams and DieckmannLange and others, 1990; Reference Lange and EickenLange and Eicken, 1991; Lytle and Ackley 1996; Mas-som and others, 1997). This brine infiltration produces slush, a mixture of snow and brine at the base of the snow. It will occur when the weight of the snow cover exceeds the buoyancy of the underlying ice, and the surface of the ice is submerged below sea level (Reference Ackley, Lange and WadhamsAckley and others, 1990; Lange and others, 1990). Infiltration of seawater into the snow cover may occur through the brine channels in the ice, or from the sides of the floes. The refreezing of this slush to form snow-ice may account for much of the total sea-ice mass. The percentage of ice with a negative freeboard, estimated from drillhole data during different voyages to the Weddell Sea, shows a large variability. Wadhams and others (1987) reported values of 13.6-28.7%, with higher values found near the ice edge and the Antarctic coast. Kicken and others (1995), summarizing data from three voyages, found that 8-40% of all drillhole measurements had negative freeboards. Reference Massom, Drinkwater and HaasMassom and others (1997) observed that 8% of the ice sampled had a negative freeboard.
Several studies have also estimated the volume of snow-ice in the pack ice using oxygen isotope data from core samples. Eicken and others (1995) estimated that 25% of the sea ice was formed from snow, while Lange and Eicken (1991) found that 16% of their core samples from the Weddell Sea were snow-ice. Eicken and others (1994) pointed out the regional and temporal variability associated with the amount of snow-ice formation. They found that, to the west of 35° W, the fraction of meteoric ice averages 6.9%, while it averages only 1.2% to the east.
This wide range of estimates of snow-ice formation, or surface flooding, has been modeled by Eicken and others (1995). They concluded that the rate of snow-ice formation increased towards the end of the ice-growth season. They used a temporally and spatially constant snow-accumulation rate and ocean heat flux, noting that local effects may significantly alter the snow-ice formation rate. Because of this temporal and spatial variability, it is difficult to collect sufficient samples in the field to estimate regionally flow much slush is present. Drilling and measuring thousands of holes, or analyzing many cores, requires considerable effort, and may still not provide enough samples for examination of the spatial or temporal variability of slush or snow-ice. in addition, as the sampling of floes is usually limited to those thick enough to stand on, thin ice or brash is often not sampled. The limited number of stations during any voyage also makes it difficult to obtain a sufficient number of samples from all ice types in a region.
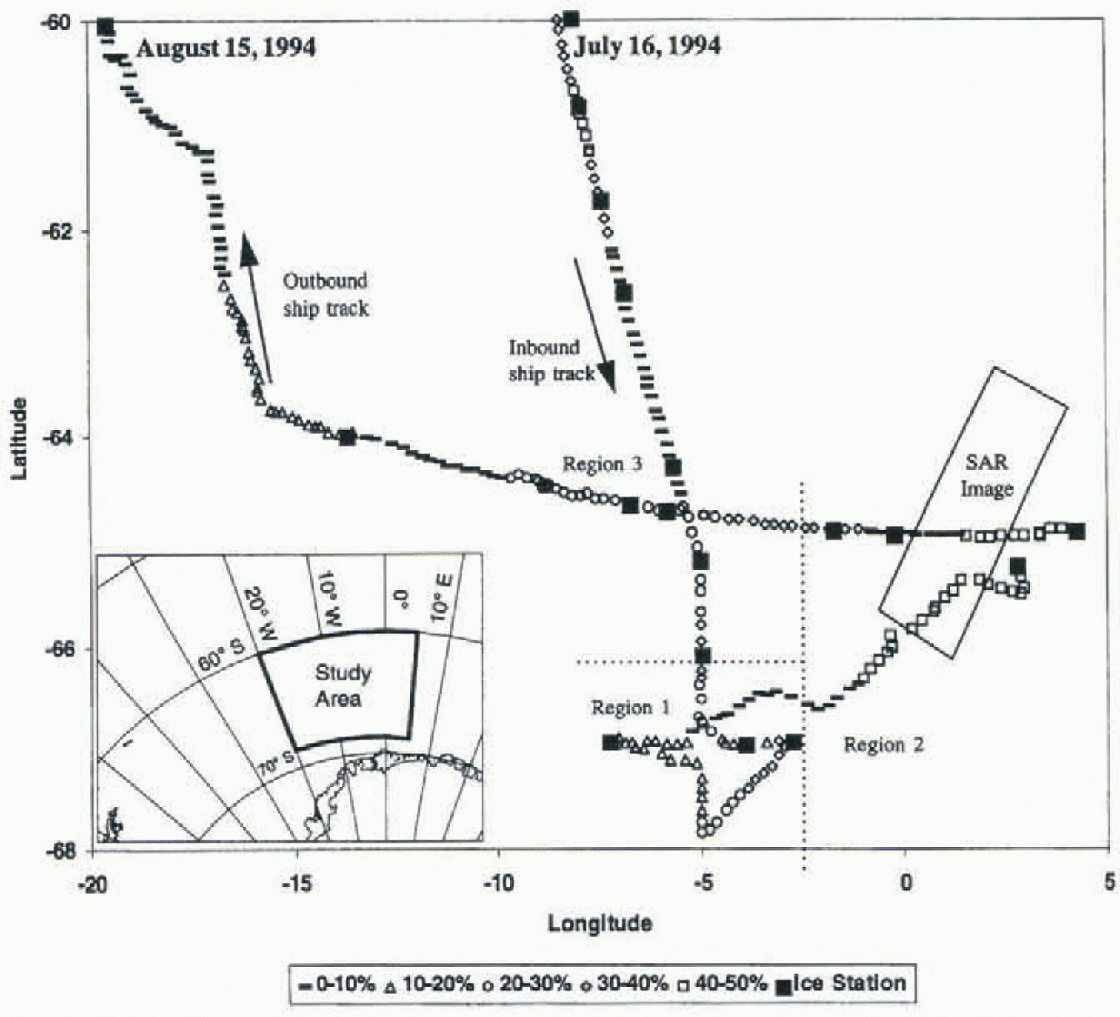
In this study, we partially overcome these difficulties by combining drillhole data with visual ice observations to obtain a minimum estimate of surface slush. The data were collected during a voyage aboard the R/V Nathaniel B. Palmer in July-August 1994. During the voyage, the ship traveled about 5000 km and traversed 20° of longitude (Fig. 1). The extensive slush observed in some regions was attributed to an ocean heat flux through the mixed layer of > 100 wm −2 (Reference McPheeMcPhee and others, 1996). As this ice melted from below at rates of > 1 cm d−1, the ice surface was constantly pushed below sea level, resulting in brine infiltration of the snow cover. Using drillhole data and ship-based ice observations, we estimate the sea-ice thickness distribution in different regions, and the minimum extent of surface slush of the sea ice during the voyage. Although this method still suffers from lack of samples on thin ice types, it provides an areal estimate of the minimum extent of slush.
The ship track during ANZFLUX, 1994. Each symbol represents the location of an individual ice observation. The percentage of slush observed is indicated by different symbols as shown in the legend. Ice stations are marked with a large square. The dotted lines are the boundaries of the three different regions described in the text. The SAR image was collected on 2 August. The average ice edge in this region, for the month of August, was between 56° and 58°S.
Data
Ship-Based Ice Observations
A total of 378 hourly ship-based observations were collected in the interior of the pack, south of 60° S, using the technique developed by Reference Allison and WorbyAllison and Worby (1994). These observations include estimates of sea-ice thickness, type, percentage ridging and concentration for up to three different ice types. The ice type is a function primarily of ice thickness, and is used to relate the regional percentage of ice which is similar in thickness to the ice measured on station. The ice types found in this study were grease ice, brash, pancakes, nilas, thin ice less than 0.15 m, young ice (0.15-0.3 m thick), first-year ice (0.3-0.7 m thick) and thick first-year ice (0.7-1.2 m). The total ice concentration (Iall) was found to agree on average to within 5% of the values obtained using the special sensor microwave/imager (SSM/I; Reference Gloersen, Campbell, Cavalieri, Comiso, Parkinson and ZwallyGloersen and others, 1992).
The ice observations were classified into three different regions (Fig. 1): region 1 is south of 66° S and west of 3° W; region 2 is east of 3° W; and region 3 is between 66° and 60° S and west of 3° W. The northern limit of region 3 was chosen to include only the interior pack ice, and does not include any ice observations from the marginal ice zone, where the ice concentration decreased and the influence of ocean swell could be seen. These regions correspond in general to the océanographie regimes outlined by McPhee and others (1996). Regions 1, 2 and 3 correspond to the “warm regime”, Maud Rise and the “cold regime”, respectively. Regions 1 and 2 are characterized by increased ocean-heat (luxes, most likely caused by the topographic effects of Maud Rise nearby and resulting in a relatively thin ice cover. A large polynya has been observed during some winters in these regions in passive-microwave satellite data (Reference Comiso and GordonComiso and Gordon, 1987). Consequently, our results in regions 1 and 2 are from a unique sector of the Weddell Sea and do not represent the average characteristics of the Weddell Sea. The ice characteristics did not show abrupt changes at the boundary of these regions, and they are only approximate limits to the different regimes. The ship traveled through much of regions 1 and 2, and these results are representative of the regional ice characteristics at the time of the study. The open-water percentage, or floe sizes seen in the SAR image (Fig. 2), do not appear to vary significantly along the ship track. Region 3 incorporates a much larger area. This part of the cruise was not an extensive survey of the region, but is comparable to other studies of sea-ice char-acteristics along a ship track (e.g. Wadhams and others, 1987; Eicken and Lange, 1989; Massom and others, 1997).
Drillhole data
Drillhole data were collected at 18 ice stations (Ackley and others, 1995). At each station, 51-101 holes were drilled at 1 m intervals along a linear transect. The total ice thickness (ti ), the height of the ice surface above sea level or freeboard (tf) and snow thickness were measured at each hole. The percentage of ice drillholes with a negative freeboard, (fneg,) was calculated at each station. The ice type d was determined based on the average ice thickness of all the drillholes at a given station. Prior to drilling, the surface of the ice was examined on about half the stations to determine whether slush or wet snow was present at the ice-snow interface. If the ice surface was wet, if was found to be negative or zero. Nowhere was the ice surface found to be dry when there was a negative freeboard. Some ice surfaces with a positive if were also found to be wet due to their high salinity, and brine wicking into the snow cover. Consequently, Fneg is a conservative estimate of the areal percentage of slush at each ice station. The ice-station floes used in this study were all at least 100 m in diameter, and most of them were >200 m. Consequently, the additional weight of people and equipment will cause a negligible change in the average freeboard.
Sar Data
European remote-sensing satellite ERS-1 synthetic aperture radar (SAR) data were collected on 2 August. The ship passed through the southern portion of the SAR swath approximately 12 h before image acquisition (Fig. 2). These limited data are used to confirm the observed ice concentration, and ensure that no significant variations occurred in the ice characteristics that were not observed during the voyage. The open water concentration estimated from the satellite data is less than about 10%, and most floes are <2 km in diameter, in agreement with the ice observations. There is a considerable amount of brash (bright areas in the SAR image) between larger floes in the southern and central portion of the image. Darker patches, which indicate open water or nilas, increase in area towards the north and along a narrow band on the eastern edge of the image.
Regional Estimates of Slush
To extend the drillhole measurements collected on individual floes to a regional estimate of slush-covered area, we use a form of non-parametric statistics described in detail by Rowntree (1981), For drillholes measured on ice type d, the amount of slush observed in the drillholes on a single station (Fneg) is related to the regional extent of slush (Fr) by:
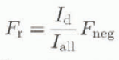
where Id and Iall are the percentage of ice type d and the total ice concentration, respectively, Iall was calculated from the ice observations, and averaged between the midpoints of the ice stations. The amount of ice with a negative freeboard (Fneg) is calculated from the drillhole measurements at the ice stations. This method only considers the contribution of the ice type on the ice station; other ice types that comprised up to 35% of the ice may have been partially or completely flooded, but are not included in the estimate of Fr. Consequently, Fr is a low estimate of the percentage of slush.
Because of the limited number of drillhole stations, this method interpolates over a large area, up to 300 km in region 3. However, the station spacing was much closer in regions 1 and 2, and the ice observations did not show large variations with in the regions. The limited SAR data (Fig. 2) also do not show large-scale changes in the ice characteristics. The ratio of the snow to ice thickness found in the ice observations was similar to that measured in the drillhole data, indicating that the conditions required to cause submergence of the ice surface did not change significantly. Although the data were collected over a period of a month, we do not consider the temporal variability of the data. The ice conditions may have changed between ice stations or during the entire voyage.
Results
Air temperatures averaged -15°c, resulting in rapid new ice formation in any newly formed open water areas, and ice concentrations generally greater than 90%. The ice-thickness distribution for each of the three regions is shown in Figure 3. Regions 1 and 2 havebimodal distributions (Fig. 3 a and b), with peaks at 0.2-0.3 m and 0.4-0.5 m. The open water concentration in regions 1 and 2 was 9.4% and 9.7%, respectively. There is virtually no ice thicker than about 0.7 m in cither of these regions, and very little ridging was observed. None of the profiles drilled in region 1 had an ice surface higher than 0.5 ma.s.l.., although two of the profiles had drifting snow up to 0.55 and 0.70 m a.s.1. Region 2 had the thinnest ice, with over 50% of the ice less than 0.3 m thick. This thin ice was apparent during the initial survey of the region to find a suitable floe to deploy equipment for a week-long study. We could not find a floe with an average ice thickness greater than about 0.3-0.4 m (McPhec and others, 1996). This thin ice is a result of the high ocean-heat fluxes in the region, which cause rapid melting of the underside of the ice (McPhee and others, 1996). None of the profiles drilled in region 2 had snow or ice surfaces higher than 0.4 m a.s.1.
Region 3 includes both the incoming and outgoing ship tracks. On the inbound track, the open water concentration averaged 16.3%, while on the outgoing track it was 7.4%. There is a single broad peak in the ice-thickness distribution at 0.4-0.5 m (fig. 3c). We observed thicker ice, with 23% of the ice thicker than 0.7 in. More deformation was observed in this region, particularly on the outbound leg of the voyage. Increased ridging was seen, and several of the drillhole profiles had ice surfaces higher than 0.5 m a.s.1.
An ERS-1 SAR image collected on 2 August 1994. See Figure 1 for the location. The swath width is approximately 110 km. The ship track 12 h prior to the satellite overpass is shown. The wind speed was approximately 5ms−1 with an air temperature of approximately - 17°C. SAR image © European Space Agency, 1994.

Sea-ice thickness distributions from ice observations in (a) region 1, (b) region 2 and (c) region 3.

The distribution of ice elevations from the drillholes at all the ice stations is shown in Figure 4. Negative ice elevations were measured in 28% of the 1017 drillholes. If we include measurements with a zero freeboard, this doubles to 56%. Only one of the 18 ice stations had no negative values of ¿1,, while the maximum was 78% on a single Too m profile line (in region 3). Only 1.8% of the freeboards were less than -0.06 m. This is indicative of the small amount of deformation seen, which can result in much larger negative freeboards. It also reflects the dynamic equilibrium of the ice cover. Although there was considerable slush much of the time, the cold air temperatures and clear skies (Reference GuestGuest, 1995) resulted in high surface-heat fluxes, and the slush layer rapidly refroze.
The regional extent of slush, Fr, is plotted along the ship track in Figure 1. Fr is highly variable, ranging from 0% to 78%, with values greater than 30% found in all regions. On average, the highest values were found in region 2, and the lowest on the outbound leg in region 3. Figure 1 is an indication of the areal extent of slush as the ship moved along its track, rather than a snapshot of the conditions al a given time.
The distribution of icefreeboards (tf) measuredfrom drillholes. Not shown is 1.7% of measured if greater than 0.13m, and 1.9% less than 0.06m.

Discussion
The proportion of negative freeboards observed in July-August 1994 is, at 28%, lower than the 40% found during the WWGS '89 voyage to the Weddell Sea (Eicken and others 1995), but higheir than that reported by other studies in the region (Wadhams and others, 1987; Lange and Eicken, 1991; Massom and others, 1997). We observed that 56% of the ice surface sampled was at or below sea level, an indication of the potential for brine infiltration. Although Ft is highly variable, it generally increased towards the east (Fig. 1), as the ice thickness decreased. Although ice formed rapidly in open water regions, the total ice thickness was limited by the large ocean-heat flux. Extensive slush formation in the region is believed to be primarily caused by the high ocean-heat fluxes. Slush was also observed near ridges, with wind redistribution of snow contributing to a locally thicker snow (Massom and others, 1997). Assuming a simple isostatic balance, 0.25 m of ice (the mode in the ice-thickness distribution for region 3) can support only about 0.1 m of snow with a density of 290 kg m ;i (Eicken and others, 1994). Snow thicknesses greater than 0.1 m were frequently observed, particularly in sastrugi or drifts around ridges. Refreezing of the slush to form snow-ice was commonly observed. Periodic precipitation provided a constant supply of snow, continuing this process of brine infiltration and slush formation, followed by refreezing to form snow-ice.
The high ocean-heat fluxes allowed only a thin layer of ice to form in regions 1 and 2 (McPhee and others, 1996). With decreased ocean heat fluxes in the cold océanographie regime to the west and north (region 3), the ice thickness increases rapidly during the cold winter. The peak in ice thickness at 0.4-0.5 m seen in regions 1 and 2 may be thicker ice that has been advected into the region. This ice may have formed during the original advance of the ice edge or in a region with a smaller ocean-heat flux. The 0.4 0.5 m ice may also result from rafting of the thinner, 0.2-0.3 m thick ice. The absence of ice thicker than 0.7 m is indicative of the large ocean heat.
The brine infiltration and subsequent snow-ice formation will preferentially occur on portions of the floe with thinner ice, increased deformation or increased snow thickness. Assuming that no further deformation takes place, this process can slowly smooth out any surface ridges or hummocks formed during deformation. It is estimated that, for the measured melt rates of 1 -2 cm d−1, 0.3 cm of snow-ice will form within 2-4 weeks. Assuming that snow-ice forms in the lower portions of the (Iocs, this will effectively reduce a hummock which is 0.5 m above the average ice surface to 0.2 m above the surface. This estimate relies on the ice remaining in the region of high heat flux for this length of time. This smoothing process has been observed in autumn on second-year ice in the western Weddell Sea (Lytic and Ackley, 1996).
The ice is in a dynamic equilibrium as it melts from the bottom, while snow-ice forms on the surface. Although the ice was much thinner to the east, the ice concentration remained high. Although the ocean heat flux may limit the total ice thickness, it is essentially the atmospheric conditions which largely determine the ice concentration at any given time.
Conclusions
Although it involves extrapolation over wide regions and long time periods, the method presented here provides a means of estimating the arcal extent of slush, a physical parameter which is difficult to measure directly over large regions. This was facilitated by the fact that the observed ice thickness in study regions 1 and 2 was within a narrow distribution, with 90% of the ice being 0.2-0.6 m thick. This allowed a relatively small number of ice stations to represent a large proportion (>65%) of the total ice-thickness distribution. For a broader ice-thickness distribution, as occurred in region 3, additional ice stations are required on a wider variety of ice types to represent adequately the areal extent of slush using this method.
Acknowledgements
We thank S. Ackley for his permission to use the data, and his helpful comments on the manuscript. Thanks to the officers and crew of the R/V Nathaniel B. Palmer Ardai, J. Evans and the Antarctic Support Associates personnel for their untiring assistance in collection of the data. N. Darling, G. Kuehn and K. Golden collected much of the ice-observation data and the drillhole measurements. K. Michael helped combine the datasets. We are also very grateful to the two reviewers, J. Comiso and p. Gloersen of Code 971, NASA Goddard Space Flight Center, Greenbelt, MD. This work was supported in part by NSF OPP 9315934 (principal investigator S.F. Ackley).



