1. INTRODUCTION
Modification of metal products with pulsed electron or ion beams provides heating and cooling of boundary layers of a treated item at a rate of more than 107–109 K s−1 (Pogrebnjak, Reference Pogrebnjak1994). The pressure developed on the target is of the order of 107–1010 Pa (Boyko et al., Reference Boyko, Skvortsov, Fortov and Shamanin2003). This allows compounds and structures to be realized in surface layers which cannot be made by traditional industrial methods. As a result, the characteristics of materials change: Solidity, strength, wear resistance; the operational characteristics of items made from these materials improve.
Most generators of intense pulsed electron and ion beams use a Blumlein-type pulse-forming line to produce short duration high-voltage pulses. A Blumlein generator is capable of generating a high-voltage pulse with a rise time of the leading edge of the pulse of 1013 V s−1 (Mesyats and Proskurovsky, Reference Mesyats and Proskurovsky1989). Such conditions of fast energy input allow for plasma formation on the entire surface of the cathode due to the phenomenon of explosive electron emission (Mesyats & Proskurovsky, Reference Mesyats and Proskurovsky1989). In these conditions, the characteristics of a diode are mainly determined by physical processes in the diode gap and do not depend on emission ability of the cathode (or anode). This provides a better shot-to-shot reproducibility of the accelerator output parameters and a long lifetime of the diode unit. With a slow rising voltage typically of 1012 V s−1 plasma formation on the cathode surface is negatively affected and as a result only a part of the cathode surface takes part in generation of electron or ion beam, which affects the shot-to-shot repeatability of the beam parameters.
One of the most important parameters of any intense ion beam accelerator, from an industrial perspective, is good reproducibility of the beam and a long lifetime under repetitive operation. In our paper (Pushkarev et al., Reference Pushkarev, Isakova and Khailov2012), we presented a review on ion current density reproducibility for different diodes. It was shown that a magnetically insulated ion diode (MID) (300–350 kV, 80 ns, 150–300 A cm−2) utilizing a polymer anode (Zhu et al., Reference Zhu, Lei, Dong and Ma2003; Reference Zhu, Dong, Han, Xin and Lei2007) exhibits the most stable operation from shot-to-shot. A distinct feature of this MID is an improvement in the cathode geometry. The special configuration of cathode works as a one-turn “close” coil to build an insulating magnetic field externally by applying a pulsed current of microsecond duration. The authors pointed out that the decrease in values of all the parameters experiences two stages. The ion current density variation was about 5% for N ≤ 200 (stage I), increasing to (15 ÷ 20)% for N ≥ 400 (stage II). The life of polymer anode did not exceed 1000 pulses, after that a severe degradation of the anode surface was observed.
In a previous paper (Pushkarev et al., Reference Pushkarev, Isakova and Khailov2012) we presented the analysis of shot-to-shot reproducibility of the ion current density for the beam formed by a self-MID with an explosive emission graphite cathode. It was found that the shot-to-shot variation in the ion current density was about 35–40%, while the diode voltage and current were comparatively stable with variation <10%. It was shown that focusing of the ion beam reduces variations in ion current density to 18–20%.
With the ion current density of 40–70 А сm−2, accelerating voltage of 250–300 kV and pulse duration of 100–150 ns, the charge density in one pulse does not exceed 2–4 μC cm−2. This corresponds to the fluence of ions in one pulse of 1.3–2.5 × 1013 cm−2 at the energy density of 2–3 J cm−2. The range of 200–300 keV carbon ions in metals does not exceed about 1 μm and the concentration of carbon atoms in a near-surface layer is <1017 cm−3. Therefore, a significant factor affecting the properties of a treated specimen is the thermal effect of the beam, rather than ion implantation. Therefore, considerable attention should be paid to achieve good reproducibility of pulsed ion beam (PIB) energy density.
Most intense PIB generators use a magnetically insulated diode comprising two coaxial cylindrical cathodes (a “barrel diode”) with magnetic field formed between the cathodes. Plasma on the anode surface is formed as a result of dielectric breakdown. Davis et al. (Reference Davis, Bartsch, Olson, Rej and Waganaar1997) presented statistical data on shot-to-shot reproducibility of the beam formed by an applied B r magnetically insulated diode (400 keV, 30 kA, 0.5 μs). The authors observed a considerable shot-to-shot variation of about 30% in both the ion current density measured by a magnetically insulated Faraday cup, and the energy density measured by an infrared imaging technique. The analysis was made based on the data from four Faraday caps and thermal inprints for a set of 9–11 pulses. In the paper of Zhu et al. (Reference Zhu, Lei, Dong and Ma2003) it is shown that the fluctuations in the ion current density is 20–30%, while the shot-to-shot variation in accelerating voltage does not exceed 4–6%. At the same time the standard deviation (SD) of the energy density is 21–31%. In the paper (Zhu et al., Reference Zhu, Dong, Han, Xin and Lei2007), the authors present the results of statistical performance of the ETIGO-I accelerator (accelerating voltage 1.1 MV, total diode current 80 kA, and energy density 60–90 J cm−2). The variation in the energy density was 24% with the operational life of the diode being <10 pulses. Our previous studies on the strip focusing diode with a graphite explosive emission cathode showed that in a set of 50–100 pulses the SD of ion beam energy density does not exceed 10–11% (Isakova et al., Reference Isakova, Pushkarev and Khaylov2013). The aim of this study is to improve the stability of the total energy and energy density of an ion beam formed by diodes with explosive emission cathode of different design and analysis of the main sources of shot-to-shot fluctuations.
2. EXPERIMENTAL APPARATUS AND DIAGNOSTICS
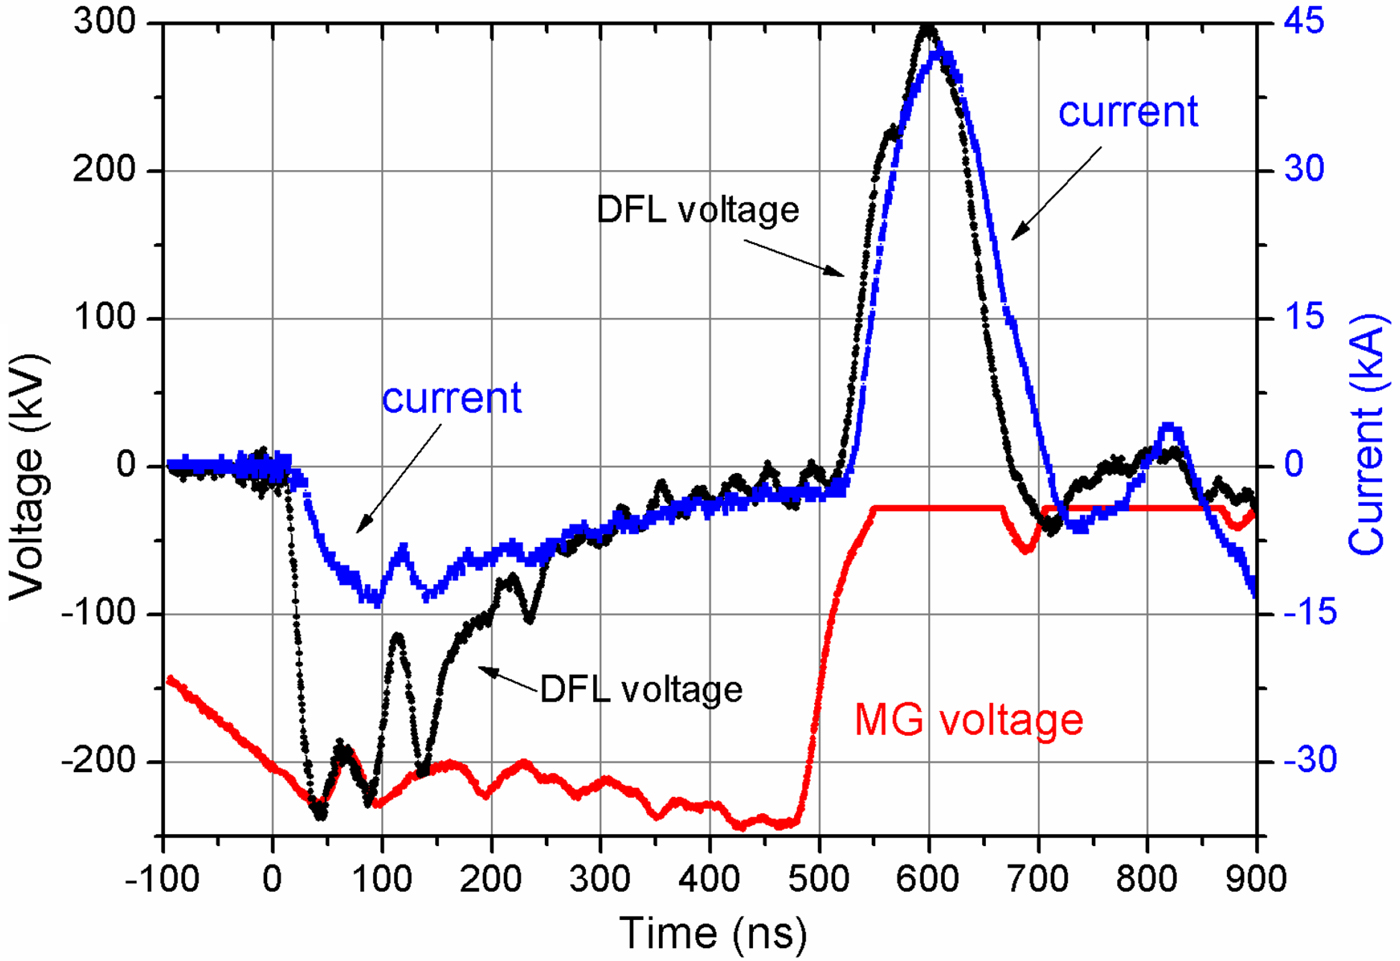
The experiments have been conducted using the TEMP-4M accelerator (Pushkarev & Isakova, Reference Pushkarev and Isakova2013). The accelerator consists of three main components: A capacitive storage – the Marx generator, a Blumlein type pulse – forming line, and vacuum ion diode with self-magnetic insulation of electrons. The generator configured in bipolar-pulse mode forms two pulses of opposite polarity: The first pulse is of negative polarity (400–500 ns, 100–150 kV), and this is followed by a second pulse of positive polarity (120 ns, 250–300 kV). The first pulse is used for the formation of explosive-emission plasma on the surface of the potential electrode (cathode). The second pulse is used for the extraction of ions from this plasma. The ion energy density was 0.5–5 J cm−2 (depending on the diode geometry), and the pulse repetition rate was 5–10 pulses min−1. Additional information on accelerator construction, the diode geometry, diagnostic equipment used in the accelerator, and calibration can be found elsewhere (Isakova, Reference Isakova2011). The waveforms of accelerating voltage, total diode current, and Blumlein charging voltage are shown in Figure 1.
The waveforms of voltage and current at the output of Blumlein and charging voltage of Blumlein.
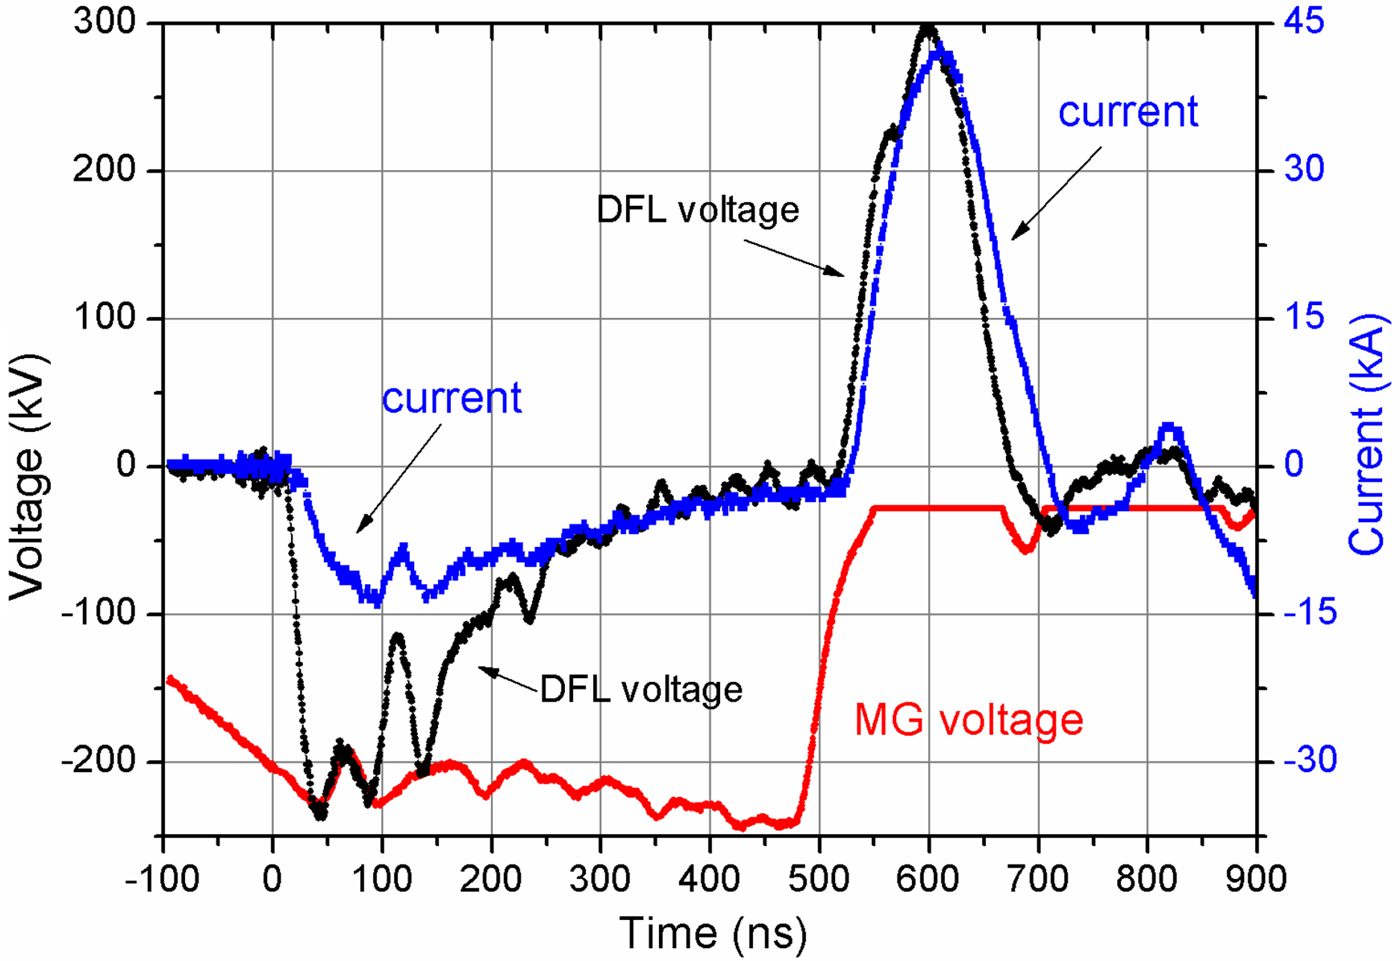
A coaxial double transmission line (Blumlein) with deionized water dielectric and a characteristic output impedance of 5 Ω has two spark gaps: the main gap at the Marx generator end, and the preliminary gap at the diode side. The vacuum strip diode has a potential electrode and a grounded electrode, with the potential electrode being connected via the preliminary spark gap to the inner conductor of the Blumlein. The central conductor of the Blumlein is connected to the Marx generator. The grounded electrode of the diode is connected to the body of the diode chamber at one end. In double-pulse mode, the accelerator works as follows. The Marx generator charges a capacitance C 1 = 16 nF between the central and outer conductors of the Blumlein. The capacitance C 2 = 14 nF between the central and inner conductors forms a capacitive divider with parasitic capacitance between the inner and outer conductors, so the potential on the inner conductor settles to be approximately equal to that of the central conductor. Therefore during this phase we consider only C 1 charges. Once the preliminary spark gap breaks, C 2 can now charge. The charging occurs through the preliminary spark gap and the diode, which forms the first voltage pulse of negative polarity (300–600 ns, 100–150 kV). During the first pulse explosive emission plasma is formed on the surface of the potential electrode (cathode). Also during the first pulse, both C 1 and C 2 in the Blumlein continue to be charged by the Marx. After a delay the main spark gap breaks down, due to the higher breakdown voltage; the delay is controlled by the gas pressure in the main spark gap, with a greater delay for higher pressure. The second (positive) voltage pulse (120 ns, 250–300 kV) is formed when the main spark gap breaks down. During the second pulse ions are extracted from the plasma and accelerated toward the grounded electrode, passing though slits and into the transportation region.
The charging voltage of Blumline was measured by a differential voltage divider (Isakova et al., Reference Isakova, Pushkarev and Kholodnaya2011). The voltage at the output of Blumlein was measured by a resistive–capacitive divider. The Blumlein charging current was measured by a Rogowski coil installed at the output of the Marx generator. The total diode current was measured using another Rogowski coil installed in front of the diode connection. The electrical signals coming from the sensors were recorded with a Tektronix 2024B oscilloscope (250 MHz, 5 GSPS).
A major part of the experiments was done using a focusing strip diode, having dimensions 20 cm × 4 cm, the focusing distance was 14 cm. The potential electrode is made from graphite. The grounded electrode is made from stainless steel with a matrix of 2 cm × 0.5 cm slots resulting in an overall transparency of 70%. The gap spacing between the potential and the grounded electrodes (A–C gap) was adjusted to 8–9 mm in order to match with the impedance of the Blumlein (5 Ω). To achieve geometric focusing of the ion beam diode has concave-shaped electrodes focusing the beam within the y–x plane, where the x-axis is in the beam propagation direction. For increasing ion beam focusing efficiency and preventing the ion loss from the beam volume during propagation to the target, we used a metal shield installed on the grounded electrode. The shield was made from 1 mm stainless steel foil (Pushkarev et al., Reference Pushkarev, Isakova and Khailov2013a).
The ion current density and energy density were measured using a magnetically insulated Faraday cup and an infrared camera (Isakova & Pushkarev Reference Isakova and Pushkarev2013), respectively. The diode with self-magnetic insulation works effectively at a pressure of 0.1 Pa with a lifetime of >106 pulses. The pulse repetition rate was limited only by heating of the diode and spark gaps.
3. STABILIZATION OF ION BEAM ENERGY
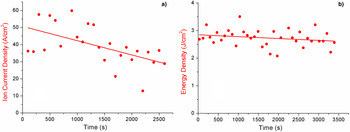
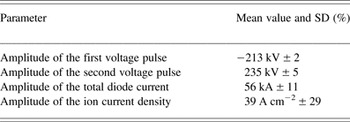
The results of a statistical analysis of the accelerator output parameters are shown in Figure 2 and summarized in Table 1.
The shot-to-shot variation in the ion current density (a) and maximum energy density (b).

Statistical analysis of the electrical parameters for the TEMP-4M accelerator
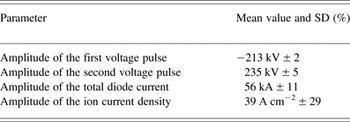
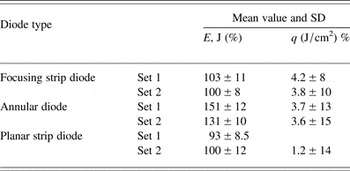
The shot-to-shot reproducibility of ion current density for the focusing diode was found to be poor, with a typical SD being 20–30%, but the variations in output parameters of the Blumlein generator did not exceed 10%. However, the reproducibility of energy density for the same diode is much better (see Table 2).
Statistical analysis of the total energy and energy density

To measure the total energy of ion beam we used infrared imaging diagnostics. The time interval between measurements was 120 s to allow target temperature to equalize between shots. For statistical measurements of the energy density with the time interval of 10 s we developed acoustic diagnostics based on a piezoelectric transducer (Pushkarev et al., Reference Pushkarev, Isakova, Xiao and Khailov2013b). The results of measurements showed that the SD of the energy density at a high repetition rate (5–6 pulses s−1) does not exceed 11%, which is close to that obtained with infrared imaging diagnostics (time interval between measurements is 120 s). The analysis of statistical performance was made with different diodes, as well. The results are summarized in Table 2.
In self-magnetically insulated ion diodes electrons confined by magnetic field drift in crossed E⊥B field along the diode. Electron drift along the diode increases the electron transit time in the gap and thus decreases electronic component of the total current diode providing higher efficiency of ion beam production (Humphries, Reference Humphries1990). The average length of the annulus in the annular diode is 46 cm, which is a factor of 2–2.5 times the length of the planar strip and focusing diodes. This leads to an increase in the transit time of electrons, which makes them drift in the A–C gap for longer in the annular diodes. The increase in the length of the electron drift in the annular diode does not affect its shot-to-shot reproducibility. Studies show that reproducibility of ion current in the planar strip diode is worse than in focusing diode (Pushkarev et al., Reference Pushkarev, Isakova and Khailov2012). However, the reproducibility of total ion beam energy occurred to be much better; see Table 2.
Statistical analysis has shown that the shot-to-shot reproducibility of ion current density is poor (SD of 25–30%), while that for total energy and energy density is much better (SD of 10–11%). If a beam is composed entirely of ions, then variations in energy density must be due to variations in the fluence of ions (or ion current density) and their kinetic energy (or accelerating voltage). Based on this consideration, with a SD of 20–30% for ion current density, and SD of 5–7% for accelerating voltage, the SD of the energy density should be around 25–30%, much higher than the 10–11% found by experiment (see Table 1 for these values). The energy variations must be smoothed out by a factor not accounted for in measurements of ion current density, suggesting the presence of a neutral component in the beam. The obtained results can be explained by the presence of energetic neutral atoms in the beam which are produced though charge exchange processes between accelerated ions and molecules of the residual gas in the A–C gap. The charge exchange process involves the interaction of a high-velocity positive ion with a stationary neutral, with an electron passing from the neutral to the ion; thus the high-velocity ion becomes neutral, and the initially stationary neutral becoming a positive ion (which is then also accelerated). As a result of charge exchange process a flux of energetic neutrals with the energy of 10–50 keV is formed (Pointon, Reference Pointon1989). In double-pulse operation mode of the self-magnetically insulated diode, plasma formation occurs on the first pulse, and acceleration of ions on the second pulse; the presence of a long pause (400–500 ns) between the two can increase the thickness of the neutral layer formed over the anode surface. The greater the number of neutrals, the more charge exchanges will occur when ions are accelerated during the second pulse, thereby increasing the neutral component of the beam. The self-magnetically insulated diode appears to produce a beam composed of both accelerated ions and charge exchange neutral atoms. If the quantity of atoms which can participate in charge exchange process is limited then the charge exchange process will stabilize the reproducibility of the total beam energy. When the total quantity of ions increases, the number of charge exchange acts decreases by one ion and vice versa. The total energy of the accelerated neutrals in the combined beam considerably exceeds the total kinetic energy of ions therefore, the shot-to-shot reproducibility of total beam energy is better than the reproducibility of ion current in the diode.
The duration of the formation of one monolayer on the anode surface is ~1 ms at the pressure in a vacuum chamber being 0.65–6.5 mPa. In Pointon (Reference Pointon1989), it was shown that several monolayers of neutrals can be formed on the anode surface due to earlier adsorption of molecules of residual gas with the areal density, the number of molecules per unit area, thought to be in the range 1015–1016 cm−2. When a high-voltage pulse is applied to the anode and plasma is formed, desorption of these molecules also occurs. The population expands at the rate of 1–2 cm μs−1 so that for 400–500 ns time gap between voltage pulses the concentration of neutral molecules in the gap can reach ≈1016 cm−3. Now, with an accelerating voltage of 250 kV, and ion current density of 30–40 A cm−2, the concentration of ions is ≈1012 cm−3 (Pushkarev et al., Reference Pushkarev, Isakova and Vahrushev2010), which is considerably lower than the density of neutral atoms in the gap. Therefore, acceleration of the gap is inevitably accompanied by intensive charge exchange interaction with neutrals.
4. DETERMINATION OF THE FACTORS AFFECTING THE STABILITY OF ION BEAM GENERATION
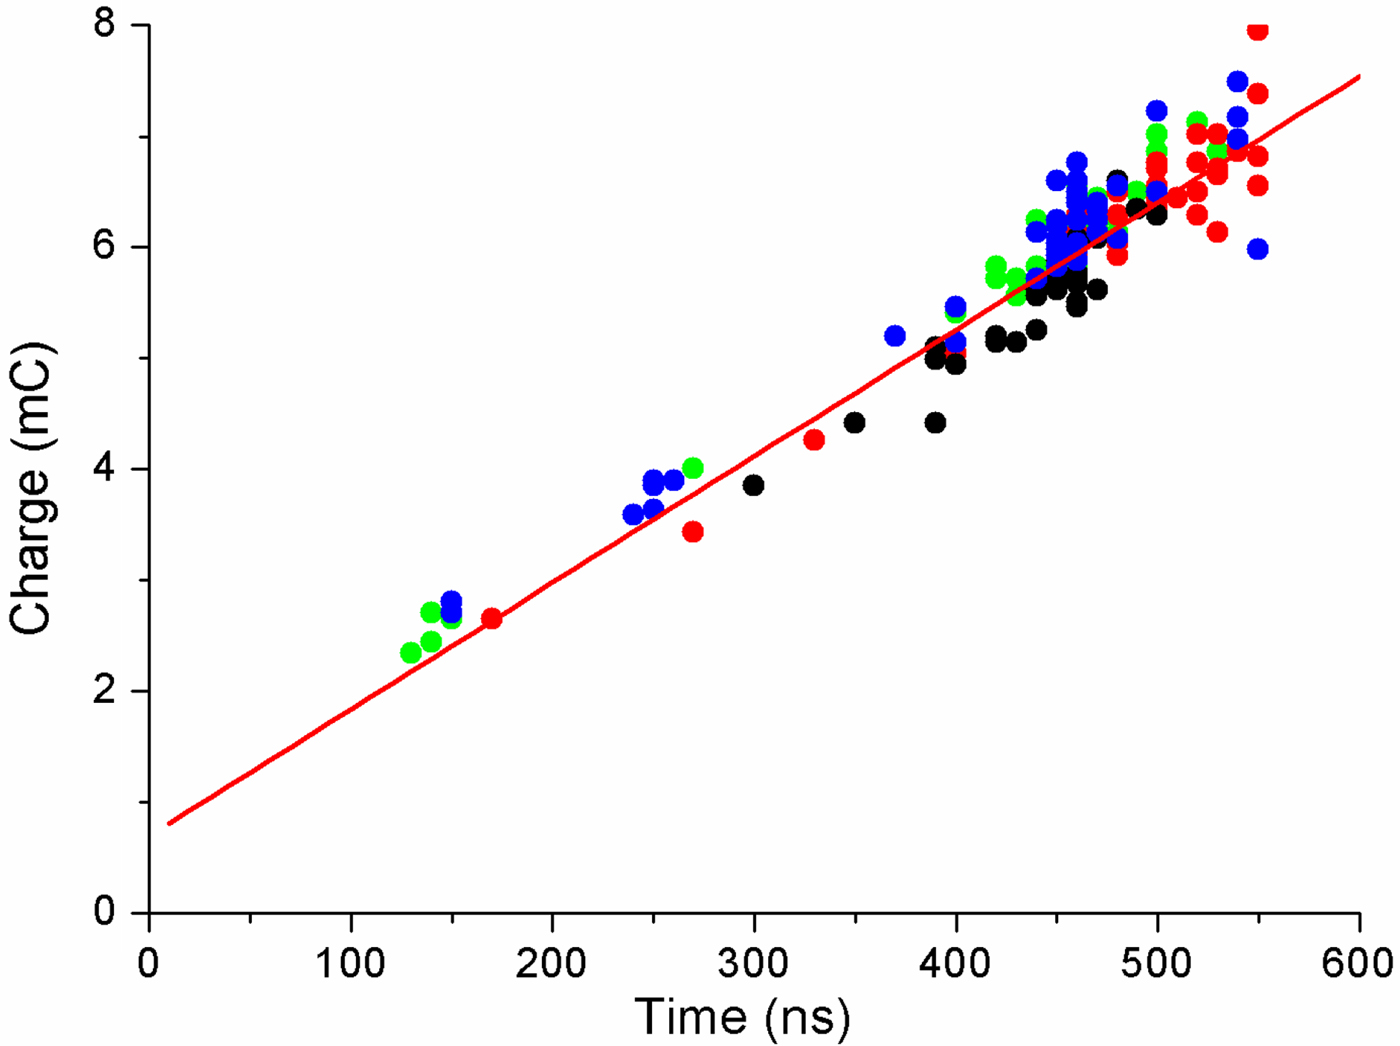
Our observations show high correlation between the energy density (or total beam energy) and total charge transferred in the diode gap during the beam generating pulse (Pushkarev et al., Reference Pushkarev, Isakova and Khaylov2014a). For all examined diodes the relationship between the total beam energy and total charge carried by the beam can be described by the relation E = −35 + 22Q d and fits one line with a SD of 10% at different A–C gap spacing. At the same time a weak correlation exits between measured ion beam energy and calculated beam energy, which depends only on the accelerating voltage and A–C gap spacing (R < 0.02). Therefore, for optimization of the accelerator performance and improvement of beam generation reproducibility we need to increase the stability of total charge (which is integral of total diode current transferred in the diode during the pulse) instead of accelerating voltage.
The studies show excellent correlation between the total charge and the duration of the first voltage pulse for all examined diodes (Fig. 3). Contribution of other factors to reproducibility of total charge is insignificant.
Dependence of the total charge, transferred in the diode on the duration of the first pulse. Summary data for the strip focusing and planar diodes at different gap spacings.
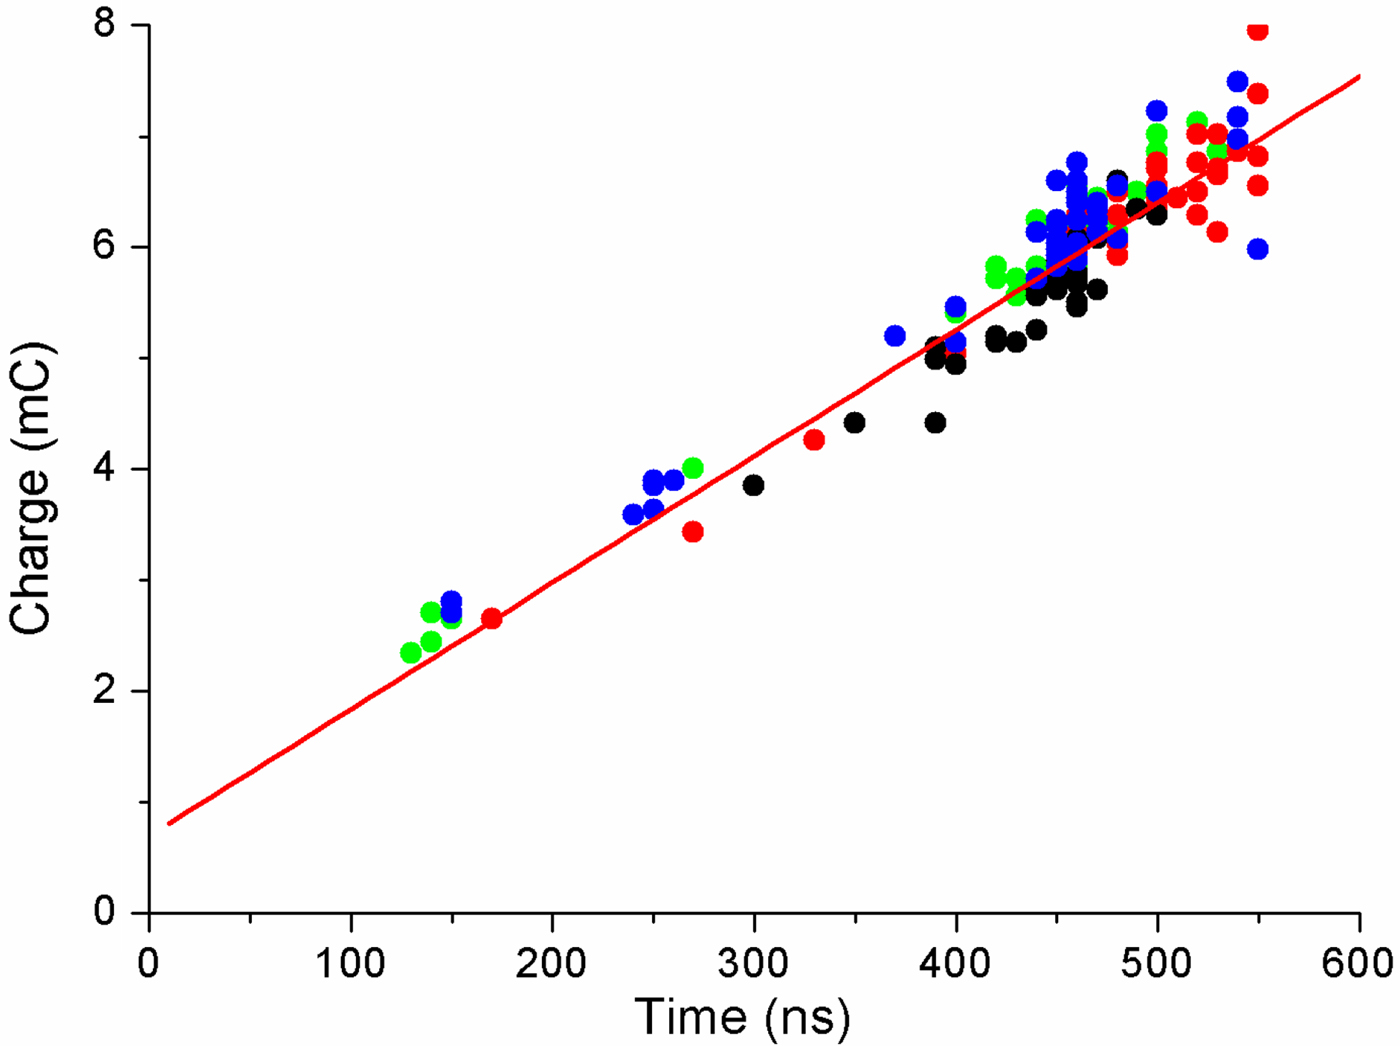
A coaxial bipolar Blumlein has two spark gaps: The main gap and the preliminary gap. During charging of Blumlein, once the voltage at the preliminary spark gap reaches breakdown threshold, it breaks and the capacitance between inner and middle conductor of Blumlein can now charge. The charging occurs through the preliminary spark gap and the diode, which forms the first voltage negative pulse (see. Fig. 1). The second (positive) voltage pulse is formed when the main spark gap breaks down. The shot-to-short stability of first pulse duration is thus strongly affected by the reproducible operation of the spark gaps in Blumlein.
5. IMPROVENT OF STABILITY OF BLUMLEIN OPERATION
We examined statistical performance of Blumlein in both unipolar and bipolar pulse modes with the Blumlein terminated with a resistor or an ion diode. The data from over 100–300 shots was analyzed. The shots were performed in sets of 50, with 10 s between each shot and approximately 5–10 min between each set.
5.1. Self-Triggered Mode of the Spark Gaps
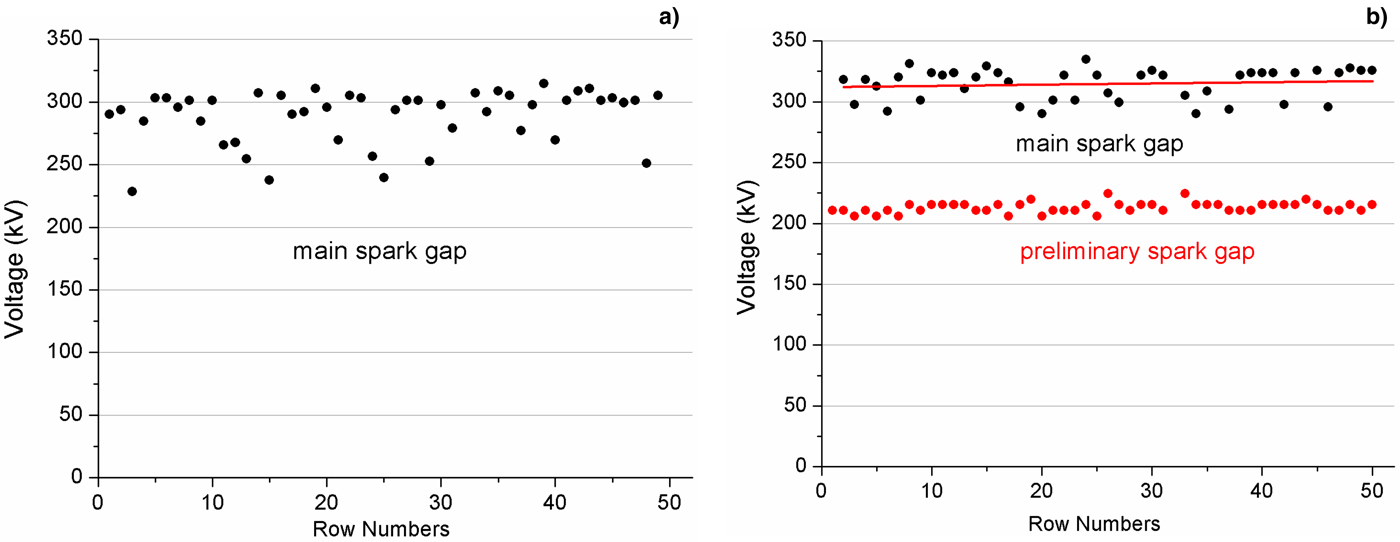
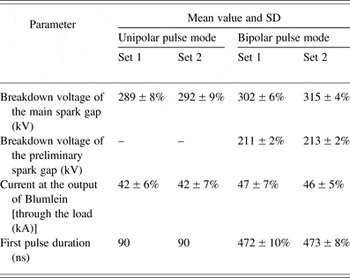
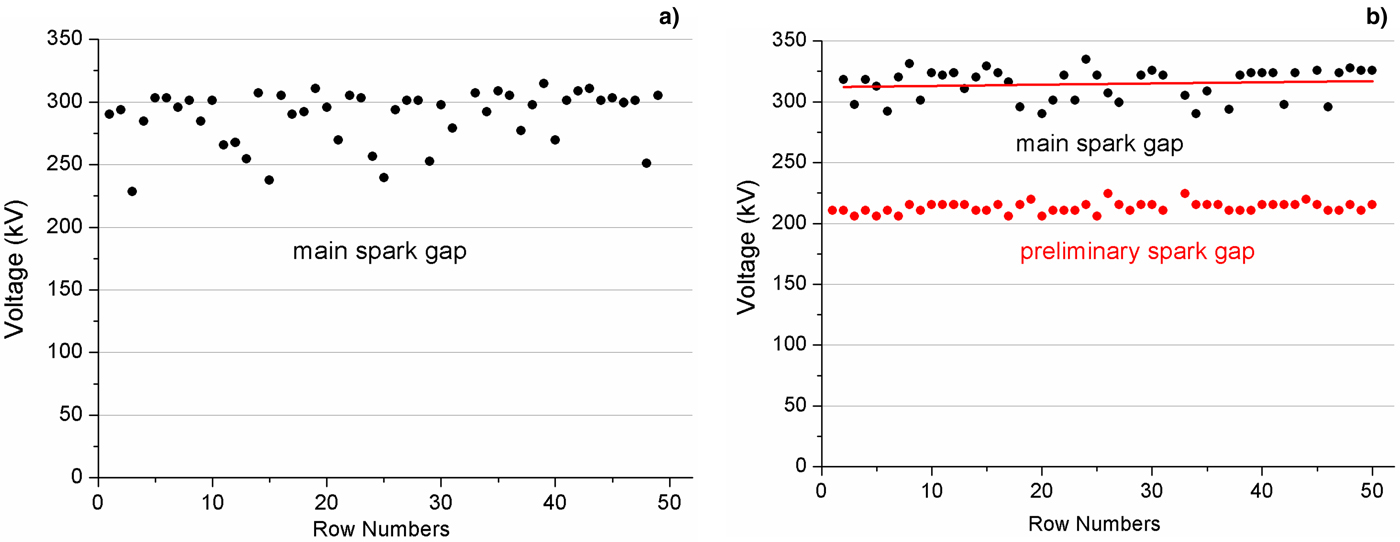
First we analyzed the reproducibility of the electrical parameters when Blumlein was terminated with a matched resistive load of 4.9 Ω. The results of a simple statistical analysis are shown in Figure 4 and summarized in Table 3.
Shot-to-shot variation in the breakdown voltage of the main spark gap and the preliminary gap operating in unipolar-pulse (a) and bipolar pulse (b) mode.
Statistical analysis of the electrical parameters for Blumlein when operating with a matched resistive load

The analysis showed a fairly stable shot-to-shot operation of the preliminary gap when Blumlein is operated in bipolar pulse mode with a SD in breakdown voltage not exceeding 2%. At the same time a SD in breakdown voltage of the main gap is much higher (SD of up to 9%) in both unipolar pulse and bipolar pulse operating modes (see Fig. 4). Both gas spark gaps have similar design, equal gap spacing between the electrodes and operate with the same gas which was nitrogen. A possible reason for a more stable operation of the preliminary gap is the limitation of the rise time of the current to about 5 × 10¹¹ А s−1 which is strongly affected by the impedance of the external circuit (impedance of the diode or resistive load). The main spark gap is located so that after triggering it is connected to the ground eliminating the influence of the impedance of the external circuit and operating at the current rise time of (2–3) × 1012 А s−1. The total charge transferred in the main spark gap was 8–9 mC.
Our observations show that a large value of the gap current of up to 100 kA causes a severe erosion of the electrode surface. The small defects that project out of the surface of the electrode increase the electric field strength in the discharge gap and may cause a considerable variation in breakdown voltage from shot-to-shot (Pushkarev et al., Reference Pushkarev, Isakova and Khaylov2014b). To improve the shot-to-shot repeatability of the breakdown voltage we designed the electrodes with the insertions made from tungsten–copper alloy. In another design of the main spark gap the surface of the potential electrode was textured with concentric grooves. However, our observations show that the change in the electrode design does not allow for a significant improvement in the shot-to-shot performance of the main spark gap; the SD in breakdown voltage for a set of 200–300 shots was 4–6%.
5.2. Externally Triggered Mode of the Main Spark Gap
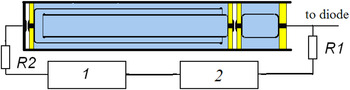
The experiments showed a fairly stable operation of the preliminary spark gap in bipolar pulse mode, therefore the signal at the output of the Blumlein, once the preliminary spark gap is triggered, can be used to externally trigger the main spark gap. In these experiments, the voltage signal at the output of Blumlein was transferred through a coaxial cable to the trigger electrode, which was located at the grounded electrode of the trigatron spark gap. Figure 5 shows the schematic of external triggering of the trigatron type main spark gap.
The schematic of the trigger pulse formation for external triggering of the main spark: R1 and R2 – resistance of a voltage divider and a resistance limiting the current though the discharge gap, respectively; 1 – transformer; 2 – a cable used for the formation of a delay time between formation of a trigger pulse and arrival of this pulse to the trigger electrode of the trigatron spark gap.

The voltage divider consisting of a resistance R1 and a wave impedance of the cable (50 Ω) was used to reduce the voltage signal at the output of Blumlein to 40–50 kV. A 3 mm trigger electrode was installed in the center of the grounded electrode of the main gap. With the distance between the main electrodes of 10 mm the gap spacing between the trigger electrode and the adjacent grounded electrode was 2 mm.
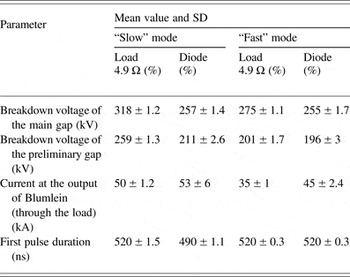
A required delay time between formation of a trigger pulse and arrival of this pulse to the electrode of the trigatron was achieved by changing the length of the cable 2 (Fig. 5). The experiments performed with the main spark gap operated in externally triggered mode showed a better shot-to-shot reproducibility in breakdown voltage and the duration of the first pulse. Table 4 summarizes the results of a statistical analysis of Blumelein operation on a matched resistive load when the main spark gap is operated in externally triggered mode (trigatron-type spark gap, without transformer). Table 4 shows average values for 4–5 sequent sets, 50 pulses in each set.
Statistical analysis of the electrical parameters for Blumlein when operating in externally triggered mode of the main spark gap

The studies showed good reproducibly of the breakdown voltage of the main spark gap (in externally triggered mode) and duration of the first pulse. However, the trigatron operation mode did not decrease the shot-to-shot variations in the total diode current and hence the total charge carried in the A–C gap during ion beam generation. In addition, we observed a severe erosion of the triggering electrode when the main spark gap was triggered by negative polarity pulse (without transformer). After 500–1000 pulses it was required to adjust the gap spacing between the triggering electrode and the ground electrode of the main spark gap.
5.3. A “Fast” Breakdown Mode of the Spark Gap Operation
A survey of scientific and engineering literature on the subject allows us to distinguish two main mechanisms responsible for the initiation of the triggering breakdown in trigatron: A “slow” breakdown and a “fast” breakdown. The “slow” mode is initiated by an igniting spark in the gap between the triggering electrode and the grounded electrode of the main gap. In this mode, the delay in trigatron breakdown usually does not exceed 1 ms with a time jitter of 100 ns. With the “fast” mode the breakdown delay and its time jitter are significantly smaller (Boyko et al., Reference Boyko, Evdoshenko, Zarochentsev and Ivanov2009).
The study shows that when the main gap is triggered by a voltage pulse of negative polarity (without transformer 1, see Fig. 5) a so called “slow” mode of initiation of triggering breakdown is realized. According to this mode the initiation of the triggering mechanism is attributed to effect of the trigger spark that forms between the trigger electrode and the adjacent electrode. The time delay before breakdown of the gap between two main electrodes of the trigatron was found to be 25–30 ns with the time jitter of 10–15 ns. Changing the polarity of the trigger pulse will make it possible to realize a “fast” mode of triggering mechanism and additionally improve shot-to-shot reproducibility of the breakdown voltage.
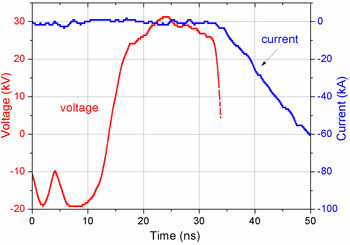
To change the polarity of the triggering pulse in trigatron we used a transformer with a core made of permalloy tape (see Fig. 5). The primary and secondary windings of the transformer were made with a high-voltage wire, with equal number of turns in two windings being eight. Figure 6 shows the waveform of the triggering pulse after inversion.
Waveforms of triggering pulse after inversion and switching current of the main gap.

The cross-section of the core in the transformer was determined by the required value of magnetic induction in the core material ΔВ and the flux linkage V·t (volts – seconds). It was defined as:
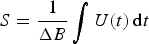 $$S = \displaystyle{1 \over {\Delta B}}\int {U(t)\,{\rm d}t} $$
For data presented in Figure 6 the integral of voltage is 4.4 × 10⁻⁴ V s−1. For permalloy tape the saturation induction is more than 4 T, so for normal operation of the transformer the core with cross-section of 1.2 cm−2 is sufficient. Due to short pulse duration we ensure no breakdown of the transformer in the air without additional oil insulation.
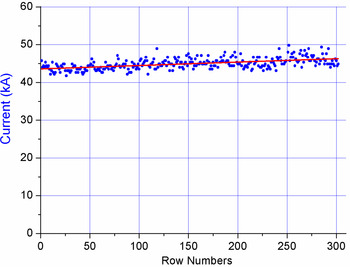
When the main spark is triggered by a positive polarity pulse the SD of total current was reduced from 6.8% to 2.5–3% (see Fig. 7). With the increase in the number of shots the temperature of the gas between the electrodes of the switch and, consequently, the pressure increases which leads to a slight rise in the breakdown voltage of the preliminary spark gap and, consequently to an increase in the breakdown voltage of the main gap and total diode current.
Shot-to-shot variation in the total diode current. Data for a flat strip diode, six sets with 50 pulses in each set.

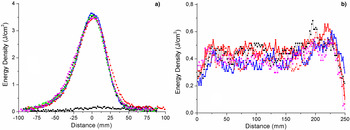
Externally triggered mode of the main spark gap increases stability of the diode operation. Figure 8 shows the distribution of the energy density in the cross-section of the beam, formed by different diodes.
Distribution of the energy density formed by a focusing diode (a) and planar (b) diodes. Data presented for five consecutive pulses.

6. CONCLUSION
We have performed complex statistical studies of ion beam generation in self-magnetically insulated diodes of different design. It was found that shot-to-shot variation of total energy and energy density is low, with SD not exceeding 10–12%. Increase in pulse repetition rate up to 5–6 pulses min−1 did not affect the stability of beam generation, as it is considerably higher than in diodes of different type – externally applied magnetically insulated diodes, operated in single pulse mode. This can be explained by a more effective (compared with diodes with external magnetic field) charge exchange interaction between accelerated ions and stationary molecules of residual gas in the anode–cathode gap. Thus, the ion diode with self-magnetic insulation in double-pulse mode appears to generate a combined beam consisting of accelerated ions and accelerated neutral atoms, which are formed as a result of charge-exchange process. By analogy with the term “plasma with a low degree of ionization”, in our case, an intense energy flow (ions + accelerated neutrals) can be called an intense ion beam.
The experiments showed a high correlation between the energy density (total beam energy) and the total charge transferred in the diode during beam generation. This charge is mainly affected by the duration of the first voltage pulse. The contribution of other factors in poor reproducibility of the total charge is negligible.
In the TEMP-4M accelerator, the duration of first voltage pulse is determined by the delay in breakdown of the main spark gap relative to the moment of breakdown of the preliminary gap. To increase the stability of the first pulse duration (in double-pulse mode) the first voltage pulse at the output of Blumlein was used to trigger the main spark gap. Our studies showed a better reproducibility of the first pulse duration, with the time jitter not exceeding 5–8 ns in a set of 50 pulses.
To improve the reproducibility of the first pulse duration (when the main spark gap was operated in self-breakdown mode) the self-breakdown voltage of the main gap was set to a level of 0.7–0.8 from the maximum voltage at the output of the Marx generator. Concurrently, change in breakdown voltage in 4–5% resulted in change in the first pulse duration in 6–7% (see Tables 1 and 2). The energy stored in the Marx generator was 4–5 kJ, while the energy stored in Blumlein was 1.2 kJ. Utilization of the externally triggered mode of the main spark gap also allowed for a decrease in the charging voltage of the Blumlein to a 0.9–0.95 of self-breakdown voltage of the main spark gap while the energy stored in Marx generator was decreased from 4 to 2.5 kJ. At the same time the energy stored in Blumlein remained the same. It increased the stability of accelerator operation and its service life.
The combination of long service life of diode with explosive emission cathodes (>106 pulses), good shot-to-shot reproducibility, simplicity of design, and configuration makes the diode with self-insulation very promising for industrial applications.
ACKNOWLEDGEMENTS
This research was supported by the grant for scientific research “Science” from the Ministry of Education and Science of Russia, project No. 2159.