


Introduction
Compared to most other habitats, a loaded grain silo constitutes a uniform and unlimited food source, which is relatively well protected against diurnal and seasonal fluctuations in weather conditions (Nansen et al., Reference Nansen, Flinn, Hagstrum, Toews and Meikle2009). This is a unique man-made enclosed ecosystem, which may host a wide variety of arthropods and fungi (Barak & Harein, Reference Barak and Harein1982; Subramanyam & Harein, Reference Subramanyam and Harein1990; Hagstrum et al., Reference Hagstrum, Flinn and Subramanyam1998; Buchelos & Athanassiou, Reference Buchelos and Athanassiou1999; Athanassiou & Buchelos, Reference Athanassiou and Buchelos2001; Athanassiou et al., Reference Athanassiou and Buchelos2001, Reference Athanassiou, Kavallieratos, Palyvos and Buchelos2003, Reference Athanassiou, Kavallieratos, Palyvos, Sciarretta and Trematerra2005; Nansen et al., Reference Nansen, Phillips and Palmer2004a; Toews et al., Reference Toews, Phillips and Payton2005). Insect communities in bulk grain can be sampled using either direct or indirect sampling techniques (Subramanyam & Hagstrum, Reference Subramanyam, Hagstrum, Subramanyam and Hagstrum1995). Direct sampling in grain is based on collecting a known volume of grain, typically around 1 kg (Hagstrum et al., Reference Hagstrum, Flinn and Subramanyam1998; Athanassiou & Buchelos, Reference Athanassiou and Buchelos2001; Toews et al., Reference Toews, Phillips and Payton2005) or larger samples (Flinn et al., Reference Flinn, Hagstrum, Reed and Phillips2004; Perez-Mendoza et al., Reference Perez-Mendoza, Flinn, Campbell, Hagstrum and Throne2004; Flinn et al., Reference Flinn, Opit, Throne, Mancini, Carvalho, Timlick and Adler2008; Nansen et al., Reference Nansen, Flinn, Hagstrum, Toews and Meikle2009). This method provides detailed information about insect density at a given time (when the sample was collected), but it is quite labour intensive and not always practically feasible. Indirect sampling is based on the use of baited or unbaited traps; and, in bulk-stored grain, unbaited perforated probe or pitfall traps with manual counting of insects captured are widely used (Subramanyam & Harein, Reference Subramanyam and Harein1990; Subramanyam & Hagstrum, Reference Subramanyam, Hagstrum, Subramanyam and Hagstrum1995; Vela-Coiffier et al., Reference Vela-Coiffier, Fargo, Bonjour, Cuperus and Warde1997; Hagstrum et al., Reference Hagstrum, Flinn and Subramanyam1998; Buchelos & Athanassiou, Reference Buchelos and Athanassiou1999; Athanassiou & Buchelos, Reference Athanassiou and Buchelos2001; Toews et al., Reference Toews, Phillips and Payton2005). Generally, low insect densities are detected earlier with probe traps than when the monitoring of grain insects is based upon direct sampling (Subramanyam & Harein, Reference Subramanyam and Harein1990; Subramanyam & Hagstrum, Reference Subramanyam, Hagstrum, Subramanyam and Hagstrum1995; Hagstrum et al., Reference Hagstrum, Flinn and Subramanyam1998; Buchelos & Athanassiou, Reference Buchelos and Athanassiou1999). In addition, probe trap captures may detect the presence of insect species that, at low densities, may go undetected in grain samples (Athanassiou & Buchelos, Reference Athanassiou and Buchelos2001; Nansen et al., Reference Nansen, Phillips and Palmer2004a; Toews et al., Reference Toews, Phillips and Payton2005).
Apart from insect pests, the stored grain ecosystem encompasses predators and parasitoids (White, Reference White, Jayas, White and Muir1995). There are several studies describing the seasonal occurrence of natural enemies in stored grain (Parajulee & Phillips, Reference Parajulee and Phillips1995; Johnson et al., Reference Johnson, Valero, Hannel and Gill2000; Eliopoulos et al., Reference Eliopoulos, Athanassiou and Buchelos2002; Nansen et al., Reference Nansen, Phillips and Palmer2004a; Athanassiou & Saitanis, Reference Athanassiou and Saitanis2006), but little is known about the density-dependent and spatial relationships between these species and their hosts under field conditions. Both direct and indirect sampling traps and grain samples can be used for the detection of parasitoids in bulked grains (Eliopoulos et al., Reference Eliopoulos, Athanassiou and Buchelos2002; Nansen et al., Reference Nansen, Phillips and Palmer2004a). In the case of parasitoids, adults are more prone to be detected by using direct sampling techniques, while immatures are found inside their hosts.
An important aspect of insect monitoring is to have analytical procedures to convert acquired monitoring data into user-friendly recommendations to be used by stored-grain managers. Several studies have suggested that indirect sampling data of grain insects are not always well correlated with actual population densities (Subramanyam & Hagstrum, Reference Subramanyam, Hagstrum, Subramanyam and Hagstrum1995; Vela-Coiffier et al., Reference Vela-Coiffier, Fargo, Bonjour, Cuperus and Warde1997; Hagstrum et al., Reference Hagstrum, Flinn and Subramanyam1998; Athanassiou & Buchelos, Reference Athanassiou and Buchelos2001), which obviously makes it challenging to interpret probe trap captures. Other studies have, with varying success, examined to what extent counts of insects in probe traps were correlated with abiotic conditions, such as grain temperature (Hagstrum et al., Reference Hagstrum, Flinn and Subramanyam1998; Toews & Phillips, Reference Toews and Phillips2002; Arbogast et al., Reference Arbogast, Weaver, Kendra and Chini2004; Toews et al., Reference Toews, Phillips and Payton2005). Apart from detection of insect infestations in stored grain at low densities, it may also be of importance to have a monitoring system that can reliably characterize the spatial distribution of insects. For quantitative studies on spatial distribution patterns of insects, SADIE (Perry, Reference Perry1995) has been used extensively and has also been applied to counts of stored grain insects (Nansen et al., Reference Nansen, Phillips and Palmer2004a,Reference Nansen, Phillips, Parajulee and Franquib; Athanassiou & Saitanis, Reference Athanassiou and Saitanis2006). However, most data sets of insects in stored grain are fairly small (<30 data points) and SADIE analyses have most commonly indicated random spatial distribution patterns. Despite an apparently random spatial distribution pattern, the same counts may still be considered significantly aggregated if a non-spatial frequency distribution analysis is applied using, for instance, Taylor's Power Law (Taylor, Reference Taylor1961) or Lloyds index of aggregation (Lloyd, Reference Lloyd1967).
In this study, we evaluated spatial and non-spatial analytical procedures and discuss their usefulness in a practical context. Bulk-stored barley was sampled in two ways: direct sampling based on grain trier samples and indirect sampling based on probe trap captures; and four aspects were addressed: (i) differences in insect counts when based on direct and indirect sampling, (ii) usefulness of grain temperature and moisture content as explanatory variables for insect densities, (iii) density-dependent relationships between natural enemies and their hosts, and (iv) aggregation analyses based on spatial and non-spatial methods.
Materials and methods
Storage facility and insect sampling
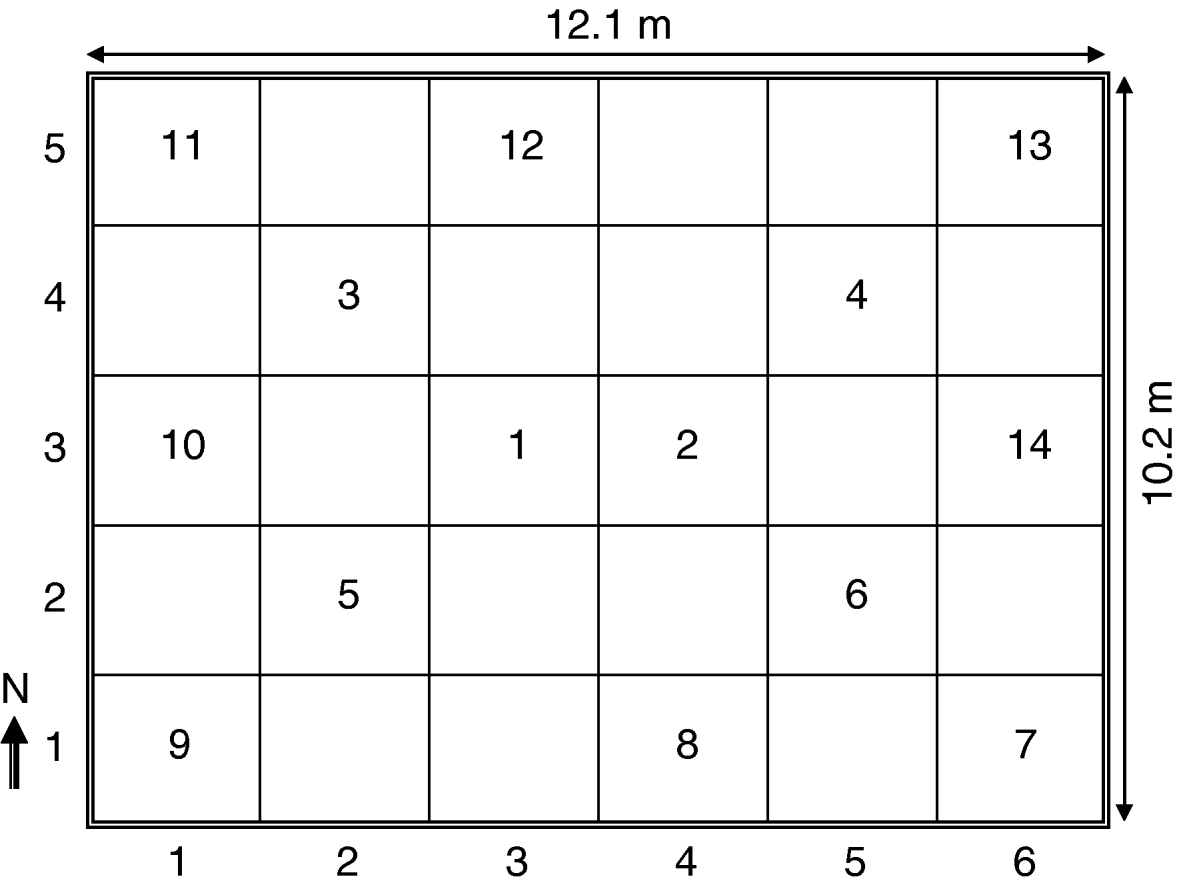
The study was carried out in a 10.2 m by 12.1 m storage facility located in Thessaly in central Greece. The storage facility had one closed door and two windows covered with tin foil. On June 2, 1998, approximately 90 tons of newly-harvested barley (var. Persephone) was loaded into the storage facility and arranged to an even depth of about 2 m. No insecticidal treatments took place before or during the sampling period. The storage facility was divided into a regular grid with 14 sampling quadrats (fig. 1), which were sampled at 15 consecutive sampling events in 15-day intervals (until 30 January 1999). For each sampling event, probe traps (WBII grain probe, Trece, Adair, OK, USA) were serviced; and two 750 g grain samples were collected with a home-made non-partitioned grain trier. One grain trier sample was used for insect identification, while the second sample was used to measure moisture content (Dickey-John Multigrain CAC II, Dickey-John Co., USA). Also, during each sampling event, a 45-cm thermidor probe thermometer (Digital Probe Thermometer TFA, Germany) was inserted into the grain mass at each sampling point to measure grain temperature. Insect counts were expressed in terms of dominance, which is the percentage of individuals of a given species of the total number of individuals, and frequency, which is the percentage of samples in which a given species was found (Athanassiou & Buchelos, Reference Athanassiou and Buchelos2001).
Store dimensions and position of the sampling quadrats.
Abiotic analysis
Counts of the six most abundant species (table 1) were included in regression analyses to determine to what extent probe trap captures, grain moisture content and grain temperature could be used as explanatory variables for insect population densities in grain samples. The response surface regression procedure (PROC RSREG) in PC-SAS/STAT 8.00 for Windows (SAS Institute, Cary, NC, USA) was used with insect number per kg as the dependent variable and with one of three separate sets of explanatory variables: (i) probe trap captures alone; (ii) grain moisture content (%) and temperature (°C); and (iii) probe trap captures, grain moisture content and temperature. Dependent insect variables were analyzed either as absolute numbers or as a dichotomous (presence/absence) variable with 0=no insects found in grain samples and 1=insects found. With 15 sampling events and 14 sampling quadrats, each regression analysis was based upon 210 observations. PROC RSREG examines linear and quadratic effects and linear interactions of independent variables. Further details on the use of the response surface regression procedure are available in Freund & Littell (Reference Freund and Littell1991). The regression approach used in this study is similar to that used in other studies of stored grain insects (Nansen et al., Reference Nansen, Korie, Meikle and Holst2001, Reference Nansen, Bonjour, Gates, Phillips, Cuperus and Payton2004c, Reference Nansen, Flinn, Hagstrum, Toews and Meikle2009), and the advantage of PROC RSREG (compared to other regression procedures in SAS) is that it calculates the overall contribution of each explanatory variable (combining linear and quadratic effects and linear interactions).
Insect taxa found in probe trap samples and grain trier samples (dominance, frequency and mean number of individuals/trap or sample±SE; <0.1 indicated that too few individuals were found).

Domin. (dominance), % of the number of individuals; freq. (frequency), % of the number of samples.
Natural enemies and their hosts
The above-mentioned PROC RSREG procedure was also used to conduct regression analyses in which the following explanatory variables were used to explain counts of natural enemies: counts of hosts, time of sampling (week numbers from 1–14), and grain moisture content and grain temperature. Response surface regression analyses of probe trap captures and grain samples were conducted separately. For each natural enemy, only relevant hosts were used as explanatory variables: Venturia canescens (Gravenhorst) (Hymenoptera: Ichneumonidae) and Harbobracon hebetor (Say) (Hymenoptera: Braconidae) are parasitoids of stored product moths; Anisopteromalus calandrae (Howard) (Coleoptera: Pteromalidae) and Lariophagus distiguentus (Förster) (Hymenoptera: Pteromalidae) are parasitoids of internal feeding beetles (such as Sitophilus oryzae (L.) (Coleoptera: Curculionidae) and Rhyzopertha dominica (L.) (Coleoptera: Bostrychidae)), and Holepyris sylvandis Brèthes (Hymenoptera: Bethylidae) is a parasitoid for external feeding beetles (such as Tribolium castaneum (Herbst) (Coleoptera: Tenebrionidae), Oryzaephilus surinamensis (L.) (Coleoptera: Silvanidae) and Cryptolestes ferrugineus (Stephens) (Coleoptera: Cucujidae)) (Brower et al., Reference Brower, Smith, Vail, Flinn, Subramanyam and Hagstrum1995).
Spatial analysis
For each sampling event, we used the Spatial Analysis by Distance IndicEs (SADIE) procedure (Perry, Reference Perry1995) to characterize spatial distribution patterns of the six most abundant insect species. SADIE is used to compute the likelihood of insect counts being significantly spatially aggregated by comparing the observed level of aggregation, I a, with that of random re-distributions of data points. I a is a measurement of aggregation and represents an estimate of ‘effort’ of bringing a given spatial distribution pattern to a completely even/uniform distribution. As part of the spatial analysis, we conducted separate SADIE analyses after having re-arranged an existing spatial distribution pattern of C. ferrugineus individuals in grain trier samples. Two types of re-arrangements were evaluated; but, in all re-arrangements, the total count of insects was kept constant, by aggregating insect densities even further or by re-positioning existing insect counts.
Non–spatial analysis
For each of the six most abundant insect species, we calculated Lloyd indices (Lloyd, Reference Lloyd1967), IL, as a measurement of aggregation of insects in grain samples (Hurlbert, Reference Hurlbert1990). The IL index can assume values from 0 to +∞“ and equals 1.0 for random distributions and increases with the level of aggregation. Data for each of the six beetle pests were only included if >3 individuals of a given species had been collected in that sampling event. Analysis of variance was used to compare Lloyd indices among species and sampling methods.
Results
Comparison of sampling techniques
A total of 7040 individuals were found in grain trier samples and probe traps represented by 22 insect taxa in three orders. Dominance and frequency for each species captured are shown in table 1. Thirteen of the species found represented <1% of total counts, while the two most abundant species, S. oryzae and C. ferrugineus, combined represented about 42% of total insects found. Both number of species (fig. 2a) and total number of insects (fig. 2b) captured in each sampling event were consistently higher in probe traps than in grain trier samples. Three species, V. canescens, L. distiguentus and Lathridius minutus (L.) (Coleoptera: Lathrididae), were only found in the probe traps samples. Dominance of the species found varied slightly between sampling methods. For instance, in probe traps, C. ferrugineus, T. castaneum and Ephestia kuehniella Zeller (Lepidoptera: Pyralidae) constituted a much higher proportion than in grain trier samples. Conversely, in grain trier samples especially, counts of Plodia interpunctella (Hübner) (Lepidoptera: Pyralidae) and R. dominica were comparatively more abundant. Regarding their frequency, we also found some difference between the two sampling methods as, on average, insect species were found to be almost five times more frequent in probe trap samples than in grain trier samples. For instance, C. ferrugineus individuals were present in about 50% of probe trap catches, while they were only found in about 17% of grain trier samples; and A. calandrae were present in 25% of probe trap catches but only in 2% of grain trier samples.
The time course of (a) species richness and (b) number of individuals monitored in a wheat bulk by using two sampling methods, from 15 June 1998 to 30 January 1999 (- - -◆- - -, probe traps; - - -▪- - -, trier samples).

Abiotic analysis
Grain temperatures and moisture contents varied considerably both within and between sampling events. Temperature exhibited a linear decline from June (30.4±0.4.) to January (11.3±1.3), while moisture content at the same period remained relatively constant (11.3±0.4). Using multi-regression analyses, we found that the full model with the three explanatory variables generated significant model fits to counts of all six insect species, both when the response variable was absolute numbers (table 2) and as presence/absence (table 3). For all six insect species, probe trap captures was a better explanatory variable than the combination of grain moisture content and temperature. Also, for all six insect species, the best model fits were obtained when using absolute numbers as response variable. Despite obtaining significant model fits, coefficients of determination (R2-values) were low (0.05–0.08) for model predictions of densities of T. castaneum and E. kuehniella. The combination of grain moisture content and temperature as explanatory variables only produced reasonably good model fit to counts of C. ferrugineus. Regarding full models, R2-values ranging from 0.25–0.36 were obtained for three species, C. ferrugineus, R. dominica and S. oryzae, which means that all examined model fits were associated with considerable uncertainty.
Regression analysis of absolute numbers of insects in grain samples.
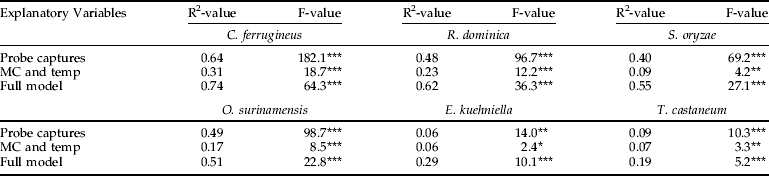
Three different response surface regression models were conducted for each insect species with either: (i) probe trap captures as only explanatory variable, (ii) grain moisture content (MC) and grain temperature (temp) as explanatory variables, or (iii) full model with all three explanatory variables.
Statistical significance of each regression model (N=210) was determined with *, P<0.05; **, P<0.01; ***, P<0.001.
Regression analysis of presence/absence insect counts in grain samples.
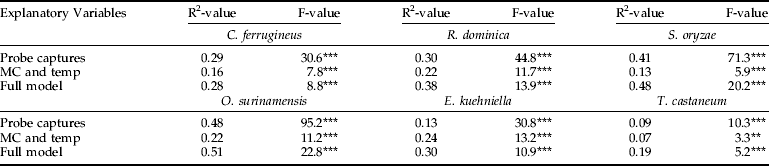
Three different response surface regression models were conducted for each insect species with either: (i) probe trap captures as only explanatory variable, (ii) grain moisture content (MC) and grain temperature (temp) as explanatory variables, or (iii) full model with all three explanatory variables.
Statistical significance of each regression model (N=210) was determined with *, P<0.05; **, P<0.01; ***, P<0.001.
Natural enemy and their hosts
The number of grain samples containing natural enemies and their relative abundance were quite low, which probably explains why we generally obtained low R2-values (table 4). For H. hebetor and A. calandrae, insect counts were considered frequent and high enough for a separate analysis of the relationship between probe trap captures and their occurrence in grain samples. In the analysis of H. hebetor counts, the three explanatory variables in the full model (abiotic conditions and grain sample counts) provided a significant fit with 84% of the explained variance by the model being attributed to H. hebetor counts in grain samples. For A. calandrae, we found that the full model provided a highly significant model fit to probe trap captures with 97% of the explained variance by the model being attributed to A. calandrae counts in grain samples. Only in one of the model fits (H. hebetor) did any of the hosts (E. kuehniella) contribute significantly to the model fits. Conversely, grain moisture content contributed significantly to models of both H. hebetor and A. calandrae. Regarding V. canescens and H. sylvanidis none of the full models provided significant fits (P>0.05). The same model exercise was performed using occurrence of natural enemies and their hosts in probe trap captures; and, in four of the five models, the combination of explanatory variables provided significant fits (table 5). Examination of probe trap captures revealed that abundance of H. hebetor could be modelled and that, in particular, the abundance of P. interpunctella, week number, temperature and moisture content contributed to the significant model fit. With probe trap captures of V. canescens both low and rare (table 1), it was not surprising that the examined model fit of these wasps was non-significant. In the model fit of probe trap captures of A. calandrae, the two host species did not contribute significantly to the model fit, as the significant model fit was mainly attributed to time of sampling and grain temperature. Similarly, the occurrence of L. distinguentus in probe trap captures was only loosely explained by the occurrence of its hosts, while grain temperature appeared to be the most important explanatory variable. Regarding probe trap captures of H. sylvanidis, we obtained a highly significant model fit, which was mainly attributed to the abundance of its three hosts: O. surinamensis, T. castaneum and C. ferrugineus.
Regression analysis of occurrence of natural enemies in grain samples.
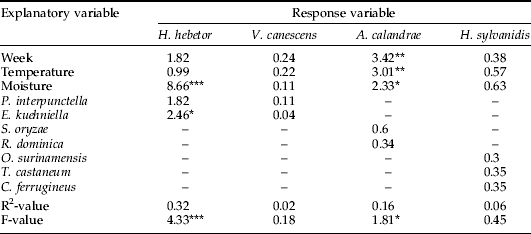
Values inside the table denote F-values, which reflect the relative contribution of explanatory variables to each model fit.
Statistical significance of each regression model was determined with *, P<0.05; **, P<0.01; ***, P<0.001. –, indicate that the explanatory variable was excluded from the model fit.
Regression analysis of occurrence of natural enemies in probe trap captures.
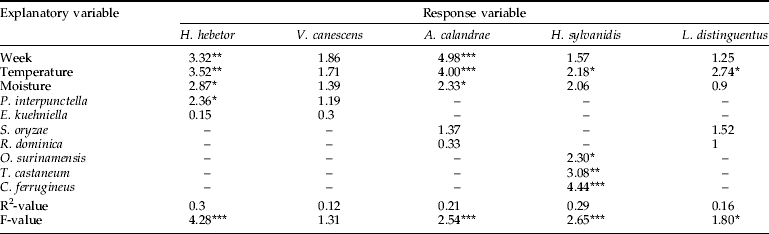
Values inside the table denote F-values, which reflect the relative contribution of explanatory variables to each model fit.
Statistical significance of each regression model was determined with *, P<0.05; **, P<0.01; ***, P<0.001. –, indicate that the explanatory variable was excluded from the model fit.
Spatial analysis
For each of the six most abundant insect species, we conducted SADIE analyses of all sampling events with each sampling method (equal to 270 separate analyses). Even though about 60–80% of insect counts from a given sampling event were sometimes found in one of the 14 sampling quadrats, none of the distribution patterns, for any combination of insect species sampling method and sampling event, could be considered significantly spatially aggregated (P>0.05). As an example, table 6 shows probe trap captures of C. ferrugineus individuals in the sampling event of 15 October. A total of 169 beetles were caught, about 64% (109 of 169) of the beetles were found in a single trap, and six of the 14 traps caught no C. ferrugineus individuals. Despite this relatively extreme aggregation, the SADIE analysis revealed that there was about 21% chance of obtaining an equally spatially aggregated distribution pattern by random. For analytical purposes, we investigated this further by re-arranging the existing data in two separate ways: either by aggregating insect counts on the locations that already had the highest captures (arrangements 1–4) or by repositioning existing captures (arrangements 5–7). This analysis revealed that with highest probe trap captures in the centre (which was the observed pattern), as many as 160 of the 169 beetles (95%) would have to be captured in the central trap to obtain a significantly aggregated spatial distribution (arrangement 4). However, a significantly aggregated spatial distribution pattern was found with the actual trap captures, if they were re-arranged in such a way that the ‘hot spot’, accounting for about 64% of captures, was located along the periphery of the sampling space (arrangement 7). Thus, this re-arrangement exercise illustrated that the statistical outcome of SADIE analyses of a fairly small data set (14 sampling points) may be quite sensitive to where, within a given sampling space, the highest insect counts occurs.
Observed and re-arranged surface probe trap captures of Cryptolestes ferrugineus in the sampling event of 15 October.
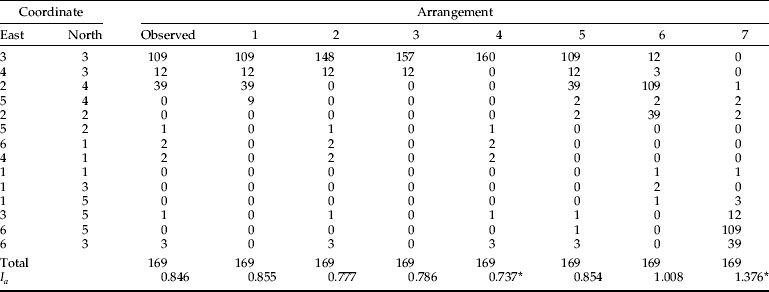
Asterisk (*) denotes a significantly aggregated spatial distribution pattern (P<0.05). I a is a measurement of aggregation and it is calculated as part of SADIE analysis. It represents an estimate of ‘effort’ of bringing a given spatial distribution pattern to a completely even/uniform distribution.
Non-spatial analysis
As SADIE analyses suggested random spatial distribution patterns for all six species in all sampling events with both sampling methods, we examined the level of aggregation based on the IL index, which can be considered a measurement of non-spatial aggregation, rather than spatial aggregation. In grain samples, there was a significant difference in IL indices among species (F=5.7, df=5.79, P<0.001) (fig. 3a). All species had average IL indices higher than 2, but the level of non-spatial aggregation of P. interpunctella was significantly lower than that of S. oryzae, C. ferrugineus and T. castaneum. There were also significant differences in IL indices among species when based upon probe trap captures (F=6.7, df=5.54, P<0.001) (fig. 3b), but the results were markedly different from those obtained from grain trier samples. Using probe trap captures, the two pyralid moths and T. castaneum showed very low level of non-spatial aggregation, while S. oryzae and C. ferrugineus showed the significantly highest levels of non-spatial aggregation. We also conducted pairwise comparisons of IL indices obtained with the two different sampling methods and showed that there was significant difference for E. kuehniella and T. castaneum (P<0.01), while there were no significant differences for the other four insect species (P>0.05).
Non-spatial Lloyd index of aggregation, IL (mean+SE) calculated for insect counts in (a) grain samples and (b) probe traps, based on the data of 13–15 sampling events from the 14 sampling quadrats (see fig. 1). Indices followed by the same latter do not differ statistically significant at level of significance P=0.05, according to Tukey post-hoc comparison test.

Discussion
One of the most important aspects of stored-grain integrated pest management (IPM) is to establish monitoring programs that reliably detect low densities of the insect species that account for most of the grain damage. Results presented here corroborate previously published findings that probe traps generally capture more insects and more species than what can be determined based upon grain samples (White et al., Reference White, Arbogast, Fields, Hillmann, Loschiavo, Subramanyam, Throne and Wright1990; Subramanyam & Hagstrum, Reference Subramanyam, Hagstrum, Subramanyam and Hagstrum1995; Buchelos & Athanassiou, Reference Buchelos and Athanassiou1999; Athanassiou & Buchelos, Reference Athanassiou and Buchelos2001). Our study also corroborates conclusions from previous studies that there is, at most, a weak correlation between probe trap captures and insect counts from trier samples (Subramanyam & Hagstrum, Reference Subramanyam, Hagstrum, Subramanyam and Hagstrum1995; Vela-Coiffier et al., Reference Vela-Coiffier, Fargo, Bonjour, Cuperus and Warde1997; Hagstrum et al., Reference Hagstrum, Flinn and Subramanyam1998; Buchelos & Athanassiou, Reference Buchelos and Athanassiou1999; Athanassiou & Buchelos, Reference Athanassiou and Buchelos2001; Toews et al., Reference Toews, Phillips and Payton2005). Hagstrum et al. (Reference Hagstrum, Flinn and Subramanyam1998), by using probe traps in bin-stored wheat, noted that trap catches did not estimate accurately insect population densities throughout the storage season. However, Toews et al. (Reference Toews, Phillips and Payton2005), by using probe traps and grain samples for the detection of insects infesting stored wheat in concrete silos, found that traps could be used for prediction of absolute insect densities for C. ferrugineus and R. dominica.
In regression analyses, with abiotic variables and probe trap captures as explanatory variables of insect densities in grain samples, we showed that absolute insect counts from probe trap captures provided better predictions of actual insect densities in grain samples than when using presence/absence data. R2-values for regression models describing the densities of four out of six of the tested species were >0.40, while R2-values for the remaining two species (E. kuehniella and T. castaneum) were below 0.10. We suspect that the fairly robust regression models obtained in this study are, at least partially, explained by the fact that both linear and quadratic responses were included in the models. It is not clear to us why densities of E. kuehniella and T. castaneum in grain samples were so weakly correlated with their occurrence in probe traps and also why they correlated poorly with abiotic conditions. It is, however, possible that interspecific relationships may have played a role, as such relationships have been shown quite important in population analyses of other stored grain insect communities (Nansen et al., Reference Nansen, Flinn, Hagstrum, Toews and Meikle2009). With fairly strong correlations between probe trap captures and counts of, especially, C. ferrugineus, O. surinamensis and R. dominica in stored grain samples and simultaneously strong correlations between probe trap captures and grain temperature and moisture content, it seems possible to develop a reliable regression models that use grain temperature and moisture content to describe counts of these beetle species in stored grain. It is important to mention that temperature and moisture data were taken at the time of sampling, and correlations might be different if abiotic data had been taken continuously (i.e. with data loggers). However, except at the very surface level, both temperature and especially moisture content in grain masses tend to be quite constant over time (Hagstrum, Reference Hagstrum1987; Subramanyam & Hagstrum, Reference Subramanyam, Hagstrum, Subramanyam and Hagstrum1995; Athanassiou et al., Reference Athanassiou, Kavallieratos, Palyvos and Buchelos2003).
Very few studies have described the density relationship between parasitic wasps and their hosts in stored grain facilities. We found A. calandrae, a parasitoid of internal feeders, and H. hebetor, a moth larvae parasitoid, to be the most abundant natural enemies. Using multi-regression analyses, we showed that the occurrence of these natural enemies was only weakly associated with the abundance of their hosts, and grain moisture content and temperature appeared to be at least as important explanatory variables as host availability. In this study, we also found little difference in predictive strengths of regression models when estimates of parasitoids abundance were based on data from either grain samples or probe traps. In a maize storage facility, Nansen et al. (Reference Nansen, Phillips and Palmer2004a) found no significant spatial association between parasitoids and host species. Thus, it seems likely that neither sampling method used in this study may be well-suited for detection and quantification of parasitoid sampling in stored grain. For instance, parasitoid larvae live inside their hosts and only adults were detected in both traps and grain samples. Other techniques, such as adhesive surfaces or cardboard traps, may be more appropriate for their detection (Eliopoulos et al., Reference Eliopoulos, Athanassiou and Buchelos2002). However, Athanassiou & Saitanis (Reference Athanassiou and Saitanis2006), by using probe traps in bulk-stored wheat, found that V. canescens and H. hebetor were not associated with high densities of E. kuehniella.
Based on SADIE analyses of weekly data sets comprising of 14 data points, we showed that all insect data sets appeared to follow a spatially random distribution pattern. Experimental re-arrangement of the existing counts demonstrated that 160 of 167 insects would have to be caught at the central sampling spot for SADIE to indicate a significant aggregation. However, much fewer of the 167 insects would have to be caught at one of the peripherical sampling quadrats for SADIE to indicate a significantly aggregated distribution. Thus, the level of spatial aggregation indicated by SADIE may be, for small data sets, quite sensitive to where the ‘hot spot’ is located. The suggestion that insect counts in stored grain follow random spatial distributions has two major implications: (i) that considerable sampling effort is required, because otherwise there is a high risk that hot spots with high insect densities go undetected, and (ii) that the spatial structure of such data sets cannot be modelled accurately and that leads to restrictions on development of spatially-based sampling plans and on spatial mapping of insect counts (Nansen et al., Reference Nansen, Cambpell, Phillips and Mullen2003).
Using IL index for non-spatial analyses of insect aggregations, we showed that the level of non-spatial aggregation varied significantly among species and between sampling methods. Similar levels of non-spatial aggregation were obtained with the two sampling methods for four of the six species (P. interpunctella, R. dominica, S. oryzae and C. ferrugineus), while both E. kuehniella and T. castaneum showed significantly higher levels of aggregation when sampled from grain trier samples compared to probe traps. The non-spatial distribution analysis, therefore, suggests that several insect species show considerable levels of aggregation, that there appears to be significant differences among species and that the level of non-spatial aggregation is quite sensitive to which sampling method is used. Several studies have indicated that stored grain insects are spatially aggregated in bulk-stored grains (Subramanyam & Harein, Reference Subramanyam and Harein1990; Subramanyam & Hagstrum, Reference Subramanyam, Hagstrum, Subramanyam and Hagstrum1995; Hagstrum et al., Reference Hagstrum, Flinn and Subramanyam1998; Athanassiou & Buchelos, Reference Athanassiou and Buchelos2001; Athanassiou et al., Reference Athanassiou, Kavallieratos, Palyvos and Buchelos2003). However, additional testing is required to examine the structure of potential aggregation patterns obtained from different analysis approaches in stored-grain facilities.
Acknowledgements
We are grateful to Dr J.N. Perry of the Entomology and Nematology Department, IACRRothamsted, Harpenden, Herts, UK, for supplying the SADIE software.



