




No CrossRef data available.
Article contents
Evaluation of the standard membrane feeding assay (SMFA) for the determination of malaria transmission-reducing activity using empirical data
Published online by Cambridge University Press: 13 December 2004
Abstract
Host responses to the transmittable stages of the malaria parasite may reduce transmission effectively. Transmission-reducing activity (TRA) of human serum can be determined as a percentage, using the Standard Membrane Feeding Assay (SMFA). This laboratory assay was evaluated using the results of 121 experiments with malaria-endemic sera among which many repeated measurements were obtained. The assay consists of the feeding of Anopheles stephensi mosquitoes with cultured Plasmodium falciparum gametocytes, mixed with human red blood cells, and control and experimental sera. The TRA of individual sera was determined by the comparison of oocyst densities between these sera. Bootstrap data on oocyst densities in individual mosquitoes in control feeds were used to construct confidence limits for TRA percentages of serum feeds. Low (<20%) and high TRA (>90%) values for individual sera were usually reproduced in a second experiment, whereas this was more difficult for values between 20% and 90%. The observed variability of TRA values is explained in part by the variability in oocyst density per mosquito. Oocyst densities in control feeds varied more between experiments than within experiments and showed a slight decline over the 3 years of experiments. Reproducibility of TRA of field sera was low (20%) between experiments, but much higher (61%) within experiments. A minimum of 35 oocysts per mosquito in control feeds gave optimal reproducibility (44%) between experiments. We recommend that (1) sera are compared within an experiment, or (2) assays are only analysed where controls have at least 35 oocysts per mosquito. The SMFA is under the recommended conditions appropriate for the study of factors that may influence TRA, e.g. transmission blocking vaccines.
Keywords
Information
- Type
- Research Article
- Information
- Copyright
- © 2004 Cambridge University Press
INTRODUCTION
Malaria transmission from person to person is accomplished by infected anopheline mosquitoes as vectors. Infectivity of parasites to either host or vector depends on the life-stage of the parasite. Infectious mosquitoes (with sporozoites in the salivary glands) transmit malaria with the saliva to the host, when taking a bloodmeal on a susceptible human. The part of the life-cycle of the parasite taking place in the host is distinguished in three consecutive developmental compartments: pre-erythrocytic in the liver, and asexually and sexually in red blood cells. The sexual compartment starts with sexual commitment of asexual parasites. Sexual development in the human host is arrested at the mature gametocyte stage, the only stage transmittable to mosquitoes. After fertilization in the mosquito midgut, zygote and ookinete formation takes place. Ookinetes penetrate the mosquito midgut wall. There they develop into oocysts that rupture after maturation releasing thousands of sporozoites that migrate to the mosquito salivary gland, before potentially being transmitted via a mosquito bite to humans.
Human factors such as specific antibodies (Riley et al. 1995; Roeffen, 1995a,b, 1996), neutrophils (Lensen et al. 1997, 1998) and cytokines (Lensen et al. 1998; Naotunne et al. 1991) may interfere with sexual development of parasites in mosquitoes and thus may inhibit transmission from man to mosquito. Transmission blocking factors have therefore become a part of a strategy in malaria control. The recent attempts to develop a transmission blocking vaccine (TBV) (Stowers & Carter, 2001; Tsuboi et al. 2003) brings forward the need of a transmission assay for the evaluation of such vaccines.
The standard membrane feeding assay (SMFA) has been developed for the determination of transmission-reducing activity of individual sera (Ponnudurai et al. 1987). In the SMFA, in vitro cultured gametocytes are mixed with red blood cells and human serum, and fed through membrane feeders to laboratory reared anopheline mosquitoes (Ponnudurai et al. 1989). Transmission reducing activity (TRA) is based on the ratio of the number of oocysts developed in mosquito midguts comparing test and control sera (Lensen, 1996). Lensen standardized the method with a limited number of sera from Dutch non-exposed donors and from endemic gametocyte carriers in order to reduce variability between experiments.
The objective of this study was to optimize the measurement of transmission-reducing activity by retrospective analysis of a large data set with control and field sera, including many repeated measurements with the same sera.
MATERIALS AND METHODS
Sera
Non-immune control sera were obtained from Nijmegen bloodbank donors. Only sera that were tested negative in the SMFA were added to a large serum pool that served as a long-term negative control for feeding experiments. The sera from Cameroon (n=117) and Tanzania (n=190; Akim et al. 2002) were collected in studies on malaria transmission and transmission-blocking immunity. Subjects of all ages (and parents) were informed about the purpose of the study, in cross-sectional surveys. Thick blood smears were made from finger pricks, Giemsa stained and microscopically examined. Subjects with parasites and a body temperature above 37·5 °C or high parasitaemia (>400/μl blood), were treated with chloroquine (25 mg/kg over 3 days, Tanzania) or a single dose of Fansidar® (25 mg sulfadoxine, 1·25 mg pyrimethamine per kg body weight). Gametocyte carriers as from 5 years of age were included after consent was obtained from their parents or guardians. Venous blood (5 ml in BD Vacutainer® serum tubes) was taken sterile and serum collected after centrifuging (5 min, 700 g). The National Ethical Clearance Committee of Cameroon, the Tanzania Commission for Science and Technology (COSTECH), and the Ifakara Health Research and Development Centre approved the projects.
Transmission-blocking bioassay
A bioassay to determine transmission-reducing capacity of sera was originally described by Ponnudurai et al. (1987, 1989) and standardized by Lensen et al. (1996). All serum samples were inactivated by heating at 56 °C for 30 min. Plasmodium falciparum NF54 gametocytes were produced in an automated tipper system in red blood cells of blood group O and non-immune AB serum (Ponnudurai et al. 1982) and harvested after 13 and 14 days. The quality of gametocytes was estimated by Giemsa-stained thin smears and exflagellation assays. Infectivity of gametocytes was determined by a pre-feed.
Pre-feed
Fresh heparinized donor blood (10 ml, blood group O) was centrifuged (10 min, 500 g), buffy coat and plasma removed, washed with phosphate-buffered saline (PBS, pH 7·4) and the packed cells (pc) stored at 4 °C until used. Then 150 μl of pre-warmed (37 °C) pc and 250 μl of gametocyte suspension (13- day culture, gametocytaemia of 0·5–1%, 2% haematocrit (hc) were added to Eppendorf centrifuge tubes and centrifuged (20 sec, 15700 g). The supernatants were removed, the pellets resuspended with 150 μl of warm normal human serum, vortexed for 2 sec and fed in 300 μl aliquots (53% hc) to 50 laboratory reared Anopheles stephensi mosquitoes (3–5 days old) for 10 min in pre-warmed (37 °C) glass feeding devices, through Parafilm® membrane. Non-fed and partially fed mosquitoes were removed. Remaining mosquitoes were kept at 26 °C and >80% humidity. Sucrose (5%) was offered ad libitum. Twenty h after the feed, midguts of 5 mosquitoes were dissected and the midgut contents were stained with 50 μl of FITC-labelled mouse MoAb anti-Pfs25 in 0·05% Evans Blue. Ookinetes were examined by fluorescence microscopy. If mosquitoes harboured more than 100 ookinetes per mosquito, this gametocyte preparation was then immediately used for experimental feeds as it was considered likely to achieve a 90% infection rate in control mosquitoes.
Experimental feed
A feeding experiment consisted of batches of mosquitoes simultaneously feeding on up to 20 membrane feeders. Usually triplicate control feeds were included with non-immune control serum and 17 different endemic serum test samples. Serum was diluted in non-immune control serum (0·64 (v/v)) and suspension dilution was 0·30 (v/v). After 1 week, approximately 20 mosquitoes per batch were dissected, midguts were stained with 2% mercurochrome in PBS for 1 min and oocysts were counted per midgut using a microscope. Conditions for inclusion of experiments were (1) at least 2 controls and (2) at least 17 mosquitoes dissected per control.
In total, 121 membrane feeding experiments with endemic sera were performed from 1999 until 2001. Experiments were repeated to obtain control infection rates of at least 90%, and to confirm the outcome. Experimental feeding of 248 individual field sera was repeated twice, in general, yielding 394 comparisons of transmission–reduction data.
Data analysis
The SPSS 10.0 software package was used for statistical analyses. Oocyst densities and infection rates were compared by Spearman's correlation. The Mann–Whitney U-test was applied for comparisons of test with control feeds, including (1) oocyst densities, (2) coefficient of variation (CV) and (3) infection rates.
The transmission-reducing capacity of serum was determined as the reduction in oocyst numbers in test samples as compared to at least 2 control samples: TRA=(TC−T)/TC×100% (Lensen et al. 1996). Here, TC represents the arithmetic mean of the oocyst density per gut in all pooled control mosquitoes of 2–3 (or sometimes more) feeds within 1 experiment. Usually 20 mosquitoes were tested, but in 7% of the controls there were only 17–19 mosquitoes available for analysis. T is the arithmetic mean of the oocyst density of all mosquitoes in a test feed within the same experiment. Usually, test feeds were based on 20 mosquitoes, but lower values from 17 to 19 (7% of feeds) were also considered acceptable.
Bootstrapping was performed using oocyst densities in control mosquitoes of the full dataset to study the variability of the observed TRA values (see Appendix). Therefore, data from individual mosquitoes were pooled into groups of mosquitoes with increasing average oocyst counts. A number of random samplings and redistributions were done, generating 1·2 million simulated data sets. Finally, median TRA values and 90% confidence intervals were determined. The sign test was applied for the evaluation of (1) possible bias in subsequent examinations of the same sera, and of (2) clustering of high ([ges ]90%) and low ([les ]20%) TRA values of sera in repeated experiments. The number of sera with consistently low (or high) observed TRA values in repeated experiments were compared with the expected number(s), based on the fraction of low (or high) observed TRA values in the full data set of individual experiments. Pearson's correlation was applied on oocyst densities in replicate controls. Linear regression was applied on oocyst densities in controls, with time as independent variable.
The CVs of oocyst densities within and between experiments were compared, using arithmetic means of oocyst densities per experimental feed. For the determination of the CV between experiments, the individual feeds were randomly rearranged in a new data set, with an equivalent distribution of feeds in experiments. The average CV values within (observed) and between (random) experiments were compared by the Mann–Whitney U-test.
The proportion of repeated feeds that had overlapping 90% confidence limits of bootstrap derived TRA values was determined for individual sera. The random overlapping proportion was estimated by comparing confidence intervals for sera, which were measured once and independently, in all possible combinations. Reproducibility of TRA was defined as 100% times (overlap in feed repeats–random overlap)/(1−random overlap).
RESULTS
Variability in oocyst density
For an overview of the oocyst distributions in feeding experiments, experiments with at least 2 controls were selected. The 466 control feeds of the selected 201 feeding experiments were sorted and clustered by increasing average number of oocysts per feed (Fig. 1). Oocyst numbers were highly variable at low densities. The CV of feed cluster 1 (average of 2·7 oocysts per mosquito) was 1·94 (95% CI: 0·82–4·47). Variation decreased gradually with rising oocyst densities. The CV of feed cluster 5 (117·1 oocysts per mosquito) was 0·56 (95% CI: 0·37–0·83). Furthermore, the prevalence of non-infected mosquitoes decreased to below 10%, at increasing oocyst densities (>15 oocysts arithmetic mean (AM) per mosquito). Thus, an increase in the average oocyst density reduces its variation.

Fig. 1. Oocyst distribution per mosquito in clusters of control feeds (1–5) based on average oocyst densities per mosquito midgut (2·7, 15·0, 31·6, 59·2 and 117·1 respectively). Prevalence of infection was 48·6, 81·5, 91·3, 94·2 and 97·8% respectively.
There was a modest positive correlation between oocyst density and prevalence of infection (n=1299, r=0·577, P<0·001). Oocyst densities were significantly lower with test (AM 33·2 oocysts per mosquito, n=957) as compared to control serum (AM 44·9 oocysts, n=342) (P<0·001). Variation, however, was not significantly different between test and control feeds (CVtest=1·11, CVcontrol=1·07, P=0·11). Furthermore, prevalence was not significantly different between test (78·5%) and control sera (81·4%) (P=0·09). Thus, oocyst distributions with test and control sera were similar in experimental feeds.
Variation was also studied within experiments. Oocyst distributions were compared from 261 replicate controls within 138 experiments (Fig. 2). Every data point represents a pair of control feeds within an experiment. Correlation between pairs of controls within experiments was strong (r=0·850, P<0·001), but was negatively influenced by some outliers. The data points in the figure have an ellipsoid shape along the diagonal axis, indicating that variability between experiments was larger than within experiments.This is confirmed statistically, by the comparison of CV values. The observed variability in oocyst densities within experiments (CV=0·38; 95% CI 0·04, 1·07) was 2·2 times smaller than the simulated variability between experiments (CV=0·83; 95% CI 0·21, 1·48) (P<0·001). Furthermore, oocyst densities in control feeds appeared to diminish slightly with time (Fig. 3, B=−8·27, se(B)=3·19, P=0·01; 95% CI: −14·53, −2·00).

Fig. 2. Variability of oocyst density between control feeds within experiments. Arithmetic means of oocyst densities per feed are depicted and 1 was added for all values to present all data points (including mosquitoes without oocysts) on log scale. Every data point represents a feed pair within an experiment. All feed pairs resulted from replicate controls within independent experiments with at least 17 mosquitoes. Most experiments contained 3 control sera, resulting in 3 comparisons. There are 261 comparisons in the figure. The addition of 1 was not used in statistical analysis.

Fig. 3. Oocyst density in control mosquitoes during the experimentation period 1999–2001 declines with time (345 feeds from 150 experiments). The line represents the best fitting linear regression curve with slope −8·27/year (P=0·01).
Thus, differences between experiments resulted in a considerable variability in oocyst densities and the level of average oocyst densities reduced slightly with time.
Reproducibility of TRA
Reproducibility of TRA was explored by repetitive testing of individual sera. To facilitate the comparison of TRA values for individual sera in repeated experiments, 90% confidence limits were constructed using bootstrapping of observed data (see Appendix 1). An additional advantage of the bootstrapping method was the possibility to limit the TRA values to the range of 0 to 100%. Bootstrapping has also demonstrated that arithmetic means provide more reliable estimates of values of TRA than geometric means (see Table A2). This justifies the use of AM oocyst densities The relation between observed TRA and its theoretically determined 90% confidence intervals and median (TM-TRA) is depicted in Fig. 4. TM-TRA values were similar to observed TRA values above 20%. TM-TRA values were higher than observed TRA values below 20% as a result of the bootstrapping method used. Furthermore, the smaller TM-TRA was, the larger its variation. Fig. 4.

Fig. 4. Observed transmission-reducing activity (TRA) of individual feeds of field sera against their theoretical 90% confidence limits (dots) and median (open circles). Experiments with at least 2 control feeds and at least 17 dissected mosquitoes per feed were included (n=1092). Confidence limits and median value were determined by bootstrapping control feed data with the assumption that the effect of TRA is proportional.
In order to determine the reproducibility of transmission-reducing activity, TRA values of consecutive feeds of individual sera were compared (Fig. 5). Data points clustered below 20% (51 observed, 35·6 expected, P<0·05) and above 90% (36 observed, 11·9 expected, P<0·001). This is indicative of reproducibilty of high and low level TRA in sera from Cameroon and Tanzania. Overlap in 90% confidence intervals of repeated feeds was 59·4% (234/394), the random overlapping proportion was 49·0% (128962/263312), resulting in a reproducibility factor of 20·4%. Furthermore, TRA values showed a small but not significant tendency for higher results after repetition of the feed.

Fig. 5. Inter-assay variation of transmission-reducing activity (TRA): repeated measurements of TRA for individual field sera (median TRA values based on bootstrap data). Experiments with at least 2 control feeds and at least 17 dissected mosquitoes per control, were included (248 sera, 394 comparisons). Data points cluster below 20% (n=51) and above 90% (n=36). All experiments with averaged control oocyst densities above zero were included.
Thus, transmission-reducing activity can be reproduced with field sera, although the degree of reproducibility is modest between experiments.
Optimization of the SMFA
Variability in oocyst densities largely influences the variability of the TRA outcomes. Therefore, we tried to limit this variability in oocyst densities by exploring different thresholds for oocyst densities in controls (Table 1). At a threshold of at least 35 oocysts, on average, in controls the reproducibility was maximal (44·0%). On the other hand, the proportion of accepted feeds decreased to 62·7%, and the proportion of higher TRA values in first feeds was similar (45·1%). Thus, TRA values for individual sera are best compared at the condition of 35 oocyst in controls.

Comparison of TRA values within experiments
A higher reduction in variability of TRA values was observed by comparing feeds within experiments (Fig. 6). Feeding of 10 sera was repeated 3 times within an experiment. Feed pairs of oocyst densities showed a high correlation in repeated feeds (r=0·843, P<0·001). Furthermore, reproducibility of TRA values was high (61·1%=(24/30−0·486)/(1−0·486)). Thus, the most efficient way to compare TRA between individual field sera was to compare sera within one experiment.

Fig. 6. Intra-assay variation of transmission-reducing activity (TRA): pairs of repeated measurements of TRA per individual field sera within one experiment (median TRA values based on bootstrap data). Experiments with 3 control feeds and 20 dissected mosquitoes per control (10 sera, 30 comparisons, r=0·843, P<0·001). All experiments with averaged control oocyst densities above zero were included.
DISCUSSION
This study evaluates the SMFA (Ponnudurai et al. 1987; Lensen et al. 1996) as the biological assay of choice for the determination of transmission-reducing activity in human serum, especially (1) to study the epidemiology of transmission reduction, and (2) to evaluate the induction of transmission-blocking activity by a transmission-blocking vaccine (Stowers & Carter, 2001; Tsuboi et al. 2003). The major problem is the observed high variability of theTRA outcome. It is crucial to obtain a substantial reduction of this variability. In this study we show that the best approach for the determination of TRA is to reduce variability (1) by inclusion of experiments with at least 35 oocysts per mosquito in control feeds, or (2) by comparing sera within an experiment. We did not have sufficient data to establish the variability of TRA with a combination of both approaches. Nevertheless, we expect that the combined approaches will further improve the measurement of TRA.
The SMFA yielded highly variable transmission-reducing activity, despite extensive control of the experiments. The production of gametocytes was standardized, and their quality assessed by a number of analyses: (1) a threshold for gametocyte density, (2) the level of maturation (stage V), (3) the sex ratio of gametocytes, (4) the quality of male gametes by exflagellation assays, and (5) infectivity to mosquitoes by pre-feed. Experimental feeding was performed when pre-feeds yielded at least 100 ookinetes per mosquito. With these measures, it was possible to standardize for the number of infectious gametocytes in the feeds but, as shown in this study, there was a considerable variability in oocyst densities. The variation was much larger between experiments as compared to replicate feeds within experiments. Reducing variability in oocyst densities by setting a threshold at 35 oocysts gave a suboptimal condition for the measurement of TRA, with a maximum reproducibility. A small but consistent experimentation bias with time was found. Further analysis revealed that this bias was mainly explained by a discrepancy in TRA results for repetitions of feeds with a large time-interval. It is not clear what has caused this increase in TRA values. It can not be explained by the slight decrease of average densities in controls over time, as this would result in a decrease of TRA values. A possible explanation is that the maturity of gametocytes might have been suboptimal in the later feeds; Lensen et al. (1999) showed previously that the infectiousness of gametocytes to mosquitoes depends on a narrow range in the age of gametocytes. We are currently investigating if storage in freezers or repeated thawing of serum samples may have caused an increase in transmission-reducing activity.
The SMFA is a laboratory technique to feed mosquitoes on cultured parasites in order to determine transmission-reducing activity in sera. Alternative bioassays that are used in field settings are mosquito feeding, (1) on the skin of parasite carriers (Muirhead-Thomson, 1954; Graves et al. 1988; Boudin et al. 1991; Githeko et al. 1992; Toure et al. 1998), or (2) through a membrane on blood from gametocyte carriers (Direct Membrane Feeding Assay (DMFA), Graves et al. 1988; Mulder et al. 1999). Skin feeding reflects infectivity of parasites in individual subjects, while transmission-blocking immunity may be determined by membrane feeding by comparing autologous plasma/serum and non-immune donor serum in the feed. Bonnet et al. (2000) showed a strong correlation between skin feeding and DMFA. Mulder et al. (1999) showed that TRA results in DMFA and SMFA correlated modestly, and the calculated prevalence of transmission reducers was comparable. Furthermore, sexual-stage surface antigens involved in transmission reduction (Pfs48/45, Pfs230 and Pfs25) show limited variation.This suggests equivalence of DMFA and SMFA for reproducibility of TRA. SMFA is preferable though, because it allows for more extensive standardization, for the repetition of experiments and for the study of TRA in blood samples without gametocytes.
Most of the research groups involved in transmission reduction compare oocyst densities (Peiris et al. 1988; Ichimori et al. 1990; Lensen et al. 1996; Ramsey, Salinas & Rodriguez, 1996; Stowers et al. 2000), some focus on oocyst prevalences (Medley et al. 1993; Billingsley et al. 1994) or sporozoite prevalences (Boudin et al. 1991). Oocyst densities of P. berghei tend to follow a negative binomial distribution, approaching a Poisson distribution at high levels (Medley et al. 1993; Billingsley et al. 1994). Therefore, the variability of oocyst densities is generally reduced using geometric means (Ichimori et al. 1990; Medley et al. 1993; Billingsley et al. 1994). However, uninfected mosquitoes bias the outcome. In our experimental set up, high oocyst densities are selected using the SMFA, to prevent bias by negative feeds. Furthermore, we observed a large variation (CV>1) in oocyst distributions of P. falciparum in experimental infections. Rising oocyst density resulted in a decrease of variation. These observations suggest that oocysts of P. falciparum might follow a negative binomial distribution in our laboratory set up. Nevertheless, the observed number of non-infected mosquitoes is higher than explained by a negative binomial distribution. However, the distribution of oocysts is of limited value for the determination of TRA using the described bootstrapping method. That is because bootstrapping makes no assumption upon the type of distribution (see Appendix 1).
TRA is calculated by the ratio between oocyst densities (Peiris et al. 1988), infection rates (Ramsey et al. 1996), and is sometimes categorized (Lensen et al. 1996; Stowers et al. 2000). This makes comparison of results between research groups difficult, although the major components of experimentation are similar. Our approach takes advantage of the experience of the different groups, and the additional validation using repeated experiments with field sera. For example, we explored an alternative for the use of geometric means of oocyst densities in the calculation of TRA. We confirmed that variability in oocyst densities was reduced by using geometric instead of arithmetic means in our study. Nevertheless, TRA values were less variable and less biased with arithmetic means of oocyst densities than with geometric means (see Appendix 1). In addition, variation in oocyst densities in test and control feeds was similar, although test feeds had lower oocyst densities than control feeds.
Ponnudurai et al. (1987) showed previously that transmission-blocking MoAbs may give either consistently high (>90%) or decreasing TRA values in experiments with decreasing oocyst densities. Recently, two groups confirmed the observation of consistently high TRA values with either human sera or MoAbs against Pfs48/45 (Van der Kolk, unpublished observations) and Pfs25 (Miura, unpublished observations). In the first study, it was also observed that samples with intermediate TRA levels (<90%) showed enhanced variation in TRA. Both studies showed a proportional reduction in TRA after dilution of serum or MoAbs.
The variability of TRA may be reduced in the laboratory by the selection of experiments with high oocyst densities, but oocyst densities are usually low in nature. Billingsley et al. (1994) showed previously that oocyst densities for any mosquito did not exceed 24 in an endemic area in Tanzania. That is below the established cut off for the SMFA. Furthermore, the prevalence of infected mosquitoes in that study was 19% (with a huge variation). It is difficult, however, to reach statistical significance for either differences in oocyst densities or prevalences of infected mosquitoes, in the natural situation of endemic malaria (Medley et al. 1993; Billingsley et al. 1994). Although the high numbers of oocysts per mosquito in the SMFA do not reflect the natural situation, the proportionality of TRA allows for its comparison between sera.
As became apparent from our study, comparison of TRA values within experiments considerably limits the effect of variability. Therefore, factors that may influence TRA (e.g. transmission-blocking vaccines, age, gametocyte density, monoclonal antibodies) should best be compared within experiments. Finally, we conclude that the SMFA is appropriate for the study of TRA under the recommended conditions, both in experimental and in epidemiological settings.
The authors want to thank Ikupa Akim and Chris Drakeley for the collection of Tanzanian sera. We are grateful to the inhabitants of the Dakar district in Yaoundé and the participants in Ifakara for their appreciated collaboration. Mike van der Kolk and Sake de Vlas are supported by WOTRO grant WM93-350. The Cameroon project was funded by WHO TDR Research Capability Strengthening Grant 970781. The Tanzanian project was funded by WHO TDR grant 950428.
APPENDIX 1. Estimation of the sampling error associated with calculating transmission-blocking activity from membrane feeds
This appendix describes a bootstrapping method for calculating the most likely TRA and its confidence limits based upon the distribution of oocysts per mosquito in the control feeds described in the accompanying paper. This procedure addresses variability resulting from the distribution of oocysts in mosquitoes but does not address other sources of intra-experiment variability.
Simulation analysis of maximum probability TRA and confidence limits
Bootstrap data set
The average oocysts in all control mosquitoes from a single feeding experiment were calculated and feeding experiments were ranked in order of this average. There were 201 feeding experiments, with 466 control feeds. Data from individual mosquitoes from 5 consecutively ranked feeding experiments were pooled to give 40 groups of mosquitoes with progressively higher average oocysts counts. A series of simulations was done. Each with a progressively increasing theoretical TRA (ranging from 0 to 100%). For each theoretical TRA, a simulated control and test feed were generated as follows: 20, 40 or 60 mosquitoes (to simulate 1, 2 or 3 control feeds, respectively, per feeding experiment) were picked at random from one of the 40 data sets and the experimentally determined oocyst number of each of these used to calculate the arithmetic mean oocysts. This is the control average for this simulation. A further 20 mosquitoes picked from the same data set become the test group. The simulated number of oocysts for each of the test mosquitoes was chosen from the actual experimentally derived number in each test mosquito decremented using a binomial random number generator, with probability=1−TRA/100. The arithmetic mean of simulated oocyst numbers in each of the 20 test mosquitoes was calculated. The calculated TRA for this simulated experiment was calculated as 100*(mean control oocysts–mean test oocysts)/mean control oocysts. The calculated TRA, the theoretical TRA and the simulated mean control oocysts constitute one datum.
Because of the way the data sets were constructed, there is an equal probability that the controls for an actual feed will lie in any of the 40 input data sets. Implicit in this simulation is the assumption that transmission-blocking activity is independent of the potential oocysts load per mosquito.
However, it makes no assumption on the frequency distribution of oocysts per mosquito. If all of the variance in the number of oocysts per control mosquito came from the random nature of the distribution of oocysts per mosquito and not from feed to feed variation (see below), then since the 40 pools of mosquitoes are assembled from several feeds, confidence limits of TRA derived from these simulations are expected to be slightly overestimated.
Tables linking the observed TRA to most likely theoretical TRA and its confidence limits were constructed as follows. For each of the 40 input data sets, 300 simulations were done for theoretical TRA increasing from 0% to 99% in 1% increments. The 1·2 million simulated data sets were sorted into 20 groups of increasing average observed oocysts per control mosquito to give a theoretically equal frequency distribution per group. As the actual distribution reflects the stochastic nature of the simulation, the exact numbers varied per group and so each group was randomly trimmed to contain exactly 40000 sets of data. Each of these was sorted into 40 subsets of increasing observed TRA and each subset sorted according to the theoretical TRA used. Each sorted data set was then used to fit an association between observed TRA with the most likely theoretical TRA, and to determine the confidence limits on the estimate of TRA (i.e. the 90% confidence limits are determined from the 51st to the 950th value of theoretical TRA in the sorted set.
Over most of the range of values, the observed TRA and the underlying theoretical TRA are linearly correlated with a slope of one. However, for low values of TRA, the relationship markedly curves. At the extreme are negative observed TRA values (i.e. where the oocysts counts in test mosquitoes happens, by chance, to be greater than in the control mosquitoes). In this model, all of these test feeds must have arisen from samples where the actual TRA is zero or slightly positive then these simulations predict as expected, that the most likely true TRA for an observed negative TRA will be >zero (see Fig. 4, above).
For all data sets, the median and 90% upper and lower limits could be adequately fitted to a 4 parameter exponential curve

For data sets where the observed number of oocysts in the control mosquitoes was >20 (a total of 33 sets, corresponding to mean oocysts counts ranging from 20 to 190 and with 1, 2 or 3 control feeds per experiment), were fitted to a parabolic surface to give the following empirical equations


where n is the number of control mosquitoes dissected (20, 40 or 60) and o is the average number of oocysts per mosquito observed in control mosquitoes. Subscripts L, m and U refer to the parameters for the lower, median and upper limits of the estimate of theoretical TRA. Similar equations describe b, c and d. The parameters are listed in Table A1.
Table A1. Parameters for calculating maximum likelihood values of transmission-reducing activity (TRA) and confidence limits from observed value of TRA, the observed number of oocysts per mosquito and the number of control mosquitoes dissected per feed (Parameters a, b, c and d are calculated with parameters p1–p5, the number of dissected control mosquitoes and the average oocyst density in controls (using equation (2) and similar equations). Parameters aL, bL, cL and dL describe the lower 90% confidence limit for TRAt (equation (1)). Median TRAt is calculated with aM, bM, cM and dM and parameters aU, bU, cU and dU describe the higher 90% confidence limit for TRAt.)

Calculation of TRA
Three methods have been used in the literature (Lensen et al. 1996) to calculate the ratio of infectivity of mosquitoes in the presence and absence of immune sera, and hence the TRA {TRA=100*(1−ratio infectivity)}. These are:
- Ratio of arithmetic mean occysts per mosquito

- Ratio of geometric mean oocysts per mosquito
- Ratio of average natural log of number of oocysts per mosquito
where n and m are the number of test and control mosquitoes dissected in each experiment and where ot and oc are the number of oocysts on individual test and control mosquitoes, respectively.
The TRA calculated using method 3 depends on the number of oocysts per mosquito in control feeds. This is contrary to experiments that show that the TRA of a given antibody preparation is not significantly different for feeds covering a wide range of oocysts per mosquito (Miura, personal communication) and will not be further considered.
It can be shown mathematically that provided an antiserum acts to independently reduce the probability of the formation of oocysts and there are no mosquitoes with no oocysts, then true TRA calculated for an infinitely large sample will be the same for both method 1 or 2. However, in practice, the two methods may not give equally good estimates of TRA for two reasons. First, when any mosquito in a feed has no oocysts, then the geometric mean cannot be used. To avoid this problem, a modified form of the GM is normally used (GM(oocysts+1)−1). The addition of 1 to each sample biases the estimate, especially for high values of TRA or for feeds where there are appreciable numbers of uninfected mosquitoes. Second, for the unusual distribution of oocysts, it is not clear if both the arithmetic and geometric means provide equivalent estimates of the true population mean.
To investigate the preferred method of calculating TRA, a series of simulations were done using bootstrap data sets derived from feeds with an average of approximately 10, 20, 40, 80 and 190 oocysts per mosquito in control mosquitoes, for 30%, 60% and 90% theoretical TRA and for 20 mosquitoes in both test and control feeds. Estimated TRA was calculated using arithmetic and geometric means for each simulation. The simulation was repeated 1000 times for each input combination and the mean and standard deviation of the estimated TRA calculated.
As shown in Table A2, as judged by the standard deviation of the repeat estimates of the TRA, calculation of the TRA using the geometric mean gave a substantially poorer estimate than that calculated by the arithmetic mean. It also tended to underestimate the TRA, especially for lower true TRA and for lower numbers of oocysts per control mosquito. Therefore, TRA calculated using the arithmetic mean is recommended for calculating TRA and was used in the accompanying paper.

References
REFERENCES
AKIM, N. I.,
URASSA, H.,
DRAKELEY, C. J.,
SAUERWEIN, R. W. &
KITUA, A. Y. (
2002).
Immunity to the sexual stages of Plasmodium falciparum in mothers, neonates and infants subject to intense and perennial malarial transmission.
Annals of Tropical Medicine and Parasitology
96,
735–737.CrossRefGoogle Scholar
BILLINGSLEY, P. F.,
MEDLEY, G. F.,
CHARLWOOD, D. &
SINDEN, R. E. (
1994).
Relationship between prevalence and intensity of Plasmodium falciparum infection in natural populations of Anopheles mosquitoes.
American Journal of Tropical Medicine and Hygiene
51,
260–270.CrossRefGoogle Scholar
BONNET, S.,
GOUAGNA, C.,
SAFEUKUI, I.,
MEUNIER, J. Y. &
BOUDIN, C. (
2000).
Comparison of artificial membrane feeding with direct skin feeding to estimate infectiousness of Plasmodium falciparum gametocyte carriers to mosquitoes.
Transactions of the Royal Society of Tropical Medicine and Hygiene
94,
103–106.CrossRefGoogle Scholar
BOUDIN, C.,
LYANNAZ, J.,
BOSSENO, M. F.,
CARNEVALE, P. &
AMBROISE-THOMAS, P. (
1991).
Epidemiology of Plasmodium falciparum in a rice field and a savanna area in Burkina Faso: seasonal fluctuations of gametocytaemia and malarial infectivity.
Annals of Tropical Medicine and Parasitology
85,
377–385.CrossRefGoogle Scholar
GITHEKO, A. K.,
BRANDLING-BENNETT, A. D.,
BEIER, M.,
ATIELI, F.,
OWAGA, M. &
COLLINS, F. H. (
1992).
The reservoir of Plasmodium falciparum malaria in a holoendemic area of western Kenya.
Transactions of the Royal Society of Tropical Medicine and Hygiene
86,
355–358.CrossRefGoogle Scholar
GRAVES, P. M.,
BURKOT, T. R.,
CARTER, R.,
CATTANI, J. A.,
LAGOG, M.,
PARKER, J.,
BRABIN, B. J.,
GIBSON, F. D.,
BRADLEY, D. J. &
ALPERS, M. P. (
1988).
Measurement of malarial infectivity of human populations to mosquitoes in the Madang area, Papua New Guinea.
Parasitology
96,
251–263.CrossRefGoogle Scholar
ICHIMORI, K.,
CURTIS, C. F. &
TARGETT, G. A. (
1990).
The effects of chloroquine on the infectivity of chloroquine-sensitive and -resistant populations of Plasmodium yoelii nigeriensis to mosquitoes.
Parasitology
100,
377–381.CrossRefGoogle Scholar
MEDLEY, G. F.,
SINDEN, R. E.,
FLECK, S.,
BILLINGSLEY, P. F.,
TIRAWANCHAI, N. &
RODRIGUEZ, M. H. (
1993).
Heterogeneity in patterns of malarial oocyst infections in the mosquito vector.
Parasitology
106,
441–449.CrossRefGoogle Scholar
LENSEN, A.,
VAN DRUTEN, J.,
BOLMER, M.,
VAN GEMERT, G.,
ELING, W. &
SAUERWEIN, R. (
1996).
Measurement by membrane feeding of reduction in Plasmodium falciparum transmission induced by endemic sera.
Transactions of the Royal Society of Tropical Medicine and Hygiene
90,
20–22.CrossRefGoogle Scholar
LENSEN, A. H.,
BOLMER-VAN DE VEGTE, M.,
VAN GEMERT, G. J.,
ELING, W. M. &
SAUERWEIN, R. W. (
1997).
Leukocytes in a Plasmodium falciparum-infected blood meal reduce transmission of malaria to Anopheles mosquitoes.
Infection and Immunity
65,
3834–3837.Google Scholar
LENSEN, A.,
MULDER, L.,
TCHUINKAM, T.,
WILLEMSEN, L.,
ELING, W. &
SAUERWEIN, R. (
1998).
Mechanisms that reduce transmission of Plasmodium falciparum malaria in semiimmune and nonimmune persons.
Journal of Infectious Diseases
177,
1358–1363.CrossRefGoogle Scholar
LENSEN, A.,
BRIL, A.,
VAN DE VEGTE, M.,
VAN GEMERT, G. J.,
ELING, W. &
SAUERWEIN, R. (
1999).
Plasmodium falciparum: infectivity of cultured, synchronized gametocytes to mosquitoes.
Experimental Parasitology
91,
101–103.CrossRefGoogle Scholar
MUIRHEAD-THOMSON, R. C. (
1954).
Factors determining the true reservoir of infection for Plasmodium falciparum and Wucheria bancrofti in a West-African village.
Transactions of the Royal Society of Tropical Medicine and Hygiene
48,
208–225.CrossRefGoogle Scholar
MULDER, B.,
LENSEN, T.,
TCHUINKAM, T.,
ROEFFEN, W.,
VERHAVE, J. P.,
BOUDIN, C. &
SAUERWEIN, R. (
1999).
Plasmodium falciparum: membrane feeding assays and competition ELISAs for the measurement of transmission reduction in sera from Cameroon.
Experimental Parasitology
92,
81–86.CrossRefGoogle Scholar
NAOTUNNE, T. S.,
KARUNAWEERA, N. D.,
DEL GIUDICE, G.,
KULARATNE, M. U.,
GRAU, G. E.,
CARTER, R. &
MENDIS, K. N. (
1991).
Cytokines kill malaria parasites during infection crisis: extracellular complementary factors are essential.
Journal of Experimental Medicine
173,
523–529.CrossRefGoogle Scholar
PEIRIS, J. S.,
PREMAWANSA, S.,
RANAWAKA, M. B.,
UDAGAMA, P. V.,
MUNASINGHE, Y. D.,
NANAYAKKARA, M. V.,
GAMAGE, C. P.,
CARTER, R.,
DAVID, P. H. &
MENDIS, K. N. (
1988).
Monoclonal and polyclonal antibodies both block and enhance transmission of human Plasmodium vivax malaria.
American Journal of Tropical Medicine and Hygiene
39,
26–32.CrossRefGoogle Scholar
PONNUDURAI, T.,
LENSEN, A. H.,
LEEUWENBERG, A. D. &
MEUWISSEN, J. H. (
1982).
Cultivation of fertile Plasmodium falciparum gametocytes in semi-automated systems. 1. Static cultures.
Transactions of the Royal Society of Tropical Medicine and Hygiene
76,
812–818.CrossRefGoogle Scholar
PONNUDURAI, T.,
LENSEN, A. H.,
VAN GEMERT, G. J.,
BENSINK, M. P.,
BOLMER, M. &
MEUWISSEN, J. H. (
1989).
Infectivity of cultured Plasmodium falciparum gametocytes to mosquitoes.
Parasitology
98,
165–173.CrossRefGoogle Scholar
PONNUDURAI, T.,
VAN GEMERT, G. J.,
BENSINK, T.,
LENSEN, A. H. &
MEUWISSEN, J. H. (
1987).
Transmission blockade of Plasmodium falciparum: its variability with gametocyte numbers and concentration of antibody.
Transactions of the Royal Society of Tropical Medicine and Hygiene
81,
491–493.CrossRefGoogle Scholar
RAMSEY, J. M.,
SALINAS, E. &
RODRIGUEZ, M. H. (
1996).
Acquired transmission-blocking immunity to Plasmodium vivax in a population of southern coastal Mexico.
American Journal of Tropical Medicine and Hygiene
54,
458–463.CrossRefGoogle Scholar
RILEY, E. M.,
WILLIAMSON, K. C.,
GREENWOOD, B. M. &
KASLOW, D. C. (
1995).
Human immune recognition of recombinant proteins representing discrete domains of the Plasmodium falciparum gamete surface protein, Pfs230.
Parasite Immunology
17,
11–19.CrossRefGoogle Scholar
ROEFFEN, W.,
LENSEN, T.,
MULDER, B.,
TEELEN, K.,
SAUERWEIN, R.,
VAN DRUTEN, J.,
ELING, W.,
MEUWISSEN, J. H. &
BECKERS, P. J. (
1995 a).
A comparison of transmission-blocking activity with reactivity in a Plasmodium falciparum 48/45-kD molecule-specific competition enzyme-linked immunosorbent assay.
American Journal of Tropical Medicine and Hygiene
52,
60–65.Google Scholar
ROEFFEN, W.,
BECKERS, P. J.,
TEELEN, K.,
LENSEN, T.,
SAUERWEIN, R. W.,
MEUWISSEN, J. H. &
ELING, W. (
1995 b).
Plasmodium falciparum: a comparison of the activity of Pfs230-specific antibodies in an assay of transmission-blocking immunity and specific competition ELISAs.
Experimental Parasitology
80,
15–26.Google Scholar
ROEFFEN, W.,
MULDER, B.,
TEELEN, K.,
BOLMER, M.,
ELING, W.,
TARGETT, G. A.,
BECKERS, P. J. &
SAUERWEIN, R. (
1996).
Association between anti-Pfs48/45 reactivity and P. falciparum transmission-blocking activity in sera from Cameroon.
Parasite Immunology
18,
103–109.Google Scholar
STOWERS, A. W.,
KEISTER, D. B.,
MURATOVA, O. &
KASLOW, D. C. (
2000).
A region of Plasmodium falciparum antigen Pfs25 that is the target of highly potent transmission-blocking antibodies.
Infection and Immunity
68,
5530–5538.CrossRefGoogle Scholar
STOWERS, A. &
CARTER, R. (
2001).
Current developments in malaria transmission-blocking vaccines.
Expert Opinion on Biology Therapy
1,
619–628.Google Scholar
TOURE, Y. T.,
DOUMBO, O.,
TOURE, A.,
BAGAYOKO, M.,
DIALLO, M.,
DOLO, A.,
VERNICK, K. D.,
KEISTER, D. B.,
MURATOVA, O. &
KASLOW, D. C. (
1998).
Gametocyte infectivity by direct mosquito feeds in an area of seasonal malaria transmission: implications for Bancoumana, Mali as a transmission-blocking vaccine site.
American Journal of Tropical Medicine and Hygiene
59,
481–486.CrossRefGoogle Scholar
TSUBOI, T.,
TACHIBANA, M.,
KANEKO, O. &
TORII, M. (
2003).
Transmission-blocking vaccine of vivax malaria.
Parasitology International
52,
1–11.CrossRefGoogle Scholar
VERMEULEN, A. N.,
VAN DEURSEN, J.,
BRAKENHOFF, R. H.,
LENSEN, T. H.,
PONNUDURAI, T. &
MEUWISSEN, J. H. (
1986).
Characterization of Plasmodium falciparum sexual stage antigens and their biosynthesis in synchronised gametocyte cultures.
Molecular and Biochemical Parasitology
20,
155–163.CrossRefGoogle Scholar
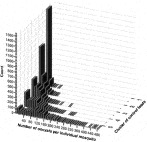
Fig. 1. Oocyst distribution per mosquito in clusters of control feeds (1–5) based on average oocyst densities per mosquito midgut (2·7, 15·0, 31·6, 59·2 and 117·1 respectively). Prevalence of infection was 48·6, 81·5, 91·3, 94·2 and 97·8% respectively.
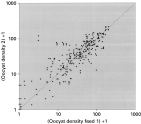
Fig. 2. Variability of oocyst density between control feeds within experiments. Arithmetic means of oocyst densities per feed are depicted and 1 was added for all values to present all data points (including mosquitoes without oocysts) on log scale. Every data point represents a feed pair within an experiment. All feed pairs resulted from replicate controls within independent experiments with at least 17 mosquitoes. Most experiments contained 3 control sera, resulting in 3 comparisons. There are 261 comparisons in the figure. The addition of 1 was not used in statistical analysis.
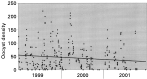
Fig. 3. Oocyst density in control mosquitoes during the experimentation period 1999–2001 declines with time (345 feeds from 150 experiments). The line represents the best fitting linear regression curve with slope −8·27/year (P=0·01).
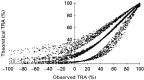
Fig. 4. Observed transmission-reducing activity (TRA) of individual feeds of field sera against their theoretical 90% confidence limits (dots) and median (open circles). Experiments with at least 2 control feeds and at least 17 dissected mosquitoes per feed were included (n=1092). Confidence limits and median value were determined by bootstrapping control feed data with the assumption that the effect of TRA is proportional.
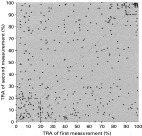
Fig. 5. Inter-assay variation of transmission-reducing activity (TRA): repeated measurements of TRA for individual field sera (median TRA values based on bootstrap data). Experiments with at least 2 control feeds and at least 17 dissected mosquitoes per control, were included (248 sera, 394 comparisons). Data points cluster below 20% (n=51) and above 90% (n=36). All experiments with averaged control oocyst densities above zero were included.
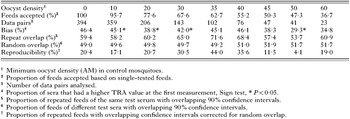
Table 1. Reproducibility of transmission-reducing activity in field sera from Cameroon and Tanzania
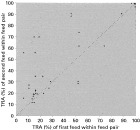
Fig. 6. Intra-assay variation of transmission-reducing activity (TRA): pairs of repeated measurements of TRA per individual field sera within one experiment (median TRA values based on bootstrap data). Experiments with 3 control feeds and 20 dissected mosquitoes per control (10 sera, 30 comparisons, r=0·843, P<0·001). All experiments with averaged control oocyst densities above zero were included.
 You have
Access
- 82
- Cited by