Introduction
Lifetime prevalence of depression in adult women is almost twice of that in men (21% and 13%, respectively) (Weissman and Klerman, Reference Weismann and Klerman1977; Jorm, Reference Jorm1987; Kessler et al., Reference Kessler, McGonagle, Swartz, Blazer and Nelson1993; Wolk and Weismann, Reference Wolk and Weissman1995; Bebbington et al., 1996; Kessler, Reference Kessler, Keyers and Goodman2006). Furthermore, women have higher relapse or non-remission rates (Kuehner, Reference Kuehner2003). Possible explanations of this gender disparity (the so-called “gender gap”) in depression are sex differences in social factors, such as social role and status, life events and social support, in addition to sex differences in biological factors (genetic vulnerability, hormonal influences) and psychological factors (coping style, neuroticism, mastery) (Kessler et al., Reference Kessler and McLeod1984; Wolk and Weismann, Reference Wolk and Weissman1995; Dorn and Chrousos, Reference Dorn and Chrousos1997; Nolen-Hoeksema, Reference Nolen-Hoeksema2000; Kendler et al., Reference Kendler, Thornton and Prescott2001; Kuehner, Reference Kuehner2003; Kooiman et al., Reference Kooiman, Jansen and Peeters2007; Leach et al., Reference Leach, Christensen, Mackinnon, Windsor and Butterworth2008).
Some authors have concluded that the gender gap is associated with the reproductive period of life, and that in older age the gender gap diminishes or disappears (Krause, Reference Krause1986; Jorm, Reference Jorm1987; Bebbington et al., Reference Bebbington1998; Noble, Reference Noble2005), but other studies failed to confirm this hypothesis (Beekman et al., Reference Beekman, Copeland and Prince1999; Prince et al., Reference Prince1999; Sonnenberg et al., Reference Sonnenberg, Beekman, Deeg and Van Tilburg2000; Cairney and Wade, Reference Cairney and Wade2002). Among the explanations for the persisting gender gap in older age is the differential exposure of older men and women to social risk factors for late-life depression (Sonnenberg et al., Reference Sonnenberg, Beekman, Deeg and Van Tilburg2000). Older women have lower education and income than older men, and they are more likely than men to lose their partner, which is an important risk factor for depression (Harlow et al., Reference Harlow, Goldberg and Comstock1991; Mendes de Leon et al., Reference Mendes de Leon, Kasl and Jacobs1994). However, not only a differential exposure to risk factors is likely to play a role, but the impact of risk factors also shows gender differences. Older women appear to be less vulnerable for depression than older men when they lose their partner, and when they receive little emotional support (Umberson et al., 1988; Van Grootheest et al., Reference Van Grootheest, Beekman, Broese van Groenou and Deeg1999; Sonnenberg et al., Reference Sonnenberg, Beekman, Deeg and Van Tilburg2000). Therefore, not only the amount, but also the significance of interpersonal relationships and social support may influence gender differences in depression, their effects being in different directions.
In studies on social ties among adults of all ages, women and men were found to have different needs for social affiliation, and different expectations of social relationships. Women of all ages have a larger personal network and receive more social support, which is a protective factor against depression, but which also provides a greater opportunity for negative interpersonal experiences (e.g. death of someone close), which in turn may lead to depression (Kessler and McLeod, Reference Kessler and McLeod1984; Kendler et al., Reference Kendler, Thornton and Prescott2001; Leach et al., Reference Leach, Christensen, Mackinnon, Windsor and Butterworth2008). In a study by Dalgard et al. (Reference Dalgard2006), women experienced more negative life events particularly related to their personal network, but also had more support, both in general and in the context of the event. Also, women with little support were more vulnerable to depression than men in case of a life event (Dalgard et al., Reference Dalgard2006). Husbands and wives were found to provide equal support to each other, but women felt more responsible than men toward their spouse as well as toward other persons, which may lead to feelings of being burdened and overloaded (Neff and Korney, Reference Neff and Karney2005). Interpersonal problems with one's family are associated with a higher prevalence of depression in women than in men, probably due to a greater involvement and feelings of responsibility in family matters in women (Leach et al., Reference Leach, Christensen, Mackinnon, Windsor and Butterworth2008).
Similar evidence has been reported on older persons. Older women were found to be more sensitive to life events occurring to other persons than older men (Kessler and McLeod, Reference Kessler and McLeod1984; Maciejewski et al., Reference Maciejewski, Prigerson and Mazure2001). In older people, social support protected against the psychological distress, but in older women with low resources, social connections increased the levels of distress, particularly if there was a role strain due to obligations to provide support to others (Kawachi and Berkman, Reference Kawachi and Berkman2001). In another study on coping with functional diseases in older married couples aged 60–84, social support led to improved well-being in men but not in women (Robb et al., Reference Robb, Small and Haley2008). In a study of people aged 40–70 years old, Takizawa found that men benefited from social support as buffer against depression, but women did not (Takizawa et al., Reference Takizawa, Kondo, Sakihara, Ariizumi, Watanabe and Oyama2006). In a study of 600 African-American older community residents (aged 55–85 years), women tended to become more depressed with increasing number of events combined with low levels of social attachment, guidance and reliability, particularly when they were living alone (Husaini et al., Reference Husaini1991).
In summary, women have generally been found to have a larger network, which is associated with more social support, but they also experience more negative impact of their social relationships than men. The gender differences in need for social affiliation may be a reflection of differences in the need for sharing feelings, problems and life events, and in appreciation and expectations of the existing relationships and support. It is important to note that depression may also enhance the felt need for affiliation through specific symptoms such as feeling lonely or feeling helpless. Because depression, gender, need for social affiliation, and actual social support are intertwined, prospective designs are needed to study the influence of the presence or absence of social support and need for affiliation on the onset of depression in men and women.
In older people many changes in social support take place due to changes in health, functional capacity and living arrangements, and to illness or death of important others. Therefore, studies focusing on older age are useful to obtain a better understanding of the protective and disruptive effects of social relationships on distress and depression in later life, and lead to a more individually tailored approach in the management of these mental health problems in older men and women.
In the present study, we aimed to investigate the relation between social support (amount of social support and need for social affiliation) and late-life depression in men and women, both in a cross-sectional and prospective design, in a community-based sample of older Dutch citizens.
Materials and methods
Sampling and procedures
Data were derived from the Longitudinal Aging Study Amsterdam (LASA), an ongoing interdisciplinary study on predictors and consequences of changes in autonomy and well-being in the aging population (Deeg and Westendorp-de Serière, Reference Deeg and Westendorp-de Serière1994; Deeg et al., Reference Deeg, Van Tilburg, Smit and De Leeuw2002). Details on sampling procedures and responses have been described in previous publications (Beekman et al., Reference Beekman, Deeg, Van Tilburg, Smit, Hooijer and Van Tilburg1995; Reference Beekman2002; Deeg et al., Reference Deeg, Van Tilburg, Smit and De Leeuw2002; Vink et al., Reference Vink2009). Briefly, the LASA cohort is based on a representative sample of 3,107 older adults between the ages of 55 and 85 at baseline, stratified for age and sex. It was drawn from the population registers of 11 municipalities in three regions of the Netherlands.
Data collection started in 1992–1993 (T1), followed by data collection cycles every three years: in 1995–1996 (T2), 1998–1999 (T3), 2001–2002 (T4), and 2005–2006 (T5). Trained and supervised interviewers using the same procedures and instruments interviewed respondents at home. All interviews were tape-recorded. The numbers of participants in the five cycles were 3,107, 2,545, 2,076, 1,691, and 1,257, respectively. Non-response in the first LASA cycle was associated with age, but not with sex. Attrition between T1 and T5 was mainly due to mortality: percentages of people who died before approach were 13% between T1 and T2, 14% between T2 and T3, 14% between T3 and T4, and 14% between T4 and T5. Other reasons for attrition were refusal, frailty, and failure to contact (about 5% per cycle). At all four follow-up cycles, attrition was associated with older age and male sex, and with physical disease and cognitive impairment at the preceding cycle. Attrition at T2 was associated with the low level of education and to the presence of depression at T1, but this pattern was not observed at later cycles.
For the present cross-sectional investigation of the association between social support and depression, and gender differences in these associations, the data of the first LASA cycle were used. Due to incomplete data on social support or on the need for social attachment, 2,823 out of the 3,107 respondents were available for the analyses. Furthermore, we conducted a longitudinal investigation of the association of social support with onset of depression in the follow-up period, for which the follow-up data were used of respondents who were not depressed at T1 according to the Centre for Epidemiologic Studies Depression Scale (CES-D ≤ 12), and had at least one follow-up measurement. A total of 1,928 respondents fulfilled these criteria. At the four follow-up measurements, the numbers of available respondents were 1,858, 1,580, 1,253, and 910, respectively.
Measures
Depression
Depressive symptoms were measured with the CES-D, a 20-item self-report scale developed for use in the community (Radloff, Reference Radloff1977; Radloff and Teri, Reference Radloff and Teri1986). The CES-D has good psychometric properties in older community samples (Beekman et al., Reference Beekman, Deeg, Van Limbeek, Braam, de Vries and Van Tilburg1997) with minimal overlap with physical illness (Berkman et al., Reference Berkman, Berkman and Kasl1986). Scores range from 0 to 60 and respondents scoring 16 or higher were considered to have a clinically relevant level of depressive symptoms. At baseline, prevalence of depression was established based on the CES-D. In the prospective study, onset of depression was defined as the development of depression, defined as crossing the cut-off score of the CES-D with an increase of at least four points at one or more measurements within the 13 years of follow-up.
Social and personal support
Three aspects of social and personal support were measured.
First, the presence of a partner in the household was assessed. A partner is generally considered the most important relationship in the social network. When the partner is available, he or she is generally an important resource of support (Turner and Marino, Reference Turner and Marino1994; Ross et al., 1995). Respondents received a score of 1 if a spouse or someone they considered their partner was available in the household, otherwise 0.
Next, the personal network size was measured, defined as the total number of network members with whom the respondent had important and regular contact (Van Tilburg, Reference Van Tilburg1998). Network size ranged from 0 to 75 network members, with a mean of 14 and a median of 12 network members. A network with fewer than 11 network members was considered to be small.
In addition to these structural aspects of social support, functional support exchanges within social relationships were also measured. For this study, we used the mean amount of emotional support received from the maximally nine network members (excluding the partner) with whom contact was most frequent. Respondents were asked how often in the previous year they had talked to these nine network members about personal experiences and feelings. Response categories were never (0), seldom (1), sometimes (2), and often (3). Mean scores of the emotional support received from the nine network members were computed and divided in three groups ranging from 0 (relationships are seldom or never supportive) to 2 (relationships are often supportive) (Penninx et al., Reference Penninx, Van Tilburg, Kriegsman, Boeke, Deeg and Van Eijk1999). For this study, respondents in the groups with scores of 0 or 1 were considered to have low received emotional support.
Need for social affiliation
The need for social affiliation was measured with a four-item self-report scale, the need for affiliation scale. This scale was developed and tested in an adult Dutch community sample (Van Tilburg, Reference Van Tilburg1988) and contains questions about the need to talk to others about one's feelings, the need for help and support in case of trouble, the need to go to others when something bothers the respondent, and the need to lean on someone when experiencing difficulties. Scores range from 4 (low need for affiliation) to 12 (strong need for affiliation), and respondents scoring 9 or higher were considered to have a high need for affiliation. Reliability of this scale was sufficient, with a Cronbach's α of 0.73.
Age, gender, level of education, cognitive impairment, and physical limitations were considered to be potential confounders because of their relation to depression, gender, and social support, and were therefore included in the study. Respondents were divided into three age groups: 55–64, 65–74, and 75–85 years old. Education was ranked according to three levels: elementary education, intermediate or secondary (vocational) education, and high (vocational) education including university and college education. Cognitive impairment was measured with the Mini-Mental State Examination (MMSE) using a cut-off score of 23 (Folstein et al., Reference Folstein, Folstein and McHugh1975). Physical limitations were measured with a self-report scale on difficulty with several activities of daily functioning, previously validated in the Netherlands and summarized in two categories: no difficulty and difficulty with one or more activities (Van Sonsbeek et al., Reference Van Sonsbeek1988; Kriegsman et al., Reference Kriegsman, Deeg, Van Eijk, Penninx and Boeke1997).
Statistical analyses
Baseline sample characteristics were assessed, including prevalence of depression, in the full sample, and in men and women separately, using chi-square statistics and logistic regression analyses to indicate the magnitude of the gender differences.
Bivariate associations of depression with each of the three social support measures and affiliation need were investigated, adjusted for age and gender, calculating odds ratios in the full sample and in both genders. In order to control for possible confounding, multivariate analyses were performed for each of the support measures and affiliation need, including age, gender, level of education, cognitive impairment, and functional limitations as independent variables. Testing for interaction effects of gender on these associations was performed, using logistic regression analyses.
To investigate the prospective associations of each of the social support measures and need for affiliation with onset of depression, Cox regression analyses were performed in the sample of respondents who were not depressed at the first LASA cycle, with time to onset of depression during follow-up as the dependent variable, and adjusted for age and gender. In order to control for the confounding variables as mentioned above, multivariate analyses were performed. Testing for interaction effects of gender on these associations was performed, using logistic regression analyses.
In all analyses, the criterion for statistical significance was p < 0.05.
Results
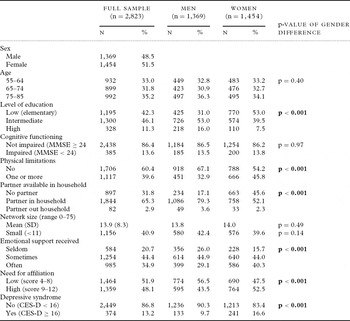
An overview of baseline sample characteristics with gender differences is shown in Table 1. Due to the stratified sampling, age and gender were equally distributed in the sample. Most respondents had low or intermediate levels of education, with significantly more women in the low-level group. Cognitive impairment was equally divided between men and women. Note that 40% had one or more physical limitations, with preponderance in women. Half of the respondents had a partner in the household. Network size ranged from 0 to 75, with a mean of 14 network members. The majority received emotional support on a regular basis, half of which often. As expected, statistically significant gender differences were found for two social support variables, with men having more often a partner in the household and women receiving more emotional support. Need for affiliation was significantly higher in women than in men. Note that 13% of the respondents had depressive symptoms according to the CES-D, with a statistically significant gender difference of 16.6% in women and 9.7% in men (OR = 1.87, CI = 1.49–2.34, p < 0.001, adjusted for age).
Characteristics of the LASA baseline sample (N = 2,823) with gender differences (p < 0.05)

MMSE = Mini-Mental State Examination; CES-D = Centre for Epidemiologic Studies Depression Scale
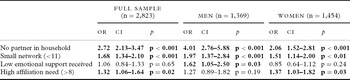
Table 2 shows the results of bivariate analyses of depression with the three social support measures and affiliation need, adjusted for age and gender. Not having a partner in the household and having a small network size were both associated with depression in the full sample, and in men and women separately. Low emotional support received was associated with depression in men, but not in women or in the full sample. A high need for social affiliation was associated with depression in the full sample and in women, but not in men. Gender differences in these associations were statistically significant (OR laying outside the CI of the other gender) for having no partner in the household and low emotional support, with men in these conditions being more vulnerable for depression than women.
Bivariate associations of depression with social support and need for affiliation, adjusted for age and gender, in the full sample and in men and women (OR with 95% CI; p < 0.05)

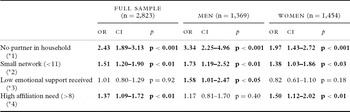
In Table 3, results are shown of the multivariate analyses of depression with the three social support measures and affiliation need, controlling for the confounding variables age, gender, level of education, cognitive impairment, and functional limitations. Not having a partner in the household and having a small network size remained statistically significant in the association with depression in the full sample and in men and women separately. Low emotional support received was associated with depression in men but not in the full sample or in women. A high need for affiliation was associated with depression in the full sample and in women, but not in men. Statistically significant gender differences in these associations were found for having no partner in the household and low received emotional support. Test statistics of the interactions for gender are shown in the footnotes of Table 3.
Multivariate associations of depression with social support and need for affiliation, adjusted for age, gender, level of education, cognitive impairment, and functional limitations, in the full sample and in men and women (OR with 95% CI; p < 0.05)

Interactions of gender with:
*1. No partner in the household: OR = 1.72, CI = 1.06–2.80, p = 0.03.
*2. Small network size: OR = 1.28, CI = 0.80–2.04, p = 0.31.
*3. Low emotional support received: OR = 1.93, CI = 1.13–3.29, p = 0.02.
*4. High affiliation need: OR = 1.01, CI = 0.92–1.11, p = 0.85.
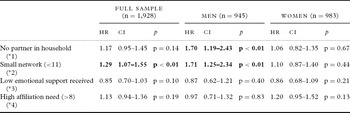
In Table 4, the results for onset of depression in the follow-up sample are shown, adjusted for age and gender. In the Cox regression analyses in the sample without depression at baseline (CES-D ≤ 12), a higher onset of depression in the follow-up period of 13 years was found in respondents without a partner in the household and in those with a small network at baseline, but not in respondents with low emotional support, or with a high affiliation need. Separate analyses for men and women showed a statistically significant association with onset of depression for living without a partner in the household and for having a small network in men, but not in women.
Cox regression analyses with hazard ratios with 95% confidence intervals of onset of depression with social support and need for affiliation, adjusted for age and gender, in the full sample and in men and women (p < 0.05)

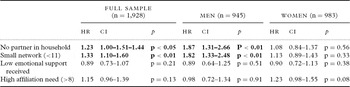
In Table 5, results of the multivariate analyses for onset of depression in the follow-up sample are shown, with controlling for the confounding variables. In the Cox regression analyses in the sample without depression at baseline (CES-D ≤ 12), a higher onset of depression in the follow-up period of 13 years was found in respondents with a small network at baseline, but not in respondents without a partner in the household, with low emotional support, or with a high affiliation need. Separate analyses for men and women showed an association with onset of depression for living without a partner in the household and for having a small network in men, but not in women.
Cox regression analyses with hazard ratios with 95% confidence intervals of onset of depression with social support and need for affiliation, adjusted for age, gender, level of education, cognitive impairment, and functional limitations, in the full sample and in men and women (p < 0.05)

Interactions of gender with:
*1. No partner in the household: HR = 1.99, CI = 1.32–3.00, p < 0.01.
*2. Small network size: HR = 1.69, CI = 1.15–2.50, p < 0.01.
*3. Low emotional support received: HR = 0.89, CI = 0.44–1.81, p = 0.74.
*4. High affiliation need: HR = 1.27, CI = 0.87–1.88, p = 0.22.
A statistically significant interaction effect of gender on onset of depression was found for not having a partner in the household and for small network size, with men being more likely to become depressed than women with these characteristics. Test statistics of the interactions for gender are shown in the footnotes of Table 5.
Discussion
In the present study on gender differences in the relation between social support and depression in a population sample of 2,823 Dutch citizens aged 55–85 years, we observed associations of depression in later life with several social support measures and need for social affiliation, and gender differences in these associations.
Women were found to be more often depressed than men. Respondents without a partner in the household and with a small network showed higher depression rates than those living with a partner and with a large network. These findings correspond with the literature on depression in the elderly (Blazer, Reference Blazer1989; Harlow et al., Reference Harlow, Goldberg and Comstock1991; Copeland et al., Reference Copeland1992; NIH Consensus Development Conference, 1992; Blazer, Reference Blazer, Schneider, Reynolds, Lebowitz and Friedhoff1994; Mendes de Leon et al., Reference Mendes de Leon, Kasl and Jacobs1994; Beekman et al., Reference Beekman, Deeg, Van Tilburg, Smit, Hooijer and Van Tilburg1995; Cole et al., Reference Cole, Bellavance and Mansour1999; Cole and Dendukuri, Reference Cole and Dendukuri2003). Depression was also associated with having a high need for social affiliation. These associations persisted after adjustment for age, gender, education, cognitive impairment, and functional limitations.
Although women were found to be more often depressed than men, the associations between depression and some of the social support measures were stronger for men than for women. Men without a partner in the household or with low emotional support received were more vulnerable for depression than women. Vulnerability for depression associated with a small network size was equal for men and women. On the other hand, a high need for affiliation was associated with depression only in women and not in men.
In the prospective analyses, male respondents living without a partner in the household and having a small network were more likely to experience onset of depression than women.
So, men without a partner in the household appeared to be more vulnerable for prevalence and onset of depression than women. However, due to more frequent partner loss, women experience the lack of a partner in the household more often than men, which explains the female preponderance in depression in this respect.
Considering the role of need for affiliation, older persons with a high need for affiliation were found to be more likely to have depression than those with a low affiliation need. As noted earlier, an explanation of this finding may be that people who are depressed have higher scores on affiliation need, because they feel more in need for support due to their low mood. Thus, a high affiliation need may be part of the depressive syndrome. Our finding that having a higher need for affiliation did not predict the onset of depression provides some support for this explanation. In the literature, need for affiliation is not considered to be a fixed personality trait, but a lasting pattern of conceptions about what is needed and desirable for a person. When one's personal circumstances are not in accordance with these needs and wishes, people may attempt to adjust their situation (e.g. by searching for new friends or a new partner), or they may lower their expectations about what they need (e.g. accepting that one has no partner anymore, and that this resource of support is no longer available). Changes in the need for affiliation are supposed to take time, and the capacity to change is likely to show considerable interpersonal variation. It is conceivable that particularly those persons who have a high affiliation need, and are incapable to adjust this need to a lower level when social support has declined, are at risk for depression. Our results showed that low support – a well-known risk factor for depression – and high need for social affiliation both increased the risk for depression, and they may enhance each other. In our study sample, 351 respondents had low social support, and 79 of these respondents had a high need for affiliation. One-third of these were men. In this group with low support combined with a high affiliation need, 29.1% were depressed, with a preponderance in men (34.6%) compared to women (26.4%). These gender differences were not statistically significant, due to the small numbers, but these percentages are much higher than in the full sample, particularly in men, and they may be of clinical importance. So, when aiming to identify older persons at risk for depression for preventive strategies, we should target the subgroup with low support and with a high affiliation need.
Strengths of the present study include its large sample size, with comparatively low attrition at follow-up, and its balanced gender ratio, especially in older age groups.
In addition, several potential limitations also need to be addressed. We investigated the quality of the social network mostly by applying quantitative measures: the availability of a partner and the network size. Although we asked the respondents to identify important network members only, it is possible that the respondent was not satisfied about the content and the quality of these factors. A person may have a small but very supportive network, or alternatively a large but superficial network and/or a not very supportive spouse. To minimize these problems we included a third measure, received emotional support, which reflected the quality of the relationship. Another problem may be that we underestimated the true prevalence of depression in the follow-up sample due to the fluctuating course of depression relative to the three-year interval between every follow up cycle.
In conclusion, older women had a higher prevalence of depression than older men. Older people without a partner in the household, with a small network, and with low emotional support were more likely to experience depression, with men having higher rates of depression than women in these conditions. A high need for social affiliation was associated with depression, but only in women. Lack of a partner in the household and having a small network predicted onset of depression in men but not in women. In a subgroup with low social support and high affiliation need, high rates of depression were found, particularly in men. Considering the serious consequences of depression, it is important to focus on older people with these characteristics, with the aim of helping them to increase their social support, or to accept the deficiency in support and adjust their needs.
Conflict of interest
None.
Description of authors' roles
C. Sonnenberg designed the study, assisted in the data collection, carried out the statistical analyses of the data, and wrote the paper. D. Deeg and A. Beekman supervised the data collection and the statistical design of the study, and assisted with the statistical analyses and writing the paper. T. van Tilburg and D. Vink carried out part of the data collection and the statistical design and assisted with writing the paper. M. Stek assisted with writing the paper.
Acknowledgments
We acknowledge funding of the data collection of the baseline study by the Dutch Ministry of Welfare and Sports.