



1. Introduction
The movement of dry cohesionless granular material is an emerging issue that occurs in various applicable fields, such as landslide analysis in geotechnical engineering and powder blending in the pharmaceutical industry. The behaviour of the material is complicated by the transition between the solid-like and fluid-like states. In some configurations, the fluid-like and solid-like regions can co-exist, such as granular column collapse which is a typical granular flow phenomenon in this research area.
To study granular column collapse, the granular material is initially confined by plates which are removed rapidly to trigger the flow. In the granular flow, there are two distinguishable regions, the quasi-static region in the centre surrounded by the flowing region. When the flow is in the dense regime, inertia and deformation can both contribute to the behaviours of the material. With energy being dissipated throughout the motion, the granular material transitions from the fluid-like to solid-like state. The flow characteristics in granular column collapse have been extensively studied experimentally. Lube et al. (Reference Lube, Huppert, Sparks and Hallworth2004, Reference Lube, Huppert, Sparks and Freundt2005) conducted experiments on the axisymmetric granular column collapse by using different materials such as sand, salt, couscous, sugar and rice. They found that three flow patterns can be distinguished by different aspect ratios, and a piecewise relationship between the aspect ratio and runout distance is obtained. Lajeunesse, Mangeney-Castelnau & Vilotte (Reference Lajeunesse, Mangeney-Castelnau and Vilotte2004) studied the spreading of glass beads over a horizontal plane by varying the initial aspect ratio, property of the underlying substrate and diameter of the granular material. Their research demonstrated that the deposit morphology is mainly affected by the initial aspect ratio regardless of substrate properties and size of the glass beads. They further investigated the granular column collapse caused by glass beads on a horizontal surface in the rectangular channel and semicircular tube, with a focus on the internal flow structure. Their study indicated that the velocity is in a linear relationship with the depth of the flowing layer and exponentially decreases with depth in the quasi-static layer (Lajeunesse, Monnier & Homsy Reference Lajeunesse, Monnier and Homsy2005). Siavoshi & Kudrolli (Reference Siavoshi and Kudrolli2005) investigated the failure of a granular step composed of steel beads and found that the final shape of the surface is almost linear regardless of the grain size. Balmforth & Kerswell (Reference Balmforth and Kerswell2005) conducted an experimental investigation for the granular column collapse inside rectangular channels with different widths. In their study, the final height and runout distance of the deposit were related to the initial aspect ratio but described with different power laws for different widths of the channel. Lube et al. (Reference Lube, Huppert, Sparks and Freundt2007) conducted experiments of granular column collapse in a wide rectangular channel to study the variation of the interface between static and flowing regions, and found that interface variation is a function of the initial aspect ratio.
Granular column collapse can be modelled by the discrete element method (DEM), in which the grains are treated as solid elements with translational and angular movements. Staron & Hinch (Reference Staron and Hinch2005) employed the two-dimensional (2-D) contact dynamics method to simulate the granular column collapse, in which the power law between the aspect ratio and runout distance is reproduced. Girolami et al. (Reference Girolami, Hergault, Vinay and Wachs2012) used DEM to simulate the three-dimensional (3-D) granular column collapse with different aspect ratios along a rough horizontal surface. In their simulations, the flow characteristics, which include the runout distance, temporal flow evolution, deposit morphology and internal flow structure, were quantitatively reproduced.
However, DEM handles each grain individually resulting in a high computational cost. In contrast, the granular flow can be modelled at the continuum level by using a continuum approach, in which each computational element can contain several physical grains. Thus, computational efficiency can be improved, especially for large-scale simulations. In the continuum approach, the method of computational fluid dynamics can be employed to calculate the granular flow. Crosta, Imposimato & Roddeman (Reference Crosta, Imposimato and Roddeman2009) simulated the 2-D granular column collapse over the erodible and non-erodible surface by using the finite element method (FEM) with the Mohr–Coulomb yield rule and non-associate flow rule. Their numerical study reproduced the final deposit profiles for collapse with various aspect ratios. Lacaze & Kerswell (Reference Lacaze and Kerswell2009) modelled the 3-D cylinder granular column collapse for the first time by using the μ(I) rheology, in which the flow regimes and scaling laws for the final deposit are reproduced. The granular column collapse was simulated to validate the μ(I) rheology by solving the 2-D Navier–Stokes equations through the finite volume method (FVM) with the volume of fluid (VOF) tracking the free surface (Lagrée, Staron & Popinet Reference Lagrée, Staron and Popinet2011).
The method of FEM or FVM requires generating meshes in the entire computational domain, in which the quality of the meshes can directly affect the accuracy of the numerical results. Moreover, the free surface in granular column collapse is difficult to replicate using these mesh-based methods and extra numerical techniques, such as VOF, need to be implemented to calculate the free surface (Lagrée et al. Reference Lagrée, Staron and Popinet2011). In contrast, the Lagrangian or coupled Eulerian–Lagrangian method can easily identify the free surface without additional numerical techniques. Mast et al. (Reference Mast, Arduino, Mackenzie-Helnwein and Miller2015) analysed the 2-D sand column collapse by using the material point method (MPM) with the Matsuoka–Nakai constitutive model, in which the net deformation, stress and base contact/reaction forces are examined. Peng et al. (Reference Peng, Guo, Wu and Wang2016) coupled the hypoplastic model and Bagnold-type relation into the mesh-free method of smoothed particle hydrodynamics (SPH) to account for the frictional contact and collision, which was validated by simulating the collapse of a granular pile.
In these simulations, the rheology is required to calculate the varied viscosity and stress in the flow when treating the material as a non-Newtonian fluid. The μ(I) rheology is developed by summarizing a series of experimental measurements in various configurations. It can reflect two time scales for the granular flow in the intermediate dense regime as the inertial and deformation time scales (MiDi Reference MiDi2004; Jop, Forterre & Pouliquen Reference Jop, Forterre and Pouliquen2006). The rheology has also been coupled into the mesh-free method to model granular column collapse. The granular-column-collapse problem as a flow configuration is simulated by incorporating the μ(I) rheology into MPM and the power-law scaling for the runout distance is recovered (Dunatunga & Kamrin Reference Dunatunga and Kamrin2015). Franci & Cremonesi (Reference Franci and Cremonesi2019) modelled the 3-D granular column collapse with a regularized μ(I) rheology in the particle finite element method (PFEM). Their numerical results showed a good agreement with experimental measurements along with the results from other numerical methods. Minatti & Paris (Reference Minatti and Paris2015) developed an SPH-based model with the μ(I) rheology, which was validated by modelling the granular column collapse. Xu & Jin (Reference Xu and Jin2016b) proposed a mesh-free method by incorporating the μ(I) rheology into the weakly-compressible moving particle semi-implicit method (WC-MPS) to simulate the granular column collapse. They also compared the free-surface profile and velocity distributions with the experimental observations and provided an in-depth discussion on the stress distribution in the flow (Xu et al. Reference Xu, Jin, Tai and Lu2017). The intermediate dense regime in the collapse could be reflected in their simulations. Their model was then used to simulate the collision of two adjacent collapsing granular columns, by comparison with experimental results in terms of free surface and velocity distribution. They also analysed the energy variation in the granular flow (Xu, Jin & Tai Reference Xu, Jin and Tai2019). Their method was shown to simulate the granular flow on an inclined plate by Rufai, Jin & Tai (Reference Rufai, Jin and Tai2019).
However, the μ(I) rheology is a local model in which the stress is merely determined by the local shear deformation. Although it can describe flow behaviours in the intermediate dense regime, it is difficult to reflect the phase transition from the fluid-like to solid-like state. In the solid-like state, inertia becomes weaker, and the formation of intra-networks among grains increases. This involves intermittent flow and hysteretic phenomenon, and the μ(I) rheology is difficult to reflect the solid-like state in the granular flow (Jop et al. Reference Jop, Forterre and Pouliquen2006). By using the μ(I) rheology in MPM, Dunatunga & Kamrin (Reference Dunatunga and Kamrin2015) observed that it can take a long time for the material at the free surface to stop in the true continuum limit. In their simulation, a thin slow-moving layer of particles occurred at the free surface even when the displacement appeared to be small. Pouliquen & Forterre (Reference Pouliquen and Forterre2009) also pointed out that the μ(I) rheology is not sufficiently capable of capturing flow properties when the material is quasi-static. In the simulations by the mesh-free method of WC-MPS (Xu & Jin 2016; Xu et al. Reference Xu, Jin and Tai2019), there are obvious discrepancies for the free surface comparison in the final stage when the flow becomes quasi-static. The simulated free surface profiles were demonstrated to be much flatter owing to the non-negligible unphysical motion for the flow in the solid-like state.
Modelling the entire granular flow process from the fluid-like to solid-like state is a challenge while developing a constitutive law to handle phase transition in granular flow is still ongoing. Peridynamics is a non-local theory in solid mechanics, in which the long-range force and force exchange are adopted to model the interaction between continuous bodies and discrete grains (Silling & Askari Reference Silling and Askari2005; Silling et al. Reference Silling, Epton, Weckner, Xu and Askari2007). It has been widely used to simulate crack initiation and propagation as a non-local modelling technique, such as dynamic crack growth around a still inclusion (Agwai, Guven & Madenci Reference Agwai, Guven and Madenci2011), rupture phenomena in bio-membranes (Taylor et al. Reference Taylor, Gözen, Patel, Jesorka and Bertoldi2016) and failure in a Brazilian disk (Gu & Wu Reference Gu and Wu2016). Peridynamics has been incorporated into the MPS method to calculate the dam-break flow (Wang & Zhang Reference Wang and Zhang2018). Ren et al. (Reference Ren, Fan, Bergel, Regueiro, Lai and Li2015) coupled peridynamics into SPH to simulate soil fragmentation by buried explosions. They found that the coupled model can simulate the complex fragmentation process of soil. Bessa et al. (Reference Bessa, Foster, Belytschko and Liu2014) established a link between peridynamics and the moving least-squares reproducing kernel particle method (RKPM).
In the granular flow, when the material is in the solid-like state, the stress not only depends on the local shear rate but also the stress of the neighbouring grains in the distance to the surface and bottom (Staron et al. Reference Staron, Lagrée, Josserand and Lhuillier2010). Shear motion in the material can trigger shear motion at different locations by stress fluctuation. To address this, Pouliquen & Forterre (Reference Pouliquen and Forterre2009) proposed a constitutive equation in the integral form over the entire flow. Peridynamics is regarded as a non-local simulation method which solves the integrated equation of motion in the peridynamic horizon. In the method, the force state is used by considering all the bonds between the local element and the neighbouring elements. Thus, the force used in peridynamics is a long-range force that can affect the force of other elements in the entire flow by the force exchange layer by layer. In this manner, the interaction between grains in the stress calculation can be reflected by peridynamics.
This study aims to incorporate the non-local theory of peridynamics into the mesh-free method WC-MPS with a detailed examination of its ability to calculate the entire process in granular column collapse from the fluid-like to the solid-like state. The free surface can be automatically tracked by the mesh-free method (Koshizuka, Nobe & Oka Reference Koshizuka, Nobe and Oka1998; Shakibaeinia & Jin Reference Shakibaeinia and Jin2010). The pressure field is determined by an equation of state based on the particle number density (Shakibaeinia & Jin Reference Shakibaeinia and Jin2010; Xu & Jin Reference Xu and Jin2016a). The μ(I) rheology is applied to calculate the effective viscosity and stress in the granular flow. In the simulations, the free surface evolution in the granular column collapse is compared with the experimental observations, with the focus on the free surface and velocity variations in the solid-like state. The simulation is also compared with the previous local modelling without incorporation of peridynamics (Xu et al. Reference Xu, Jin, Tai and Lu2017; Xu et al. Reference Xu, Jin and Tai2019). This illustrates that peridynamics in the mesh-free method can reproduce the free surface and internal motion in both the fluid-like and solid-like states in the granular flow. The collision of two adjacent collapsing columns is then modelled, in which the interface between materials from each collapsing column can be identified owing to the Lagrangian nature of the method. This validates the incorporation of peridynamics in the mesh-free method to reflect the internal flow characteristics in the flow. The plane Couette granular flow in the presence of gravity is further modelled by the non-local mesh-free method to examine the velocity distribution in the sheared granular flow.
The study is organized as follows. Section 2 presents the governing equations and mesh-free discretization. In § 3, the peridynamic theory with the constitutive law for the granular flow is introduced. Section 4 examines the peridynamic horizon and particle distance effect by simulating a granular column collapse. Numerical examples of granular column collapse and collision of two adjacent collapsing columns are illustrated respectively in §§ 5 and 6 with comparison of the numerical results with those from experimental measurements, local modelling and FEM modelling. Finally, in § 7 we present the conclusions by incorporating peridynamics in the mesh-free method to simulate the granular flows.
2. Governing equations and mesh-free discretization
This section presents the governing equations in the Lagrangian framework and the mesh-free discretization. We use the term ‘particle or Lagrangian particle’ to represent the discretized material point or the computational element in the mesh-free method, indexed by i and j. The physical particles are termed as ‘grain’ to represent the individual granular material. The vector and tensor are denoted in bold while the scalar in italic.
2.1. The governing equations
The granular material is treated as the bulk fluid with the bulk density defined asρ = φρs, whereφ is the volume fraction and ρs is the density of the grains. In granular column collapse, the volume fraction has a small variation in the range 0.59–0.65 (Lajeunesse et al. Reference Lajeunesse, Mangeney-Castelnau and Vilotte2004; Lajeunesse et al. Reference Lajeunesse, Monnier and Homsy2005), so φ is assumed to be constant as φ = 0.62, which results in a constant bulk density. Thus, the bulk fluid for the granular material is modelled as an incompressible fluid, with the governing equations in the Lagrangian framework expressed as (Minatti & Paris Reference Minatti and Paris2015; Xu et al. Reference Xu, Jin and Tai2019)
 \begin{gather}\boldsymbol{\nabla }\boldsymbol{\cdot }\boldsymbol{u} = 0,\end{gather}
 \begin{gather}\rho \frac{{\textrm{D}\boldsymbol{u}}}{{\textrm{D}t}} ={-} \boldsymbol{\nabla }p + \boldsymbol{\nabla }\boldsymbol{\cdot }\boldsymbol{\tau } + \rho \boldsymbol{g},\end{gather}
where t is the time, u is the velocity vector, p is the pressure, τ is the deviatoric shear stress  $\boldsymbol{\tau } = \eta \gamma$ (γ is the strain rate tensor), g is the external force such as gravity and D/Dt indicates the Lagrangian derivative operator. To calculate the continuity condition, an equation of state is used, and the incompressible fluid is assumed to be weakly compressible with a compressibility of less than 1 %.
2.2. Mesh-free discretization
The spatial operators are adopted in the framework of the MPS (Koshizuka et al. Reference Koshizuka, Nobe and Oka1998; Gotoh & Khayyer Reference Gotoh and Khayyer2016; Xu & Jin Reference Xu and Jin2016a). By using the mesh-free method, the granular material is represented by a set of Lagrangian particles with the same initial distance Δl, being the continuum-level markers. Similarly, the solid boundary to confine the granular material is also discretized into the particles with the same distance Δl. The interaction between these Lagrangian particles is realized by using a weighting function and the weighting function wij used in this study is expressed as (Shakibaeinia & Jin Reference Shakibaeinia and Jin2010)
 \begin{equation}{w_{ij}} = w({r_{ij}},{r_e}) = \left\{ {\begin{array}{@{}ll} {{{\left( {1 - \dfrac{{{r_{ij}}}}{{{r_e}}}} \right)}^3}}&{{r_{ij}} \le {r_e}}\\ 0&{{r_{ij}} \gt {r_e}} \end{array}} \right..\end{equation}
The weighting function constitutes the interaction radius re and the distance rij between two Lagrangian particles indexed by i and j. The interaction radius re determines the interaction circle in two dimensions, which marks the neighbouring particles j for the target particle i according to the distance rij. For the neighbouring particles j at rij > re, their interaction to particle i is assumed to be negligible. This enables an avoidance of the calculation of all the Lagrangian particles in the whole domain when calculating the information of the target particle i. The interaction radius re is usually related to the discretized particle distance Δl, so that the number of neighbouring particles j can be effectively and efficiently identified. The spatial operators in the method, such as the gradient, divergence and Laplacian models, were developed by counting contributions from the neighbouring particles with the weighting function. A large re can involve a large number of neighbouring particles j, which can improve the accuracy for the spatial operator calculation but reduce the computing efficiency. For a small re, the number of neighbouring particles and computational cost can be reduced but the accuracy is eliminated. To balance between accuracy and efficiency, the interaction radius is usually set to be re = (3.0–4.0)Δl in the previous studies (Monaghan Reference Monaghan1994; Koshizuka et al. Reference Koshizuka, Nobe and Oka1998; Lee et al. Reference Lee, Park, Kim and Hwang2011; Gotoh & Khayyer Reference Gotoh and Khayyer2016; Violeau & Rogers Reference Violeau and Rogers2016; Xu & Jin Reference Xu and Jin2016a).
In the MPS method, the particle number density is defined as the summation of the weighting function as (Koshizuka et al. Reference Koshizuka, Nobe and Oka1998)
 \begin{equation}{N_i} = \mathop \sum \limits_{j \ne i} {w_{ij}}.\end{equation}
The number of particles in a unit volume ρn can be approximated by the particle number density as (Koshizuka et al. Reference Koshizuka, Nobe and Oka1998)
 \begin{equation}{\rho _n} = \frac{{{N_i}}}{{\int {w\,\textrm{d}V} }},\end{equation}
where the integration at the right-hand side for the weighting function is over the entire domain and the integration is constant for a fixed interaction radius re. Thus, the fluid density can be expressed as
 \begin{equation}{\rho _i} = m{\rho _n} = \frac{{m{N_i}}}{{\int {w\,\textrm{d}V} }},\end{equation}
where m represents the mass that a particle takes. Equation (2.6) indicates that the fluid density is proportional to the particle number density Ni, which can be used in the equation of state to calculate the pressure field.
When the interaction circle for the weighting function is full of Lagrangian particles with the same distance Δl, the particle number density is referred to as the initial particle number density N 0. It is constant throughout the calculation.
The spatial operator to calculate the gradient is written as (Koshizuka et al. Reference Koshizuka, Nobe and Oka1998)
 \begin{equation}\langle \boldsymbol{\nabla }{\phi _i}\rangle = \frac{{{D_m}}}{{{N_0}}}\mathop \sum \limits_{j \ne i} \frac{{{\phi _j} - {\phi _i}}}{{r_{ij}^2}}{\boldsymbol{r}_{ij}}{w_{ij}},\end{equation}
where ϕ is a scalar, Dm is the dimension of space and rij is the vector from particle i to particle j. This gradient model is used to calculate the shear rate and the velocity gradient in the proposed numerical scheme, and the interaction radius is defined as  ${r_e} = 4.0\Delta l$ to ensure its accuracy.
To calculate the pressure, an equation of state is employed, and the granular flow is assumed to be weakly compressible. The equation of state based on the particle number density is expressed as (Shakibaeinia & Jin Reference Shakibaeinia and Jin2010; Xu & Jin Reference Xu and Jin2016a)
 \begin{equation}{p_i} = \frac{{\rho c_0^2}}{\lambda }\left( {{{\left( {\frac{{{N_i}}}{{{N_0}}}} \right)}^\lambda } - 1} \right),\end{equation}
where λ = 7, according to the previous studies (Monaghan Reference Monaghan1994; Shakibaeinia & Jin Reference Shakibaeinia and Jin2010; González-Cao et al. Reference González-Cao, Altomare, Crespo, Domínguez, Gómez-Gesteira and Kisacik2019), and c 0 is the artificial speed of sound. The value of c 0 sets a requirement for the time step in the simulation. A much larger c 0 means that a much smaller time step should be implemented by using the equation of state. Here, c 0 also determines the compressibility when modelling the incompressible fluid flow. To balance between the time step and the compressibility for modelling the incompressible fluid, c 0 is defined as 10 times the maximum velocity in the problem (Monaghan Reference Monaghan1994; Violeau & Rogers Reference Violeau and Rogers2016; González-Cao et al. Reference González-Cao, Altomare, Crespo, Domínguez, Gómez-Gesteira and Kisacik2019). This can limit the compressibility for the modelled incompressible fluid to within 1 % with an acceptable time step (Monaghan Reference Monaghan1994). Velocity in the solid-like state for the granular flow is very small and defining c 0 10 times the maximum velocity is sufficient to ensure the incompressibility for the flow. In this study, the time step satisfies the Courant–Friedrichs–Lewy condition (Shadloo et al. Reference Shadloo, Zainali, Yildiz and Suleman2012).
The mesh-free method is based on the Lagrangian approach, which updates the positions of the Lagrangian particles in each time step. However, during the movement of particles, some particles can approach each other making their distance much shorter than the initial distance Δl. If there is no numerical technique to prevent further joining, clustering of particles can occur, which results in an instability for the calculation. To solve this problem, a collision model is proposed to keep particles from clustering in the simulation (Lee et al. Reference Lee, Park, Kim and Hwang2011). When the distance between two particles rij is shorter than a threshold, the collision is activated to maintain the particle distance. The threshold is defined as the collision distance, which is equal to dcoll = (0.85–0.95)Δl according to the previous studies (Lee et al. Reference Lee, Park, Kim and Hwang2011; Shakibaeinia & Jin Reference Shakibaeinia and Jin2012), and dcoll = 0.9Δl is selected in this study. The collision model is expressed as (Shakibaeinia & Jin Reference Shakibaeinia and Jin2012)
 \begin{equation}\left\{ {\begin{array}{@{}ll} {\boldsymbol{u}_i^{new} = {\boldsymbol{u}_i} - {\textstyle{1 \over 2}}u_{ij}^{/{/}}{\boldsymbol{e}_{ij}}}\\ {\boldsymbol{u}_j^{new} = {\boldsymbol{u}_j} - {\textstyle{1 \over 2}}u_{ij}^{/{/}}{\boldsymbol{e}_{ij}}} \end{array}} \right.\quad {r_{ij}} \lt 0.9\Delta l,\end{equation}
where  $u_{ij}^{/{/}}$ is the approaching velocity between particles i and j, and eij is the unit vector to project the approaching velocity
 $u_{ij}^{/{/}}$ to the vectors ui and uj.
The positions of the two particles i and j are updated according to the collision velocity as
 \begin{equation}\left\{ {\begin{array}{@{}ll} {\boldsymbol{r}_i^{new} = {\boldsymbol{r}_i} - {\textstyle{1 \over 2}}u_{ij}^{/{/}}{\boldsymbol{e}_{ij}}\Delta t}\\ {\boldsymbol{r}_j^{new} = {\boldsymbol{r}_j} - {\textstyle{1 \over 2}}u_{ij}^{/{/}}{\boldsymbol{e}_{ij}}\Delta t} \end{array}} \right.\quad {r_{ij}} \lt 0.9\Delta l.\end{equation}
The free surface is recognized by the particle number density. When Ni is less than N 0, particle i is regarded as a free surface particle with zero pressure prescribed. The solid boundary is discretized into a set of particles with the same distance Δl. However, when using the spatial operator of the gradient model to calculate the shear rate and velocity gradient for a 2-D problem, the local interaction circle in the vicinity of the solid boundary is partially filled with particles. The area for the interaction circle beyond the solid boundary is empty. This can result in an inaccuracy when calculating the spatial operator. The problem also occurs when calculating the particle number density using (2.4). To offset the deficiency of the particles for the interaction circle close to the boundary, several layers of ghost particles are set-up beyond the solid boundary. The number of layers for the ghost particles is dependent on the interaction radius re, for example, for re = 4.0Δl, four layers of ghost particles are required to make the interaction circle full of particles. The flow properties of these ghost particles, such as velocity and pressure, are set to be the same as their solid particles. This solid boundary treatment has been implemented in many applications by the mesh-free method with good numerical results achieved (Koshizuka et al. Reference Koshizuka, Nobe and Oka1998; Ye et al. Reference Ye, Pan, Huang and Liu2019).
3. Peridynamic implementation
The peridynamic theory is applied to solve the equation of motion in which the rheological law is used to determine the effective viscosity and stress.
3.1. The rheological law
In the mesh-free method, a set of Lagrangian particles are used to represent the granular material, which carry the properties of density, velocity, stress, viscosity and so forth. The viscosity for the granular flow is not constant, which has a large variation in space and time (Da Cruz et al. Reference Da Cruz, Emam, Prochnow, Roux and Chevoir2005). In this study, the μ(I) rheology, developed by MiDi (Reference MiDi2004) and generalized into a tensorial version by Jop et al. (Reference Jop, Forterre and Pouliquen2006), is used to calculate the effective viscosity and stress in the granular flow. In the model, the friction μ is expressed as (MiDi Reference MiDi2004; Da Cruz et al. Reference Da Cruz, Emam, Prochnow, Roux and Chevoir2005)
 \begin{equation}\mu (I) = {\mu _s} + \frac{{{\mu _2} - {\mu _s}}}{{{I_0}/I + 1}},\end{equation}
where I 0 is a constant, μ is an increasing function with the dimensionless parameter I, bounded by μs at I = 0 and μ 2 at high I. For glass beads, the parameters are μs = tan21°, μ 2 = tan32° and I 0 = 0.3 in the rheology (Jop Reference Jop2015).
The shear rate is calculated as
 \begin{gather}{\gamma _{\alpha \beta }} = \frac{1}{2}\left( {\frac{{\partial {u_\alpha }}}{{\partial {x_\beta }}} + \frac{{\partial {u_\beta }}}{{\partial {x_\alpha }}}} \right),\end{gather}
 \begin{gather}|\gamma |= \sqrt {0.5{\gamma _{\alpha \beta }}{\gamma _{\alpha \beta }}} ,\end{gather}
where α and β denote the coordinate components, and |γ| is the second invariant for the strain rate tensor.
The inertial number I is defined according to the simulation by Ionescu et al. (Reference Ionescu, Mangeney, Bouchut and Roche2015), which is modified from the definition by MiDi (Reference MiDi2004) and Jop et al. (Reference Jop, Forterre and Pouliquen2006) owing to the shear rate calculation in (3.2)
 \begin{equation}I = \frac{{2d|\gamma |}}{{\sqrt {p/{\rho _s}} }},\end{equation}
where d is the diameter of the grains.
The effective viscosity can be obtained by the friction, confining pressure and shear rate as (Jop et al. Reference Jop, Forterre and Pouliquen2006)
 \begin{equation}\eta = \frac{{\mu (I)p}}{{|\gamma |}}.\end{equation}
A regularization technique is applied to calculate the viscosity in (3.5) based on the inertial number I in (3.4) and friction μ in (3.1) as (Chauchat & Médale Reference Chauchat and Médale2014)
 \begin{equation}{\eta _r} = \left( {{\mu_s} + \frac{{2({\mu_2} - {\mu_s})|\gamma |}}{{{I_0}\sqrt {p/({\rho_s}{d^2})} + 2|\gamma |}}} \right)\frac{p}{{\sqrt {|\gamma {|^2} + {\delta ^2}} }},\end{equation}
where δ is a very small value. This regularization technique for the μ(I) rheology is proposed by Chauchat & Médale (Reference Chauchat and Médale2014) to avoid the infinite value for the viscosity in (3.5) when |γ| is approaching zero for p > 0.0. In their study (Chauchat & Médale Reference Chauchat and Médale2014), the parameter is tested in the range 10−6 < δ < 10−4 to simulate the vertical-chute flow and good numerical results are obtained. In simulating granular column collapse, we found the free surface and velocity show limited difference for 10−6 < δ < 10−4, and thus δ = 10−6 s−1 is chosen in this study.
The rheological law expressed in (3.6) is a local model and its shortcoming includes the limitations in capturing the transition between the fluid-like and solid-like state (Jop et al. Reference Jop, Forterre and Pouliquen2006). As pointed out by Pouliquen & Forterre (Reference Pouliquen and Forterre2009), the quasi-static regime cannot be sufficiently reflected by the local model. However, to calculate the entire process for the collapse, the transition from the fluid-like to the solid-like state needs to be taken into consideration. Although many studies have been dedicated to developing the non-local rheological law (Pouliquen & Forterre Reference Pouliquen and Forterre2009; Bouzid et al. Reference Bouzid, Trulsson, Claudin, Clément and Andreotti2013, Reference Bouzid, Izzet, Trulsson, Clément, Claudin and Andreotti2015; Henann & Kamrin Reference Henann and Kamrin2013), reflecting the phase transition in the granular flow is still a challenge. However, peridynamics is a non-local theory which provides an approach to account for the interaction between grains.
3.2. Peridynamics
Peridynamics, as a generalization of the standard theory in solid mechanics, handles the mechanics with continuous bodies and discrete grains by including the long-range force (Silling & Askari Reference Silling and Askari2005; Silling et al. Reference Silling, Epton, Weckner, Xu and Askari2007; Silling & Lehoucq Reference Silling and Lehoucq2008; Mengesha & Du Reference Mengesha and Du2014; Ren et al. Reference Ren, Fan, Bergel, Regueiro, Lai and Li2015).
The integrated equation of motion in peridynamics is expressed as
 \begin{equation}\rho \ddot{\boldsymbol{r}} = \int_{{H_{\boldsymbol{x}}}} {\boldsymbol{F}(\boldsymbol{x},\boldsymbol{x^{\prime}},t)\,\textrm{d}{V_{\boldsymbol{x^{\prime}}}} + \rho \boldsymbol{g}} ,\end{equation}
where H x is a neighbourhood of x, x′ is the displacement vector and F is a pairwise force.
 \begin{equation}\boldsymbol{F}(\boldsymbol{x},\boldsymbol{x^{\prime}},t) = \boldsymbol{T}(\boldsymbol{x},\boldsymbol{x^{\prime}} - \boldsymbol{x},t) - \boldsymbol{T}(\boldsymbol{x^{\prime}},\boldsymbol{x} - \boldsymbol{x^{\prime}},t),\end{equation}
where T is the force state.
The equation of motion in the discretized form for the target particle i with neighbouring particles j in peridynamics can be expressed as (Silling & Lehoucq Reference Silling and Lehoucq2008; Ren et al. Reference Ren, Fan, Bergel, Regueiro, Lai and Li2015)
 \begin{equation}\rho \frac{{\textrm{D}{\boldsymbol{u}_i}}}{{\textrm{D}t}} = \sum\limits_{j \in {\varOmega _i}} {({\boldsymbol{T}_i} - {\boldsymbol{T}_j}) + \rho \boldsymbol{g}} ,\end{equation}
where Ωi is the peridynamic horizon for the target particle i, which is related to the particle distance Δl.
In peridynamics, based on the Lagrangian particles indexed by i and j, the force state Ti acting on the bond  ${\boldsymbol{r}_{ij}} = {\boldsymbol{r}_j} - {\boldsymbol{r}_i}$ (the vector from particle i to particle j) is defined as (Silling & Lehoucq Reference Silling and Lehoucq2008; Ren et al. Reference Ren, Fan, Bergel, Regueiro, Lai and Li2015)
 \begin{equation}{\boldsymbol{T}_i} = \boldsymbol{T}({r_{ij}}) = {w_{ij}}{\boldsymbol{\sigma }_i}\boldsymbol{\cdot }{\boldsymbol{r}_{ij}}\boldsymbol{\cdot }\boldsymbol{\mathsf{K}}_{ij}^{ - 1},\end{equation}
where σ is the stress and  $\boldsymbol{\mathsf{K}}$ is the shape tensor. The force state Tj from particle j to particle i acting on the bond
 ${\boldsymbol{r}_{ji}} = {\boldsymbol{r}_j} - {\boldsymbol{r}_i}$ can be obtained similarly according to (3.10).
The shape tensor  $\boldsymbol{\mathsf{K}}_{ij}$ is defined as
 \begin{equation}{\boldsymbol{\mathsf{K}}_{ij}} = \mathop \sum \limits_{j \in {\varOmega _i}} {w_{ij}}{\boldsymbol{r}_{ij}} \otimes {\boldsymbol{r}_{ij}}.\end{equation}
The stress σi is calculated as
 \begin{equation}{\boldsymbol{\sigma }_i} ={-} {p_i}\boldsymbol{\mathsf{E}} + 2{\eta _r}{\boldsymbol{\gamma }_i},\end{equation}
where  $\boldsymbol{\mathsf{E}}$ is the unit symmetric tensor.
The position of particle i is updated according to the following equation
 \begin{equation}\frac{{\textrm{D}{\boldsymbol{r}_i}}}{{\textrm{D}t}} = {\boldsymbol{u}_i}.\end{equation}
Incorporating peridynamics in the mesh-free method is advantageous to simulate granular column collapse. The free surface in the flow can be tracked automatically by the mesh-free method while peridynamics includes the long-range force and force exchange to describe behaviours between continuous bodies and discretized grains. One concern is how peridynamics accounts for the transition from the fluid-like to solid-like state and the subsequent solid-like state. In the solid-like state, the local stress not only depends on the local shear rate but also the stress of the neighbouring particles with in a distance. Hence, Pouliquen & Forterre (Reference Pouliquen and Forterre2009) proposed the self-activated model to include stress from the neighbouring particles over the entire flow. For peridynamics, the force state is calculated by (3.10), in which stress σi is related to the neighbouring particles by using the bond rij and the shape tensor  $\boldsymbol{\mathsf{K}}_{ij}$ within the peridynamic horizon. Moreover, peridynamics solves the integrated equation of motion in which the force interaction is implemented in (3.9). Hence, the forces of both the local force σi and the force from the neighbouring particles σj can contribute to the motion of the particles. Another concern is how peridynamics reflects the contribution of particles beyond the peridynamic horizon in the stress calculation, because (3.10) and integrated equation (3.9) are both merely conducted in the peridynamic horizon. This is critically important for the continuum approach in modelling granular flow because the peridynamic horizon can be varied by the particle distance Δl rather than a constant, which affects the force exchange in peridynamics. Although peridynamics only considers the long-range force state and its contribution to the motion of particles in the horizon, the force exchange can be realized in (3.9) through the horizon by the horizon. This makes the force from all the particles in the entire flow contribute to the motion of the target particle i. In this manner, peridynamics counts the stress contribution for the particles beyond the peridynamic horizon by incorporating the long-range force and force exchange.
To solve the governing equations, the predictor-and-corrector time splitting scheme is used in the method. In the predictor, the external force of gravity is solved to obtain the intermediate information, which includes the intermediate velocity u*, intermediate position r* and intermediate particle number density N*.
In the predictor, the equation of motion is solved as
 \begin{gather}\boldsymbol{u}_i^{\ast} = \boldsymbol{u}_i^k + \boldsymbol{g}\Delta t,\end{gather}
 \begin{gather}\boldsymbol{r}_i^{\ast} = \boldsymbol{r}_i^k + \boldsymbol{u}_i^\ast \Delta t,\end{gather}
where Δt is the time step and k denotes the previous time step.
With the intermediate velocity and position fields, the pressure field can be obtained by the equation of state (2.8) according to the intermediate particle number density N*. By using the rheological law, the stress of (3.12) is calculated to obtain the force state for particle i and j as Ti and Tj. Subsequently, in the corrector, the velocity is solved by using peridynamics and the position of the particles is updated according to the new velocity
 \begin{gather}\boldsymbol{u}_i^{k + 1} = \boldsymbol{u}_i^{\ast} + \frac{{\Delta t}}{\rho }\sum\limits_{j \in {\varOmega _i}} {({\boldsymbol{T}_i} - {\boldsymbol{T}_j})} ,\end{gather}
 \begin{gather}\boldsymbol{r}_i^{k + 1} = \boldsymbol{r}_i^k + \boldsymbol{u}_i^{k + 1}\Delta t,\end{gather}
where k + 1 is the next time step.
The flow chart with peridynamics in the mesh-free method is shown in figure 1. In the following, the proposed numerical scheme is referred to as the non-local mesh-free method or non-local modelling. It employs a global variable of the pairwise force in solving the equation of motion by using peridynamics so that the non-local mesh-free method can account for the interaction between continuous bodies and discrete elements. The interaction is significant in the phase transition from the fluid-like state to the solid-like state in granular column collapse, which can be reflected by the method.
Flow chart to calculate the granular flow with peridynamics in the mesh-free method. The predictor-and-corrector time splitting scheme is used to solve the governing equations. In the predictor, the external force of gravity is solved to obtain intermediate information. With the intermediate particle number density, the pressure field is calculated by the equation of state. In the corrector, the force state is calculated, and the intermediate velocity is corrected by solving the stress tensor term in the governing equations in the framework of peridynamics.

4. Parameter analysis by the granular column collapse
The non-local mesh-free method was used to simulate the granular column collapse, in which both the peridynamic horizon and numerical convergence/particle distance were examined. The numerical results were compared with the experimental measurements.
4.1. Numerical set-up
The simulated granular column collapse is illustrated in figure 2. The granular column was composed of glass beads with diameter d = 2 mm, ρs = 2500 kg m−3 and volume fraction φ = 0.62. A column with the height H and length L was initially confined by two plates in a rectangular channel, shown in figure 2(a). The plates were removed quickly at t = 0.0 s, and figure 2(b) shows the movement of the bottom of the two plates with time. The aspect ratio a is defined as a = H/0.5L, which plays an important role in the spreading behaviour of the granular material. In the simulation, the two plates were treated as the solid boundary with the prescription of the lifting velocity to model the slip boundary condition according to figure 2(b). In the μ(I) rheology, the parameters μs = tan21°, μ 2 = tan32° and I 0 = 0.3 were used (Jop et al. Reference Jop, Forterre and Pouliquen2006; Jop Reference Jop2015) and the simulation was conducted in two dimensions.
Numerical set-up for the granular column collapse: (a) diagram for the granular column collapse and (b) bottom position of the two plates when lifting them by using a weight according to the experiments (Xu et al. Reference Xu, Jin, Tai and Lu2017).

4.2. Peridynamic horizon
Maintaining the interaction radius re = 4.0Δl constant, the peridynamic horizon was varied as Ωi = 2.2Δl, 3.0Δl and 4.0Δl to simulate the granular column collapse with the aspect ratio a = 1.25 (H = 0.05 m and L = 0.08 m in figure 2). Figure 3 illustrates the free surface profiles at t = 0.12 s, 0.22 s and 0.42 s, calculated by using different peridynamic horizons, which were compared with the experimental measurements (Xu et al. Reference Xu, Jin, Tai and Lu2017). Generally, the free surface profiles using different peridynamic horizons were close to each other, and in good agreement with the experimental results. We observed that there were some discrepancies in the free-surface profiles occurring around the peak value. At t = 0.42 s, by using Ωi = 4.0Δl, the peak value for the free surface was y/L = 0.508 with a relative error of 8.8 % when compared with the experimental results. When using Ωi = 2.2Δl, it was equal to y/L = 0.474 with 1.5 % error at t = 0.42 s. Although the peak value with Ωi = 2.2Δl was closer to the experimental measurements at t = 0.42 s, it showed a continuously decreasing trend, as shown in figure 4, from t = 1.0 s to 3.0 s. At t = 1.0 s, the granular material behaved as the solid-like state and the peak value for the free surface should maintain a constant value. However, using Ωi = 2.2Δl, the peak value for the free surface reduced from y/L = 0.429 at t = 1.0 s to y/L = 0.391 at t = 2.0 s and even to y/L = 0.380 at t = 3.0 s, as shown in figure 4. This was because the force could not be sufficiently exchanged through the horizon by the horizon when using smaller peridynamic horizons such as Ωi = 2.2Δl. In contrast, the free surface with Ωi = 4.0Δl showed limited variation from t = 1.0 s to t = 3.0 s in the solid-like state. This was consistent with observation for the granular column collapse in the final stage of the collapse.
Free surface profiles simulated by using different peridynamic horizons for the granular column collapse with the aspect ratio a = 1.25: (a) at t = 0.12 s, (b) t = 0.22 s and (c) t = 0.42 s. The experimental free surface profiles are from Xu et al. (Reference Xu, Jin, Tai and Lu2017).

Free surface variation in the solid-like state for the granular column collapse a = 1.25 by using different peridynamic horizons: (a) Ωi = 4.0Δl and (b) Ωi = 2.2Δl.

By using Ωi = 4.0Δl in the non-local mesh-free method, the free surface variation in the granular column collapse especially in the solid-like state could be reproduced. To demonstrate the velocity calculation by the horizon Ωi = 4.0Δl in the granular flow, figure 5 shows the horizontal velocity profiles u/(gd)0.5 at t = 0.129 s and 0.189 s across the sections of y/L = 0.125 and 0.375, by comparison with the experimental measurements (Xu et al. Reference Xu, Jin, Tai and Lu2017). From the comparison, the velocity profiles in the granular flow were also reproduced by using the horizon in the numerical method. The velocity distributions in the simulation were in good agreement with the experimental results. Thus, the following simulations were conducted by using the peridynamic horizon Ωi = 4.0Δl in the non-local mesh-free method.
Velocity profiles at different time steps and sections calculated by the peridynamic horizon Ωi = 4.0Δl for the granular column collapse a = 1.25: (a) t = 0.129 s across the section y/L = 0.125, (b) t = 0.129 s across the section y/L = 0.375, (c) t = 0.189 s across the section y/L = 0.125 and (d) t = 0.189 s across the section y/L = 0.375. The experimental results are from Xu et al. (Reference Xu, Jin, Tai and Lu2017).

4.3. Particle distance effect
The effect of the particle distance for the non-local mesh-free method was examined by using different particle distances as L/Δl = 16, 32, 64 and 128 to simulate the granular column collapse a = 1.25. Figure 6 shows the free surface profiles simulated by using different particle distances, which were compared with the experimental measurements by Xu et al. (Reference Xu, Jin, Tai and Lu2017). The four particle distances implemented in the simulations calculated similar free surface profiles, especially on both sides of the collapsing column. As shown in figure 6(b,c), the main difference occurred on the top of the collapsing column in the range of −0.25 < x/L < 0.25, while the whole horizontal length for the column was larger than x/L > 2.0. The free surface using the larger particle distances, such as L/Δl = 16 and 32, agreed with the experimental results better for the value at the top of the column. The smaller particle distances, such as L/Δl = 64 and 128, overestimated the peak value for the free surface shown in figure 6(c) at t = 0.42 s. This was because the smaller particle distance merely represents a fraction of the grain in the simulation. Thus, one particle sliding down from the top of the column only indicates a small fraction of the grain movement, consequently resulting in an overestimation of the free surface. However, when refining the particle distance from L/Δl = 64 to 128, there was a limited change in the peak value for the free surface, as shown in figure 6(b,c). The peak value using L/Δl = 64 was y/L = 0.558, while it was y/L = 0.577 for L/Δl = 128 at t = 0.42 s.
Free surface simulated by using different particle distances of L/Δl = 128, 64, 32 and 16 at different time steps for the granular column collapse a = 1.25: (a) t = 0.12 s, (b) t = 0.22 s and (c) t = 0.42 s.

To further show the numerical convergence for the method, figure 7 illustrates the horizontal velocity profiles u/(gd)0.5 calculated by the different particle distances across the section y/L = 0.125 at t = 0.129 s and 0.189 s, by comparison with the experimental measurements. By using different particle distances Δl, the velocity profiles were generally close with each other in good agreement with the experimental measurements. By using the larger particle distance L/Δl = 16, the velocity profiles showed some fluctuations, but the fluctuations were still around the velocity profiles calculate by the smaller particle distances such as L/Δl = 128. Therefore, we can still conclude that the non-local mesh-free method exhibits a good numerical convergence.
Velocity distribution across the section y/L = 0.125 simulated by different particle distances for the granular column collapse a = 1.25 compared with the experimental measurements by Xu et al. (Reference Xu, Jin, Tai and Lu2017): (a) at t = 0.129 s and (b) t = 0.189 s.

5. Granular column collapse
In this section, two types of granular column collapse are numerically analysed. One type is the collapse at both sides simultaneously (figure 2) and the second type is the collapse occurring only at one side with the other side confined by a wall. The numerical results by the non-local mesh-free method are compared with those from the local modelling and FEM. The local modelling does not incorporate peridynamics but still uses spatial discretization of the MPS method. The comparison between local and non-local modelling aims to show the role of peridynamics in calculating the entire collapse process including the solid-like state.
5.1. Comparison with the local modelling
Two aspect ratios, a = 5.0 (H = 0.20 m and L = 0.08 m) and 1.25 (H = 0.05 m and L = 0.08 m) were modelled for the simultaneous collapse on both sides of the column, as illustrated in figure 2. In the simulations, L/Δl = 32. The numerical results by the non-local mesh-free method were compared with those from the local modelling (Xu & Jin Reference Xu and Jin2016b; Xu et al. Reference Xu, Jin, Tai and Lu2017). The local modelling did not apply peridynamics to solve the equation of motion, while the spatial discretization was still based on the MPS method (Xu & Jin Reference Xu and Jin2016; Xu et al. Reference Xu, Jin, Tai and Lu2017; Xu et al. Reference Xu, Jin and Tai2019). The governing equations were solved with the predictor-and-corrector time splitting scheme. In the predictor, the external force term and stress tensor term were solved to obtain the intermediate velocity  $\boldsymbol{u}_i^\ast $, intermediate particle position
 $\boldsymbol{r}_i^\ast $ and intermediate particle number density
 $N_i^\ast $ for all the particles. The pressure was obtained according to the intermediate flow information by using the equation of state. In the corrector, the pressure gradient term was solved to update the velocity and position of the particles. The method for the local modelling can be found in previous studies (Xu & Jin Reference Xu and Jin2016b; Xu et al. Reference Xu, Jin, Tai and Lu2017; Rufai et al. Reference Rufai, Jin and Tai2019; Xu et al. Reference Xu, Jin and Tai2019). One difference between the local and non-local modelling in the time splitting scheme was that the local modelling solved two terms, which were the viscous term and external force term, to obtain the intermediate information in the predictor. In contrast, the non-local modelling only calculated the external force term. Another difference was that the non-local modelling employed peridynamics to update the information in the corrector. The two methods adopted the same parameters to simulate the granular column collapses a = 1.25 and 5.0.
Figure 8 illustrates the free surface profiles from the non-local modelling, local modelling and experimental measurements (Xu et al. Reference Xu, Jin, Tai and Lu2017) for the collapse a = 1.25. The non-local modelling showed a good agreement with the experimental measurements. However, the local modelling calculated much flatter free surface profiles resulting in a big difference on the top of the collapsing column, which was evident at t = 0.22 s and 0.42 s. Figure 9 further shows the comparison of the free surface profiles among the non-local modelling, local modelling and experimental results at t = 0.20 s, 0.36 s and 0.67 s for the granular column collapse a = 5.0. Similar results to the collapse a = 1.25 were observed. The non-local modelling could reproduce more accurate free surface profiles in the collapse, especially in the solid-like state at t = 0.67 s. The local modelling underestimated the free surface on the top of the column, as shown in figure 9(c).
Comparison of the free surface profiles among non-local modelling, local modelling and experimental measurements by Xu et al. (Reference Xu, Jin, Tai and Lu2017) for the granular column collapse a = 1.25: (a) at t = 0.12 s, (b) t = 0.22 s and (c) t = 0.42 s.

Comparison of the free surface profiles among non-local modelling, local modelling and experimental measurements by Xu et al. (Reference Xu, Jin, Tai and Lu2017) for the granular column collapse a = 5.0: (a) at t = 0.20 s, (b) t = 0.36 s and (c) t = 0.67 s.

The particles in the local modelling showed further significant deformation when the granular material was in the solid-like state, which resulted in an underestimation of the top free surface for the final deposit in the granular column collapse. The velocity distribution can reveal the unphysical motion in the solid-like state because the velocity should be very small. Figure 10 shows the velocity distribution |u|/(gd)0.5 across the section y/L = 0.25 calculated by the local modelling and non-local modelling for the collapse a = 5.0 at t = 1.0 s when the material is in the solid-like state. The velocity in the local modelling was much larger than that in the non-local modelling, which was generally almost 4 times the velocity in the non-local modelling. Thus, the remaining significant velocity in the local modelling consequently made the particles unphysically move in the solid-like state, which underestimated the free surface. In contrast, the remaining velocity in the non-local modelling was negligible in the solid-like state and the calculated free surface agreed with the experimental results better, which has been shown in figures 8 and 9.
Horizontal velocity comparison between local and non-local modelling at t = 1.0 s across the section y/L = 0.25 in the granular column collapse a = 5.0.

The final deposits for the granular column collapses for a = 1.25 and 5.0 from the non-local and local modelling are shown in figure 11. Applying peridynamics in the mesh-free method as the non-local modelling resulted in a final deposit that was similar to the experimental observation for the two collapses. In comparison with the non-local modelling, the local modelling obtained a very flat deposit which was different from the experimental observation. This comparison showed that incorporation of peridynamics in the mesh-free method was able to reproduce the final deposit because it could reflect the transition from the fluid-like to the solid-like state. However, there was some pressure noise in the figure. In the simulation, the equation of state was used to calculate the pressure field and the fluid of the granular material was treated to be weakly compressible. To limit the incompressibility to within 1 %, the artificial speed of sound was implemented. From previous studies, by using the equation of state, noise in the pressure field can be produced in the simulation (Violeau & Rogers Reference Violeau and Rogers2016), which was also observed in figure 11 in the present study. There have been some techniques proposed to eliminate the pressure noise when modelling the water flow by using the weakly compressible scheme, such as the particle shifting technique (Khayyer, Gotoh & Shimizu Reference Khayyer, Gotoh and Shimizu2017) or velocity correction (Oger et al. Reference Oger, Marrone, Le Touzé and De Leffe2016; Xu & Jin Reference Xu and Jin2016a). However, there are concerns about energy and momentum conservation when using these techniques (Khayyer et al. Reference Khayyer, Gotoh and Shimizu2017). As a result of this reason, these techniques in eliminating the pressure noise were not used in the non-local mesh-free method and some noisy pressure values were consequently observed.
Snapshots of the final deposit for the granular column collapses (the dashed line represents the original shape for the column): (a) the non-local modelling for the granular column collapse a = 1.25, (b) the local modelling for the granular column collapse a = 1.25, (c) the non-local modelling for the granular column collapse a = 5.0 and (d) the local modelling for the granular column collapse a = 5.0.

5.2. Comparison with numerical results from the finite element method (FEM)
The granular column collapse occurring on one side was also simulated by the non-local mesh-free method and the numerical results were compared with those from FEM, in which the μ(I) rheology was reformulated in the framework of Drucker–Prager plasticity with the yield stress to calculate the viscosity and stress (Ionescu et al. Reference Ionescu, Mangeney, Bouchut and Roche2015). The laboratory experiment results by Mangeney et al. (Reference Mangeney, Roche, Hungr, Mangold, Faccanoni and Lucas2010) are presented for comparison. The initial set-up for the granular column was the height H = 0.20 m and length L = 0.14 m shown in figure 12. The column was composed of glass beads with the diameter d = 0.7 mm and a bulk density of 1550 kg m−3. To simulate the granular flow by the non-local mesh-free method, the particle distance was Δl = 0.0025 m and the parameters in the rheology for the glass beads were μs = tan21°, μ 2 = tan32° and I 0 = 0.3.
Diagram for the granular column collapse occurring on one side.

The free-surface profiles at t = 0.18 s, 0.30 s, 0.42 s and 1.02 s are shown in figure 13. The numerical results were compared with those from FEM (Ionescu et al. Reference Ionescu, Mangeney, Bouchut and Roche2015) and the experimental measurements (Mangeney et al. Reference Mangeney, Roche, Hungr, Mangold, Faccanoni and Lucas2010). The numerical results obtained by the non-local mesh-free method agreed well with the experimental measurements at t = 0.18 s, 0.30 s and 0.42 s. During the collapse, the material close to the left wall showed very limited motion and the free surface was almost constant at the initial height H = 0.14 m during the entire collapsing process (Mangeney et al. Reference Mangeney, Roche, Hungr, Mangold, Faccanoni and Lucas2010). The non-local mesh-free method could reproduce the movement of the granular material close to the left wall and the free surface remained almost constant in the collapse. Even at t = 1.02 s, when the flow was in the solid-like state, the height of the free surface close to the left wall simulated by the non-local mesh-free method was 0.138 m. Meanwhile, some discrepancies were observed in the vicinity of the wavefront in the granular flow when compared with the experimental measurements. In the mesh-free method, the granular material was discretized into a set of particles and there was a limited number of particles involved in the vicinity of the wavefront. This was observed in the free surface profiles shown in figure 13. Thus, the wavefront in the non-local modelling was shallower compared with the experimental results while FEM calculated a deeper wavefront in the granular flow.
Free surface comparison for the granular column collapse on one side among non-local modelling, FEM and the experimental measurements by Mangeney et al. (Reference Mangeney, Roche, Hungr, Mangold, Faccanoni and Lucas2010): (a) at t = 0.18 s, (b) t = 0.30 s, (c) t = 0.42 s and (d) t = 1.02 s.

6. Collision of two adjacent collapsing granular columns
Two adjacent collapsing granular columns can cause the granular material to collide and coalesce with each other. In this study, the collision of two adjacent collapsing granular columns with different aspect ratios was simulated by the non-local mesh-free method. To examine the role of peridynamics in the simulation, the numerical results from the local modelling were compared with those from the non-local modelling in the granular flow. The granular columns were composed of glass beads with the diameter d = 2 mm and bulk density ρ = 1550 kg m−3. The rheology parameters were the same as the material used in the above simulations, which were μs = tan21°, μ 2 = tan32° and I 0 = 0.3.
6.1. Numerical set-up
The numerical set-up for the collision of two adjacent collapsing granular columns is shown in figure 14(a). There were two granular columns with the left aspect ratio al = Hl/0.5Ll and the right aspect ratio ar = Hr/0.5Lr. The initial distance between the two columns is denoted as Ld. The two granular columns were initially confined by four plates. Instantaneous collapse occurred by lifting the plates, and the lifting velocity was prescribed according to the experimental measurements, as shown in figure 14(b). This granular flow has been simulated with the local modelling using the μ(I) rheology by Xu et al. (Reference Xu, Jin and Tai2019) without incorporation of peridynamics. Peridynamics was used in the mesh-free method as the non-local modelling in this study. Two cases for the collision with different aspect ratios were simulated. Case I had the following geometrical parameters: al = Hl/Ll = 3.9 (Hl = 0.156 m and Ll = 0.08 m), ar = Hr/Lr = 1.35 (Hr = 0.054 m and Lr = 0.08 m) and Ld = 0.04 m. Case II had the following geometrical parameters: al = 7.6 (Hl = 0.152 m and Ll = 0.04 m), ar = 3.8(Hr = 0.152 m and Lr = 0.08 m) and Ld = 0.04 m. For Case I, the free surface variation during the flow was examined whereas Case II focused on the interface evolution between each of the collapsing granular columns. For the experiment in Case II, two different colours of glass beads were used: white glass beads for the left column and black beads for the right column to distinguish the interface. Owing to the Lagrangian nature of the method in the simulation, the interface was easily identified in both the non-local and local modelling. We used the same parameters re = 4.0Δl and Δl = 0.002 m in the local and non-local modelling for the two cases.
Numerical set-up for the collision of two adjacent collapsing columns: (a) diagram for the granular flow and (b) bottom position of the four plates when lifting the plates according to the experimental measurements by Xu et al. (Reference Xu, Jin and Tai2019).

6.2. Flow pattern and free surface
For Case I, the non-local mesh-free method was applied to examine the detailed flow patterns and free surface variation in the granular flow. Figure 15 illustrates snapshots from the simulation by the non-local mesh-free method for Case I. The two columns collided and coalesced with each other, which resulted in an extended deposit. Before t = 0.25 s, consolidation of the two collapsing columns occurred and the free surface showed a large variation. In the simulation, the mesh-free method played an important role in capturing the free surface variation. From t = 0.50 s to t = 1.61 s, the flow was in the solid-like state because the shape for the coalesced column showed a limited change after t = 0.25 s. Peridynamics in the non-local mesh-free method captured the characteristics in the solid-like state, which showed a well-developed final deposit.
Snapshots at different time steps for the collision of two adjacent granular columns simulated by the non-local mesh-free method for Case I (The dashed line represents the original shape for the two granular columns): (a) t = 0.15 s, (b) t = 0.25 s, (c) t = 0.5 s, (d) t = 0.8 s, (e) t = 1.25 s and (f) t = 1.61 s.

Figure 16 shows the free surface profiles from the non-local and local modelling by comparison with the experimental measurements for Case I. In the intermediate dense regime for the granular flow, the two numerical results from the local and non-local modelling both showed similar free surface profiles and were in good agreement with the experimental measurements, such as at t = 0.1 s and 0.2 s. This was because the two methods both used the μ(I) rheology in the simulation. Subsequently, the flow transitioned into the solid-like state, and the non-local modelling accurately captured the free surface in good agreement with the experimental observation. However, large discrepancies were evident on the free surface from the local modelling compared with the experimental measurements, such as at t = 0.3 s and 0.4 s. Figure 17 illustrates the final deposit for the granular flow of Case I by the local modelling and non-local modelling. It was evident that incorporation of peridynamics as the non-local modelling can simulate a well-developed final deposit. In contrast, the local modelling resulted in a much flatter unphysical deposit.
Free surface profiles at different time steps from the non-local modelling and local modelling compared with the experimental measurements by Xu et al. (Reference Xu, Jin and Tai2019) for Case I (The dashed line represents the original shape for the two granular columns): (a) t = 0.1 s, (b) t = 0.2 s, (c) t = 0.3 s and (d) t = 0.4 s.

Final deposit for the collision of two adjacent granular columns of Case I (the dashed line represents the original shape for the two granular columns): (a) final deposit by the non-local modelling and (b) final deposit by the local modelling.

6.3. Interface evolution
Owing to the Lagrangian nature for both the non-local and local modelling, the interface between the two collapsing columns can be easily identified. We compared the interface evolution from the non-local and local modelling with the experimental observations for the granular flow of Case II. In the experiment, different colours of glass beads were used to capture the interface between each collapsing column by using a high-speed CMOS digital camera (IDT Corp, X-Stream) (Xu et al. Reference Xu, Jin, Tai and Lu2017; Xu et al. Reference Xu, Jin and Tai2019).
The interface variation indicates the internal particle behaviour within the granular flow. Thus, it can indicate whether the solid-like state is reflected in the simulation. Figure 18 illustrates the evolution of the interface at several time steps from the non-local modelling. During the collision, the particles could be identified from each collapsing column with a distinguishable interface. The interface developed to a constant height at t = 0.3 s. From the non-local modelling, less variation for the interface after t = 0.3 s was observed because the consolidated column was in the solid-like state. To clearly illustrate the interface variation, figure 19 shows the interface at different time steps for the granular flow of Case II by the local and non-local modelling, which are compared with the experimental measurements by Xu et al. (Reference Xu, Jin and Tai2019). The non-local modelling accurately reproduced the interface variation, which was in good agreement with the experimental results. However, the interface in the local modelling was severely deformed at t = 0.40 s and 0.60 s when the flow was in the solid-like state. The results from the local modelling had a big discrepancy compared with the experimental measurements. This arose from the significant unphysical internal motion of the particles in the solid-like state in the local modelling. In contrast, in the non-local modelling, the internal motion of the particles in the solid-like state was greatly eliminated by using peridynamics. Thus, in the non-local modelling, the interfaces at t = 0.40 s and 0.60 s appeared to be almost a vertical line, except for the particles in the vicinity of the free surface.
Interface variation during the collision of two adjacent granular columns simulated by the non-local mesh-free method for Case II (The dashed line represents the original shape for the two granular columns): (a) t = 0.1 s, (b) t = 0.3 s, (c) t = 0.5 s and (d) t = 1.5 s.

Interface variation at different time steps from the non-local modelling and local modelling for the collision of two adjacent granular columns (Case II) compared with the experimental results by Xu et al. (Reference Xu, Jin and Tai2019): (a) t = 0.15 s, (b) t = 0.20 s, (c) t = 0.40 s and (d) t = 0.60 s.

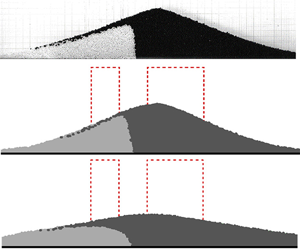
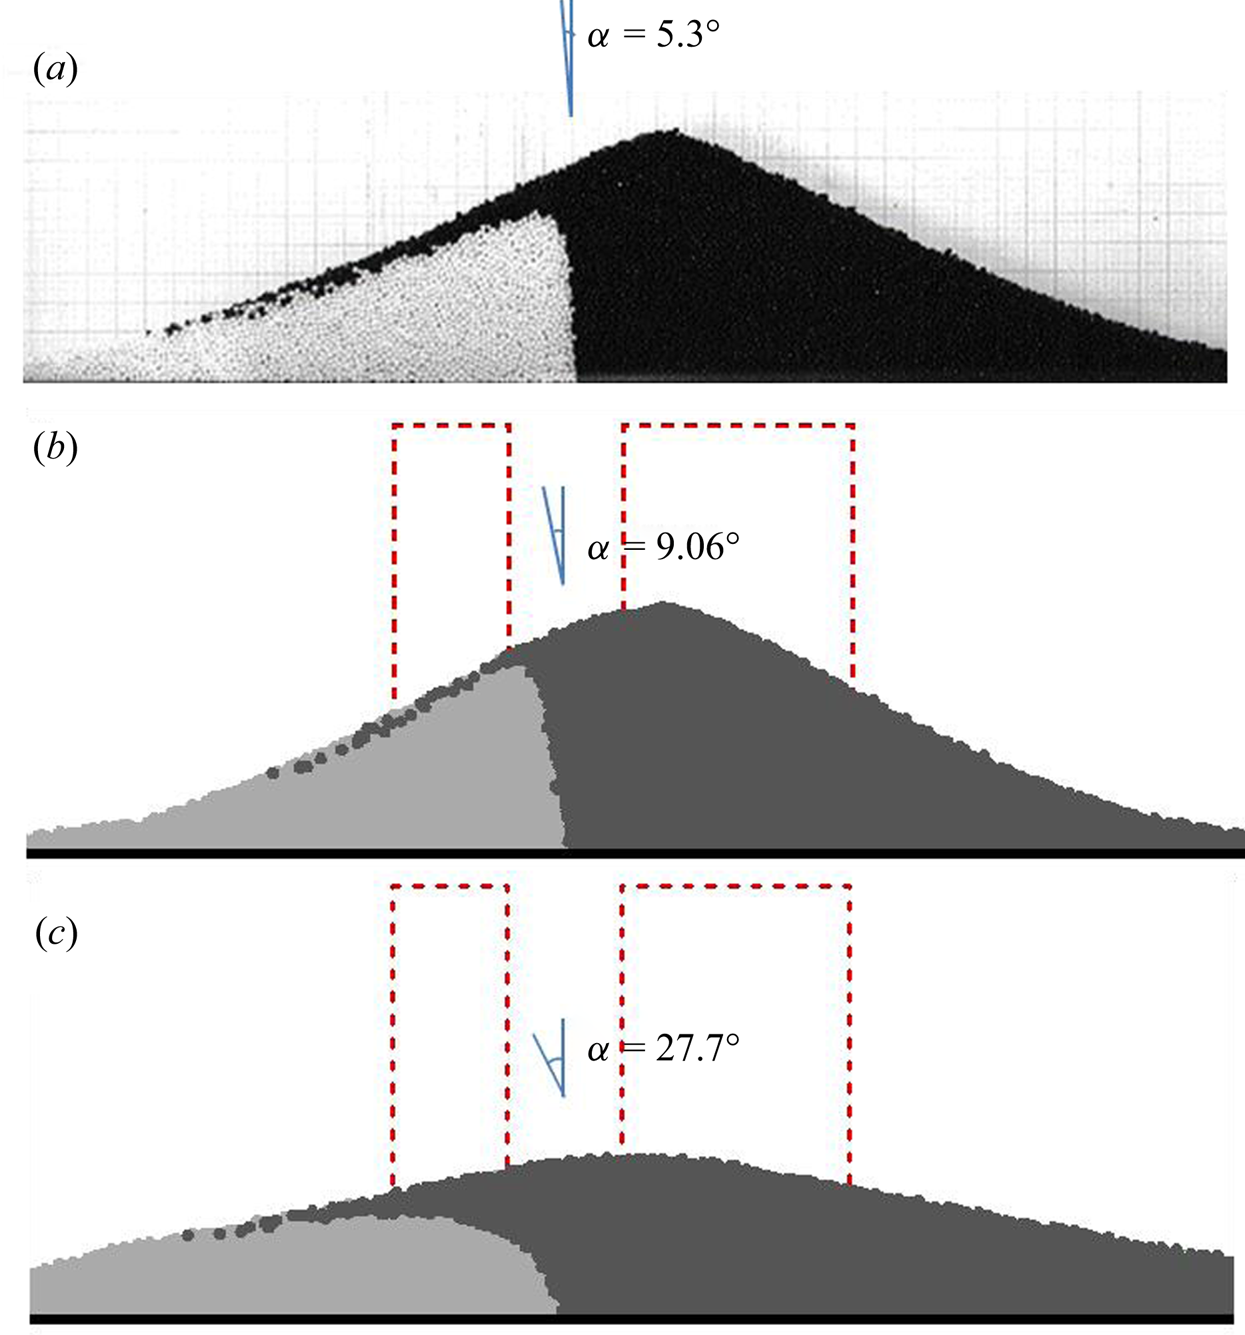
Figure 20 illustrates snapshots from the experiment, non-local and local modelling for the granular flow of Case II at t = 0.6 s. The interfaces obtained from the experimental measurement and non-local modelling were similar. The angle of the interface to the y-axes α was calculated without counting the particles in the vicinity of the free surface. This interface angle for the experiment was α = 5.3°, while α = 9.06° was calculated in the non-local modelling. There was a discrepancy in the interface angle between the non-local modelling and experimental measurements. This was proposed to arise from wall effects. The non-local modelling was conducted in two dimensionsr while the experiments for the flow occurred in a transparent Plexiglas channel in three dimensions. The flow in the experiment could be affected by the side-confined Plexiglas wall and the previous studies indicate that the wall can show a significant effect on the movement of the grains (Jop, Forterre & Pouliquen Reference Jop, Forterre and Pouliquen2005). The side wall can pose a drag force to the granular material so that the velocity of the grains close to the side wall could be affected. Without side-wall confinement, the interface in the experiment could be more curved, which would result in a larger angle that could be close to that obtained in the non-local modelling. The angle from the local modelling was much larger as α = 27.7°. In the local modelling, failure to capture the solid-like state plays a more important role in the interface angle in the comparison.
The interface in the collision of two adjacent collapsing columns for Case II at t = 0.60 s (The dashed line represents the original shape for the two granular columns): (a) the experimental measurement, (b) the non-local modelling and (c) the local modeling.
7. Conclusions
In this study, a non-local mesh-free method is proposed to simulate granular column collapses. The free surface evolution can be conveniently handled by the mesh-free method while peridynamics can capture the entire collapse process from the fluid-like to solid-like state. The stress tensor in the granular flow is determined by the μ(I) rheology.
In the numerical method, the peridynamic horizon, which is linked to the particle distance, is examined by simulating the granular column collapse with the aspect ratio a = 1.25. Larger peridynamic horizons, such as Ωi = 3.0Δl and 4.0Δl, can calculate the representative free surface variation in good agreement with the experimental measurements. However, using smaller horizons, such as Ωi = 2.2Δl, does not sufficiently account for the phase transition from the fluid-like to solid-like state, which results in a significant motion for the particles and underestimation of the free surface. Increasing the horizon to Ωi = 4.0Δl can greatly eliminate the unphysical motion of the particles in the solid-like state, and thus the free surface has a good agreement with the experimental observations. The numerical convergence or particle distance effect is also examined for the method by modelling the granular column collapse a = 1.25. The free surface profiles by using different particle distances are close to each other. The main discrepancy for the simulated free surface occurs on the top of the column. Using a finer particle distance, the peak value of the free surface in the flow can be increased. However, when further refining the numerical resolution from L/Δl = 64 to 128, the difference in the peak value shows a limited change. The numerical results by using larger particle distances agree with the experimental results better. To further examine the numerical convergence, the velocity profiles are examined in the flow. The velocity profiles by using all the particle distances are close to each other, which agrees with the experimental results well. Thus, it can be concluded that the numerical convergence is good for the numerical method, and larger particle distances than the physical grain size can be implemented in the non-local mesh-free method to reduce the computing load because it is the continuum approach.
The non-local mesh-free method is used to simulate two types of granular column collapse. The first type is the collapse at both sides, and two aspect ratios a = 1.25 and 5.0 are numerically investigated. The numerical results are compared with those from the local modelling with the same set of parameters. Both the non-local and local modelling can calculate accurate free surface profiles in the intermediate dense regime. However, the non-local modelling with peridynamics can calculate the transition from the fluid-like to solid-like state with more accurate free surface profiles when compared with experimental measurements. The local modelling is unable to simulate the solid-like state in which the velocity can cause unphysical motion of the particles. Thus, an unphysical flat final deposit can be observed in the local modelling. The granular column collapse occurring on one side, as the second type of granular column collapse, is simulated by the non-local mesh-free method and the numerical results are compared with those from FEM and the experiment. The non-local mesh-free method can accurately capture the quasi-static region in the collapse close to the left wall by reproducing the free surface profiles in good agreement with the experimental results.
The collision for two adjacent collapsing granular columns is also simulated by the non-local mesh-free method. The free surface profiles in the non-local modelling are in good agreement with the experimental results, while the local modelling is unable to capture the free surface in the solid-like state. Owing to its Lagrangian nature, the interface between each collapsing column can be identified. The interface comparison between the local modelling, non-local modelling and experimental measurements is made. Both the local and non-local modelling can accurately represent the interface variation in the intermediate dense regime when compared with the experimental measurements. However, when the material is in the solid-like state, the interface variation in the local modelling exhibits a larger discrepancy when compared with the experimental measurements. This is because the internal unphysical motion of the particles in the local modelling is evident. In the non-local modelling, the unphysical motion of the particles in the solid-like state is greatly eliminated, which enables the method to calculate more accurately the interface variation in the flow. There is still a discrepancy in the interface angle with the y-axes between non-local modelling and the experiments. This could be caused by the side-confined wall effects in three dimensions, which are not accounted for in the 2-D simulation by using the non-local mesh-free method.
The simulations for the granular flows suggest that the non-local mesh-free method can describe the granular behaviours both in the fluid-like and solid-like states. The phase transition and internal flow structures in the granular flows can be captured by the numerical method owing to the incorporation of peridynamics. However, the non-local mesh-free method is the Lagrangian method, which traces the movement of each Lagrangian particle. To improve computational efficiency, more advanced computing techniques, such as parallel computing, can be implemented.
Acknowledgements
We thank Dr Y.-C. Tai at National Cheng Kung University for providing experimental data.
Funding
This research is partly supported by the Natural Sciences and Engineering Research Council of Canada (2017-06397).
Declaration of interests
The authors report no conflict of interest.
Appendix. Plane Couette granular flow in the presence of gravity
The non-local mesh-free method is used to simulate the plane Couette granular flow in the presence of gravity to show the ability in capturing the exponential velocity distribution in the sheared granular flow. We assume the volume of fraction for the material during the shearing is constant as φ = 0.62 by neglecting its variation. The simulated diagram for the flow is shown in figure 21(a). The flow is triggered by dragging the upper plate with a constant velocity Uwall. Meanwhile, a pressure Pwall is imposed on the upper plate while the bottom plate is fixed. Between the two plates, the granular material is the glass beads with a diameter d = 1 mm, and the distance for the two plates is H = 10d. In the 2-D simulation, Pwall = 102.3 Pa and ϕρsgd/Pwall = 0.1457. We simulated two cases with different dragging velocities respectively as Uwall = 0.0003 m s−1 and 0.0013 m s−1. The parameters μs = tan21°, μ 2 = tan32° and I 0 = 0.3 are used in the rheology to calculate the viscosity and stress. The upper plate is discretized into solid particles with four layers of ghost particles all by prescribing the slip velocity Uwall. The particle distance Δl = 0.0005 m is implemented. The material is treated to be weakly compressible and the artificial speed of sound in the equation of state to calculate the pressure field is set to be c 0 = 10 m s−1, which is sufficiently larger than the maximum velocity in the flow. To plot the velocity profiles, the averaged velocity for two adjacent discretized particles in the y direction is conducted, shown in figure 21(b,c). The experimental measurements of the velocity conducted by Siavoshi, Orpe & Kudrolli (Reference Siavoshi, Orpe and Kudrolli2006) are included in the figure. Henann & Kamrin (Reference Henann and Kamrin2013) proposed a continuum constitutive theory for the well-developed dense granular flow by introducing granular fluidity. They simulated this granular Couette shearing flow with the upper plate velocity Uwall = 0.0003 m s−1 and their calculated velocity is also shown in figure 21(b). The exponential shape for the velocity distribution is reproduced by the non-local modelling for both the dragging velocities. Under the upper plate, there is a shearing layer with the depth of several grains showing a significant velocity. However, the velocity becomes very small with the increase in the distance away from the upper plate. Compared with the experimental measurements by Siavoshi et al. (Reference Siavoshi, Orpe and Kudrolli2006) and the results by Henann & Kamrin (Reference Henann and Kamrin2013) for the shearing flow with Uwall = 0.0003 m s−1, the velocity is very small but not exactly close to zero for y/d ≥ 5 in the non-local modelling. However, by increasing the dragging velocity to Uwall = 0.0013 m s−1, the velocity for y/d > 5 is almost zero, as shown in figure 21(c).
Simulation of the plane Couette granular flow in the presence of gravity by the non-local mesh-free method: (a) diagram of the granular shearing flow, (b) the averaged velocity profile for the flow by the dragging velocity Uwall = 0.0003 m s−1 and (c) the averaged velocity profile for the flow by the dragging velocity Uwall = 0.0013 m s−1. The imposed pressure for the upper plate is Pwall = 102.3 Pa and the bottom plate is fixed.



