I. INTRODUCTION
Many advanced materials are intended for use in small-scale applications, for example, microelectronics,Reference Gambino and Colgan1–Reference Wallace and Wilk3 microelectromechanical systems (MEMS),Reference Spearing4, Reference Madou5 photonics,Reference Soref6–Reference Fan, Chow and Zhang8 biotechnology,Reference Fan, Chow and Zhang8 and magnetic storage,Reference Fan, Chow and Zhang8–Reference Gulyaev, Kalinkin, Mityagin and Khlopov11 or may be available only in small volumes, for example during materials development. Developing or optimizing such materials and their processing methods thus requires measurements of structure and properties at small scales. A pervasive measurement requirement is that of measuring mechanical properties and relating them to processing and structure: To optimize manufacturing yield and operational performance, especially reliability,Reference van Spengen12 all materials and devices must maintain mechanical integrity, whether intended for primarily mechanical applications, for example, MEMS, or not, for example, microelectronics. However, establishing processing–structure–mechanical properties linkages at small scales is difficultReference Lord, Roebuck, Morrell and Lube13: Not only are the involved loads and displacements small, making measurement difficult, but issues of specimen gripping and loading alignment, which are also often problematic at large scales,Reference Durelli, Morse and Parks14 are made more difficult as well. In addition, posttest sample collection and manipulation are difficult, which impedes the ability to identify property-limiting structural defects during failure analysis and thus hinders the capacity to alter processing procedures for property optimization.
An experimental method that avoids many of these difficulties in measuring mechanical properties of materials at small scales is instrumented indentation testing (IIT).Reference Oliver and Pharr15–Reference Oyen and Cook20 Commercial IIT instruments are well able to measure loads in the micronewton to 100s of millinewtons range and displacements in the nanometer to 10s of micrometers range, enabling small-scale mechanical testing. As the only IIT measurement requirement is the mounting of a large specimen surface, typically millimeters or more in dimension, perpendicular to the axis of a probe loaded into the surface in compression, gripping, alignment, and manipulation difficulties are largely obviated. In addition, examination of the resulting indentations on the large specimen surface is relatively easy, allowing for failure analysis.Reference Anstis, Chantikul, Lawn and Marshall21–Reference Gouldstone, Chollacoop, Dao, Li, Minor and Shen25 Elastic modulus, hardness and yield stress, toughness, and viscosity are thus all measurable with IIT.Reference Oliver and Pharr15, Reference Field and Swain16, Reference Oyen and Cook20, Reference Chantikul, Anstis, Lawn and Marshall26
Recently, a new experimental test specimen was introducedReference Quinn, Fuller, Xiang, Jillavenkatesa, Ma, Smith, Beall and Lara-Curzio27–Reference Gaither, DelRio, Gates, Fuller and Cook29 that allows “tensile strength” of brittle materials to be measured at small scales and which utilizes many of the advantages of IIT: The tensile test specimen deliberately does not attempt to replicate large-scale tensile test specimen geometries with the attendant gripping and alignment difficulties, but instead integrates the “specimen” into a test “frame.” The integrated circular frame and specimen cross-piece, or “web” segment, resemble the Greek letter Θ, and the overall specimen is known as a “theta” specimen.Reference Durelli, Morse and Parks14, Reference Durelli, Parks and Rosenberg30, Reference Durelli31 The specimen is easily tested in compression with an IIT device, resulting in tension in the specimen web segment and thereby avoiding gripping issues. Precision microfabrication techniques lead to a well-defined alignment of the tensile specimen relative to the loading axis, thereby minimizing alignment issues. Finally, a number of the microscale frames are incorporated onto a macroscale strip for easy manipulation and recovery of failed parts, a feature that was included in a new designReference Gaither, DelRio, Gates, Fuller and Cook29 that improved on many aspects of the original concept.Reference Durelli, Morse and Parks14
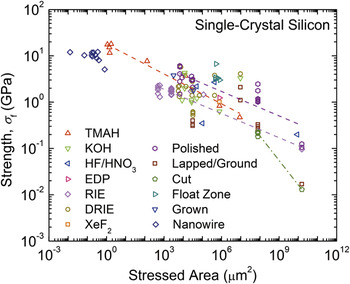
A major focus of the current work is the assessment of the utility of the new test specimen to determine the effects of processing variations on strength. Such variations are highlighted in Fig. 1, which shows a graph of measured fracture strength of single-crystal silicon (Si) as a function of the approximate stressed area for many sample and loading geometries (uniaxial and equibiaxial tension and bending) and surface processing methods.Reference Quinn, Fuller, Xiang, Jillavenkatesa, Ma, Smith, Beall and Lara-Curzio27, Reference Eisner32–Reference Banks-Sills, Shklovsky, Krylov, Bruck, Fourman, Eliasi and Ashkenazi56 Two clear trends are apparent in Fig. 1: (1) fracture strengths tend to decrease with increased stressed area, independent of processing method, consistent with the engineering principleReference Ashby57 that fabrication methods tend to scale surface roughness, and therefore strength-limiting defect sizes, with component size; (2) fracture strengths tend to decrease with increased stressed area, with a different dependence for a given processing method, consistent with the physics principleReference Davidge58 that processing methods tend to generate a particular distribution of flaw potency and that the probability of a component containing a more potent defect increases with component size. The dashed lines on Fig. 1 indicate trend (2) for selected fabrication methods. An implication of Fig. 1 is that if processing method and stressed area are invariant, then strength should not be altered by sample or component geometry.
Fracture strength as a function of approximate stressed area for single-crystal silicon. Data were collected from a large number of sources.Reference Quinn, Fuller, Xiang, Jillavenkatesa, Ma, Smith, Beall and Lara-Curzio27, Reference Eisner32–Reference Banks-Sills, Shklovsky, Krylov, Bruck, Fourman, Eliasi and Ashkenazi56 Power law trend lines are shown to highlight the overall behavior of the strength data. TMAH: tetramethylammonium hydroxide; EDP: ethylenediamine pyrocatechol.

Here, the tensile strength of the original and new theta specimen designs is compared directly, using the same processes to fabricate samples of both sets of specimens, extending previous work that described the more recent design.Reference Gaither, DelRio, Gates, Fuller and Cook29 Section II describes the design and fabrication of the samples, the testing methodology, and the microscopy methods used in sample characterization before and after testing. Section III describes finite element analyses (FEA) used to transform IIT sample load–displacement measurements into material stress–strain behavior as a function of sample geometry. Section IV presents experimental results of tensile elastic deformation and fracture strengths and strength distributions, surface topography measurements, and fractography of failed samples. Section V discusses the implications of the results for establishing processing–structure–mechanical properties linkages for materials at small scales using the theta specimen.
II. EXPERIMENTAL METHOD
A. Specimen design and fabrication
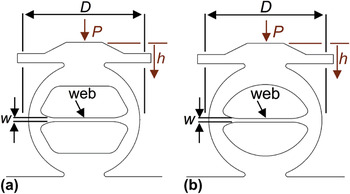
Figure 2 shows schematic diagrams of the theta test specimens developed for small-scale testing. Both specimen geometries are formed from a frame with a circular exterior that is attached to a macroscale strip at the base (not shown), include a hat structure at the top, and incorporate a web across the center of the specimen. The specimen geometry shown in Fig. 2(a) is based on the original design by DurelliReference Durelli, Morse and Parks14, Reference Durelli, Parks and Rosenberg30, Reference Durelli31 and consists of straight sections joined by tangential circular sections to define the frame interior. The specimen geometry shown in Fig. 2(b) is the new arch theta specimenReference Gaither, DelRio, Gates, Fuller and Cook29 and consists of a single circular arch to define the frame interior. Both specimen designs use tangential circular sections to incorporate the web and have the same diameter, D, of 250 μm and web width, w, of 8 μm. During testing, a load, P, is applied to the top surface of the specimen and the load-point displacement, h, is measured. Loading these specimens in compression generates a uniform tensile stress across the uniform cross section of the web. The arch theta design replaces the complex internal geometry of the original Durelli design with an arch, thereby reducing the size and extent of secondary, non-web, stresses in the specimens on loading. The top hat structure is included to minimize loading misalignments and stress concentrationsReference Fuller, Henann and Ma28, Reference Gaither, DelRio, Gates, Fuller and Cook29 that also lead to large secondary stresses. Both of these design changes increase the probability that sample failure will initiate, as intended, in the web. The stressed area of the web, in tension, in both designs was approximately 6.25 × 103 μm2, about the center of the area range of Fig. 1.
Schematic diagrams of the (a) Durelli and (b) arch theta test specimens. The outer ring of each specimen is diametrally compressed with load P and displacement h, generating a uniaxial tensile stress state in the web segment. The diameter of the outer ring is D and the width of the web segment is w.

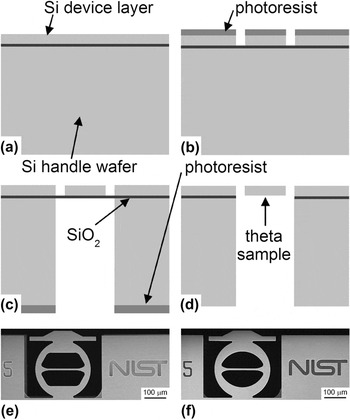
The fabrication sequence for both theta test sample sets is shown in Fig. 3. The process started with a single 100-mm diameter (001) silicon-on-insulator (SOI) wafer consisting of a (25.0 ± 0.5) μm thick single-crystal Si device layer, a (2.0 ± 0.1) μm SiO2 isolation layer, and a (400 ± 10) μm Si handle wafer, Fig. 3(a), where the uncertainty values represent variations across the wafer as specified by the manufacturer. The SOI structure allowed for better control of sample device thickness and more robust strips for manipulation and mounting of samples for testing than previous designs.Reference Quinn, Fuller, Xiang, Jillavenkatesa, Ma, Smith, Beall and Lara-Curzio27, Reference Quinn, Dusza, Danzer, Morrell and Quinn59 The Si device layer and Si handle wafer layer were patterned by front- and back-side photolithographic masks and etched using deep reactive ion etching (DRIE) to define the sample and strip features, Figs. 3(b) and 3(c); the front-side mask included both Durelli and arch designs. The photolithographic mask designs were transferred to the SOI wafer such that the web segment of the test samples was oriented along a <110> direction with less than 0.5° misalignment.Reference Gaither, DelRio, Gates, Fuller and Cook29 After Si etching, the SiO2 layer was removed with a buffered-oxide etch to create the freestanding samples, Fig. 3(d). Resulting Durelli and arch theta samples are shown in Figs. 3(e) and 3(f), respectively. Finally, each test strip, consisting of 10 theta samples spaced along a 15 mm length, was removed from the wafer using a diamond scribe on notched regions at each end of the strip.
(a–d) The fabrication sequence for the theta test samples. (a) The process began with a SOI wafer. (b) The Si device layer and (c) Si handle wafer were patterned by a photolithographic mask and etched using DRIE to define the device features. (d) The SiO2 layer was then removed locally with a buffered-oxide etching solution to create the freestanding structures. (e, f) Field-emission scanning electron microscopy (FESEM) images of completed (e) Durelli and (f) arch theta test samples.

B. Mechanical testing and characterization
The test strips were clamped across the full-wafer 427-μm thickness into a fixture that was then mounted into an IIT device, such that the samples were upright and isolated from the surrounding clamp material. Each test sample was then diametrally compressed “via” IIT using a 250-μm radius spherical sapphire indenter and an IIT break-detection routine that withdrew the indenter on detection of sample failure to minimize subsequent sample damage. Two sets of test conditions were used for all samples. In the first, the IIT device was operated in load control and set to load to a peak load of 200 mN, cycle five times between the peak load and 100 mN with a 30 s peak hold each cycle, and then unload, using loading and unloading rates progressively increasing from 0.5 to 13.3 mN s−1. In the second, the IIT device was subsequently operated at a target displacement rate of 20 nm s−1 and loaded until the break-detection routine detected a rapid increase in indenter velocity, associated with an increase in sample compliance and sample failure, and withdrew the indenter. Load and displacement were recorded throughout the cyclic loading and sample failure measurements with data acquisition rates of 5 and 100 Hz, respectively.
Sample load and displacement data were converted into the longitudinal stress, σ, and strain, ε, in the web using FEA (see Section III); in particular, sample strength, σ f, was calculated from the peak load at sample failure and the sample web dimensions (see Section II.C). The resulting strength values were fit to a three-parameter Weibull distribution

where P f is the cumulative probability of failure, σ th is the threshold strength, σ θ is a scaling stress (the “characteristic strength” is σ th + σ θ), and m is the Weibull modulus. The cumulative failure probability was assigned to each strength value by

where i is the rank of the strength in an ascending-order ranked strength distribution and N is the total number of strength values in the distribution. Weibull distribution parameter values were determined using a Levenberg–Marquardt fitting algorithm of Eq. (1) to the strength data. The strength values were also used to estimate the critical flaw size leading to sample failure. The flaw sizes, c s, were estimated assuming simple, nonresidually stressed flaws,

where T is the material toughness, here taken as 0.71 MPa m1/2 appropriate to the (110) plane of Si,Reference Cook24 and Ψ is a crack geometry term, here taken as 1.12π1/2 appropriate to a linear surface flaw.Reference Lawn60
C. Microscopy and sample characterization
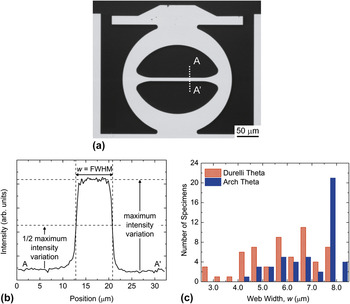
The dimensions of the web cross section are critical in determining the relationships between the load applied to the sample, P, and stress, σ, generated in the web, and the load-point displacement, h, and web strain, ε. The dimension of the web in the section AA′ in Fig. 4(a), the web “width,” w, controlled the P–σ and h–ε relationships, as the sample and web thickness were controlled by the SOI device layer thickness; lithographic and DRIE variability generated variations in web width, but not web thickness. High-contrast optical microscope images were digitally recorded for every sample, as shown in the example Fig. 4(a). The images were imported into an image-processing program, and the image intensity variation across hundreds of sections such as AA′ determined over the central section of the web. An example of an intensity variation is shown in Fig. 4(b). The minimum and maximum intensities in an image were then used to set a half-maximum intensity variation, and a web dimension at each section was defined as the full-width at half maximum of the intensity variation. The web dimensions from every section in an image were then combined to generate a mean and standard deviation web dimension in pixels for that sample. Such oversampling enabled super-resolution subpixel standard deviations to be obtained for the web widths. Calibration of the microscope and image-processing program using a calibrated pitch grating enabled the web width in micrometers to be calculated from the pixel dimensions. Figure 4(c) shows histograms of the web widths of the 105 fabricated and tested Durelli and arch theta samples. Note that most samples had web widths less than the target of 8 μm. Trials of the lithographic process showed that the variability in web width resulting from the intended DRIE process was 0.7 μm and hence some other, unintended, process overetched the samples to generate significantly smaller web widths.
(a) Grayscale optical image of an arch theta test sample. An optical image of each sample was imported into an image-processing routine prior to testing. (b) Vertical line scans of the pixel intensity were analyzed using a full-width half-maximum criteria to determine the web width. The web widths from these line scans were averaged over the entire web segment, resulting in subpixel resolution for w. (c) Bar graph of the web width distribution for Durelli and arch theta samples at 0.5 μm intervals.

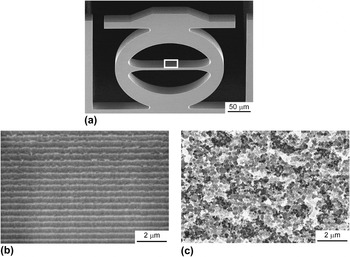
Field-emission scanning electron microscopy (FESEM) was utilized to examine fabrication etch quality and tested sample fracture surfaces; samples were sputter-coated with gold–palladium prior to examination. The samples exhibited two forms of surface etching, shown in Fig. 5. The etch quality in Fig. 5(b) is consistent with the regular etch steps known as scallopsReference Senturia61 that are characteristic of DRIE. However, in Fig. 5(c), a clearly different etch surface quality is apparent. The effect and likely origin of this unintended etch surface, in the form of irregular pits, are discussed in Sections IV and V, respectively. Fragments from tested samples were collected to analyze the fracture behavior. Fracture surfaces were examined to identify initial fracture locations, crystallographic crack propagation planes, and fracture mode. Fracture mirror radii,Reference Levengood62–Reference Quinn64 R, on the fracture surfaces were estimated for comparison with the expected mirror radii calculated from the Orr equation

FESEM images of the sidewall etch surfaces for the theta test samples. A portion of the important web segment is indicated by the box in the tilted theta sample of (a). In (b), the sidewalls have regular etch features, known as “scallops”, which are expected with the DRIE process. In (c), the sidewalls have irregular etch features, denoted here as “pits”, which result from unwanted etching of the Si device layer during the etching of the Si handle wafer.

where σ f is the stress at the origin at fracture and A is the mirror constant for Si fracture, approximately 1.6 MPa m1/2 for the {110} tensile surface on the {110} fracture plane.Reference Tsai and Mecholsky65
Topography measurements of the etched surfaces were made using atomic force microscopy (AFM) to determine surface roughness. Intermittent contact mode AFM, at a line scan rate of 1 Hz, was used to scan 5.0 μm × 2.5 μm regions of sample sidewall surfaces, using a cantilever with a 40 N m−1 spring constant, 325 kHz resonance frequency, and 10 nm tip radius. Resulting scans were 512 pixels × 256 pixels. Etch surface roughness was compared to the calculated critical flaw sizes, Eq. (3).
III. FINITE ELEMENT ANALYSIS
For each specimen design, three-dimensional finite element analysis (FEA) simulations of loading were performed. Each specimen simulation utilized more than 100,000 eight-node linear hexahedral mesh elements; the critical specimen web segment had 36–66 elements in cross section and approximately 2,000–10,000 total elements within the web segment, with more elements used for smaller web widths. Silicon orthotropic elastic properties were used and oriented as in the fabrication sequence, aligning <110> with the theta web axis; the elastic stiffness values were C 11 = 165.773 GPa, C 12 = 63.924 GPa, and C 44 = 79.619 GPa.Reference McSkimin and Andreatch66 Simulated loads of 20–200 mN in increments of 20 mN, along with a load of 2 N, were applied to the top center of the theta specimens using a hemisphere with a 250-μm radius indenter and isotropic elastic property values approximating sapphire with a Young’s modulus of 400 GPa and a Poisson’s ratio of 0.24.Reference Holm, Ahuja, Yourdshahyan, Johansson and Lundqvist67
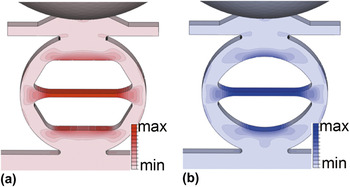
FEA images of the maximum principle stress for both theta specimens with ideal dimensions are shown in Fig. 6. Both specimens have the same applied load. The maximum principle stress is clearly greatest in the constant cross-section web segment; this stress is invariant within this region and is nearly equal for the two designs. The stress fields were essentially uniaxial along the web axis for most of the web length, with consequent longitudinal and Poisson-contracted lateral strain fields. Secondary stresses located at the top and bottom of the inside theta regions are significantly less than the primary stress in the web. Both the extent and magnitude of the secondary stress are reduced in the arch theta specimen compared with the Durelli design. In Fig. 6(a), the maximum secondary stress is 0.65 of the maximum stress in the web, and the secondary stress region in Fig. 6(b) has a maximum stress of 0.62 of the stress in the web.
Maximum principal stress distribution for the (a) Durelli and (b) arch theta test specimens subjected to loading with a sapphire sphere. The largest maximum principal stress, σ max, occurs in the web segment, and the largest secondary stress, σ sec, is located at the top and bottom of the inner theta region. For the Durelli theta, the stress ratio σ sec/σ max = 0.65. For the arch theta, the stress ratio σ sec/σ max = 0.62. Thus, for both geometries, initial fracture is expected to occur in the web segment.

The simulations were used to translate the applied indentation load, P, and load-point displacement, h, response into stress and strain behavior in the web segment of the theta specimens of ideal dimensions. In all simulations, P and h were linearly related and specimen compliance, λ, was determined by averaging over all simulated loads. Stress, σ, and strain, ε, in the web segment were determined by averaging the principal stress and strain over the cross section of the center of the web, respectively. In all simulations, σ and ε were linearly related and linearly related to P and h, respectively. Equations for σ and ε as functions of P and h, theta diameter, D, and specimen thickness, t, were established by averaging responses over all simulated loads. For the Durelli theta specimen these equations were


where σ D is in GPa, P is in mN, and D, t, and h are in μm; correlation coefficients for these linear relations were R 2 > 0.9999. The related specimen compliance for the Durelli design was λ D = 6.03 nm mN−1. The stress and strain equations include negative signs as the load and load-point displacement were taken in the specimen compressive direction while the stress and strain were taken in the web tensile direction. The original Durelli specimen equations had coefficients of 13.8 for stress and 0.585 for strain.Reference Durelli, Morse and Parks14, Reference Durelli, Parks and Rosenberg30, Reference Durelli31 Equations (5) and (6) contain different coefficients due to the changes in outer specimen design geometry, namely the included top hat and specimen bottom attachment. For the arch theta specimens, the stress and strain in the web segment were determined to be


with arch theta compliance of λ A = 5.27 nm mN−1 and units as for Eqs. (5) and (6). (The change in coefficients in Eqs. (7) and (8) compared to those cited previouslyReference Gaither, DelRio, Gates, Fuller and Cook29 is due to a more detailed analysis of the finite element model.) Equations (5)–(8), describing the behavior of specimens of ideal geometry, provide the basis for determining the uncertainty arising from the use of the finite element interpolation equations describing the behavior of specimens with nonideal web widths.
The variation in fabricated sample web widths, illustrated by Fig. 4(c), was incorporated into the FEA simulations to accurately determine the mechanical behavior. Stress, strain, and compliance formulas as a function of web width, w, were developed for both theta specimens. The geometry of each specimen was altered by incrementally performing 0.5 μm offsets over the entire specimen plane surface, leaving the thickness unaltered, resulting in 1 μm changes in web width. In particular, offsets were performed to create specimens with 3–9 μm web widths in 1 μm increments. Simulated loads were applied and the resulting load-point displacements and web stress and strain were determined as described above for each simulated web width, and the coefficients relating these four parameters similarly determined. The relationships between the parameters maintained the same form with coefficients, K, which depended on w


where λ I is the ideal, w = 8 μm, compliance for a given specimen geometry. The coefficients K were found to be well described by simple inverse dependencies on w, and averaging over the seven width simulations for each specimen generated the following expressions


for Durelli theta specimens, and


for the arch theta specimens. In Eqs. (9)–(17), K σ, K ε, and K λ are dimensionless and w is in μm. R 2 values for the above dependencies were 0.98 or greater. Inserting w = 8 μm into the above interpolation equations reveals about 1% variation from the coefficients for stress and strain given in Eqs. (5)–(8) and about 2% variation from the ideal compliance values.
IV. RESULTS
A. Elastic deformation
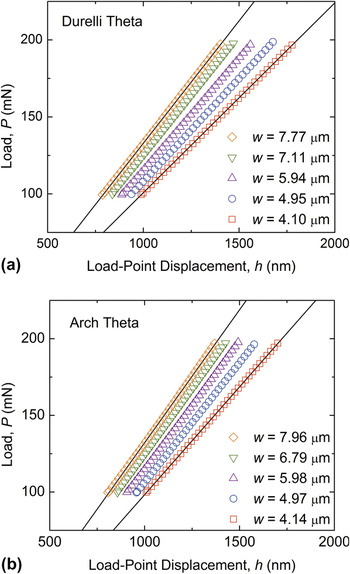
Figure 7 shows load–displacement responses for five of each of the fabricated Durelli and arch samples taken from the initial cyclic loading between a peak load of 200 and 100 mN. Responses for sample widths from just less than the target width of 8 μm to slightly greater than 4 μm are shown, and only the first unloading response for each sample is shown. The compliance of the samples for both geometries increases with decreasing web width, as highlighted by the best-fit straight lines passing through the extremes of the web widths. Best fits to all the responses generated compliance values that were all slightly greater than the compliance values predicted from the FEA, Eqs. (11), (14), and (17). There was no trend of the increase in compliance with sample web width, suggesting that the additional inferred deformation and resulting compliance was associated with indenter contact and test strip mounting. The mean and standard deviation of the additional test system compliance, determined from the 10 samples in Fig. 7 was (0.21 ± 0.10) nm mN−1, approximately 3% of the average experimental compliance value for the 10 samples. Deformation associated with this test-system compliance was subsequently subtracted from all presented displacement data. The agreement between the measured and predicted compliance values, notwithstanding the additional test system compliance, indicates that the FEA of the specimens was accurate and that the dependencies of Eqs. (9)–(17) are accurate for relating web stress and strain-to-indenter load and displacement.
P–h data for the first unloading segment of five different cyclically loaded (a) Durelli and (b) arch theta test samples with a 4–8 μm distribution of web widths. As w decreases, the compliance, λ, of the theta test specimen increases, illustrated by the changing slope of the data sets. Best fits to all the responses generated compliance values that were all slightly greater than the compliance values predicted from the FEA due to test system deformation compliance.

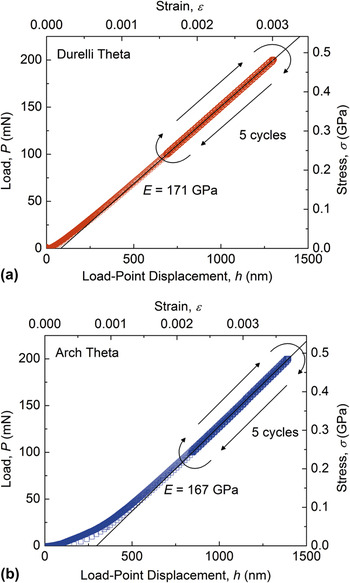
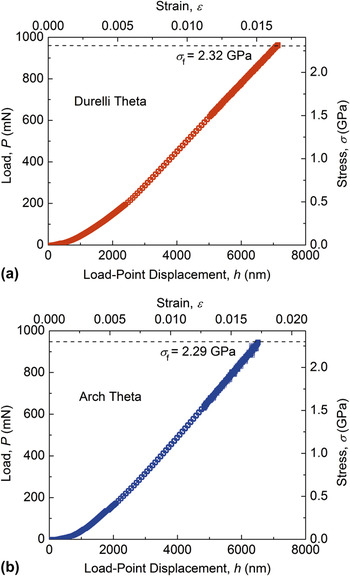
Figure 8 shows the complete cyclic load–displacement responses for single example Durelli and arch samples. Equations (12), (13), (15), and (16) were used to generate web stress and strain data from the sample load–displacement data. An initial, recoverable, nonlinear response is visible for the example arch sample, Fig. 8(b); this was typical of the initial first-cycle response for all samples examined and is probably associated with seating and unseating of the spherical indenter on the rough etched surface of the hat. This initial nonlinear response was quite variable, and in some cases extended over several micrometers of displacement. In other cases, this first-cycle nonlinearity was barely discernible, as shown in the example Durelli sample, Fig. 8(a). After the initial loading, the data for all the loading cycles between 100 and 200 mN for both geometries are indistinguishable, indicating negligible subsequent hysteresis; this lack of cyclic hysteresis was common to all samples tested, indicating a completely elastic response after initial indenter seating and that the sample mounting configuration was effective and essentially lossless. Best-fit straight lines to the cyclic loading data are shown in Fig. 8, giving rise to elastic moduli values of (171 ± 3) and (167 ± 3) GPa, for the example Durelli and arch samples, respectively, where the uncertainty includes the measurement uncertainty and the finite element interpolation equations uncertainty. These values compare with 168.9 GPa for the Young’s modulus of Si in the <110> directions.Reference Brantley68 The elastic responses and moduli agreement serve to validate the combined experimental and analytical approaches.
P–h and corresponding σ–ε data for (a) Durelli and (b) arch theta test samples subjected to five load–unload cycles with a maximum load of roughly one-fifth the typical fracture load. The traces are linear with no discernable hysteresis, which suggests a secure and stable test platform. E was determined from the slope of the linear portion of the trace. For these particular samples, E = 171 GPa for the Durelli theta and E = 167 GPa for the arch theta.

B. Strength
Figure 9 shows the load-to-failure responses for the example Durelli and arch samples described above and in Fig. 8. Once again, Eqs. (12), (13), (15), and (16) were used to generate web stress and strain data from the sample load–displacement data; initial nonlinear responses are visible for the samples, associated with the reseating of the indenter between the cyclic (Fig. 8) and load-to-failure measurements (Fig. 9). The increased scatter in the data prior to peak load and failure is associated with a change in the loading mechanism of the instrumented indenter and decrease in stability at large loads. Linear best fits to the data for 0.5% strain prior to failure (not shown) in Fig. 9, gave rise to elastic moduli values of (169 ± 3) and (166 ± 3) GPa, for the example Durelli and arch samples, respectively, once again in good agreement with the expected value and values determined from the cyclic loading measurements of Fig. 8. The strengths for these example samples were 2.32 and 2.29 GPa, respectively, comparable to the values reported in Fig. 1 for specimens of similar stressed area. In all samples measured, the stress–strain response was linear prior to failure, at strengths up to 2.7 GPa and corresponding sample failure strains (excluding seating deformation) of approximately 1.8%.
P–h and σ–ε data for (a) Durelli and (b) arch theta test samples loaded to failure. E was determined from the slope of the linear portion of the trace, and σ f was the stress at which fracture occurred. For these particular samples, E was 169 and 166 GPa and σ f was 2.32 and 2.29 GPa for the Durelli theta and arch theta, respectively.

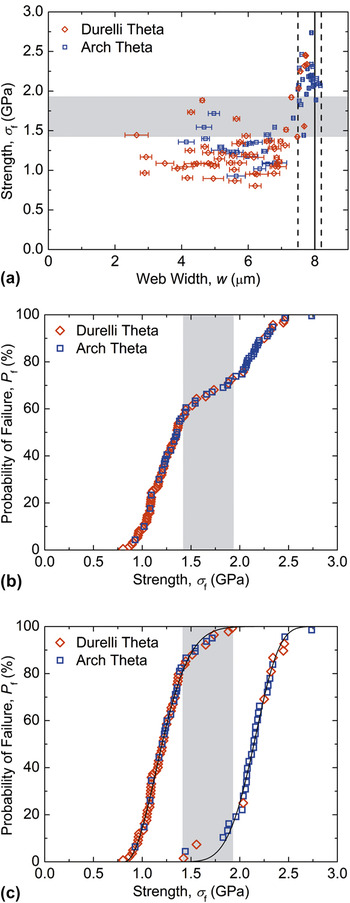
As noted in Fig. 4(c), both Durelli and arch theta samples had significant distributions in sample web widths. The resulting strength, σ f, values for the combined set of Durelli and arch theta samples are plotted as a function of sample web width in Fig. 10(a). The ideal web width of w = 8 μm is indicated by the vertical solid line and the normal variability in web width observed for DRIE lithography, 0.7 μm, is indicated by vertical dashed lines. Overall, samples with near-ideal web width had greater strengths than samples with reduced web widths and exhibited less variability in the web width; the mean and standard deviation of the web width of each sample are indicated by the symbol and horizontal uncertainty bar in Fig. 10(a). (The uncertainty in the strength arising from the finite element interpolation equation and sample thickness uncertainty is smaller than the symbol size.) This variability was apparent when capturing the images for the web width calculation image-processing routine; samples with smaller web widths had rough sample edges, including the web segment. Figure 10(b) is a plot of the cumulative failure probability, P f, as a function of strength, σ f, for the combined Durelli and arch theta sample data set. Examination of Fig. 10(b) suggests that the strength distribution is bimodal, as there appear to be three inflection points in the distribution, with a strength range of approximately (1.4–1.9) GPa separating a low strength distribution from a high strength distribution. Comparison with Fig. 10(a) suggests that this was in fact the case, with the strength, and dominant flaw size, related to the web width. The picture that emerges, considering both Fig. 10 and Figs. 4 and 5, is that there are two flaw populations governing the overall strength distribution: The first flaw population is associated with DRIE scallops [Fig. 5(b)], near-ideal web widths, and small surface roughness, giving rise to small flaws and large strengths. The second flaw population is associated with the pitted surface [Fig. 5(c)], reduced web widths, and large surface roughness, giving rise to large flaws and small strengths. The vertical dashed line in Fig. 10(a) at a web width of 7.5 μm indicates the boundary separating these width distributions.
(a) Fracture strength as a function of web width. The data can be divided into two groups associated with the sample surface morphology as determined by the etching process as indicated by the dashed line at w = 7.5 μm. For w < 7.5 μm, σ f varied from 0.8 to 1.9 GPa. For w > 7.5 μm, σ f varied from 1.4 to 2.7 GPa. The smaller web width samples had greater web width standard deviations indicated by the data error bars. (b) The total strength distribution for the combined Durelli and arch theta test samples is bimodal, as there appear to be three inflection points in the distribution. (c) Weibull failure probability plots for the two distributions in (b) split at w = 7.5 μm. For w > 7.5 μm, m, σ θ, and σ th were 4.57, 0.90 GPa, and 1.32 GPa, respectively. For w < 7.5 μm, m, σ θ, and σ th were 2.00, 0.46 GPa, and 0.82 GPa, respectively. In (a) to (c), the grey bands indicate the overlap of the strength distributions.

In Fig. 10(c), the strength data from each distribution were fit to two different three-parameter Weibull distributions, Eq. (1). The strength data were separated into two groups on the basis of the surface morphology of the sample, DRIE scallops or pits, as indicated by the sample web width, near ideal (8.2–7.5 μm) or reduced (less than 7.5 μm). The strength distributions of the groups overlapped as shown in Figs. 10(a) and 10(b), and fits to the two groups were performed separately. The solid lines in Fig. 10(c) indicate the best-fit distributions, described by m, σ θ, and σ th values of 4.57 ± 1.18, (0.90 ± 0.26) GPa, and (1.32 ± 0.24) GPa, respectively, for the high strength group, and values of 2.00 ± 0.12, (0.46 ± 0.02) GPa, and (0.82 ± 0.02) GPa for the low strength group. The uncertainties are standard deviations of the fitted values. The R 2 values for these fits were >0.99, consistent with the agreement between the data and the fitted lines in Fig. 10(c). The overlap in the strength distributions was in the range (1.4–1.9) GPa as indicated by the grey bands in Fig. 10.
C. Fractography and surface topography
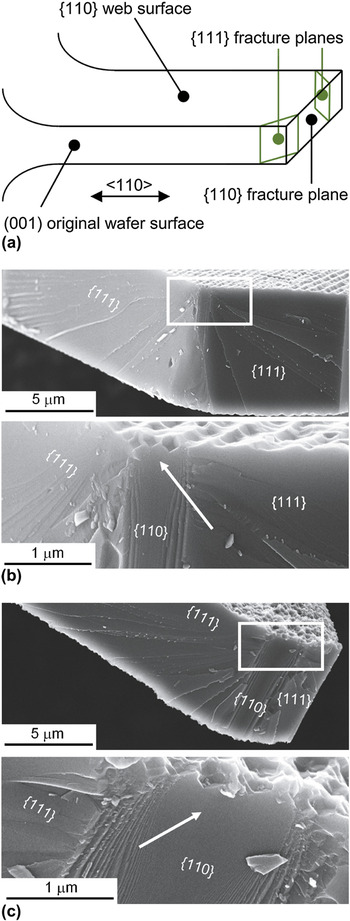
The expected fracture cleavage planes for Si tested in tension along a <110> direction are {111} and {110},Reference Cook24 giving rise to expected fracture planes for the web of the theta specimens as illustrated in the schematic diagram of Fig. 11(a). FESEM images of web fracture surfaces are shown in Figs. 11(b) and 11(c) for arch theta samples that contained DRIE scallop etch features [Fig. 11(b)] and pitting etch features [Fig. 11(c)] on the web surfaces. In both cases, features on the fracture surfaces, including changes in fracture plane, cleavage step hackle, and arc-ribs surrounding a cathedral mirror,Reference Quinn64, Reference Tsai and Mecholsky65 enabled the fracture origin to be identified. In the two examples shown, fracture initiated on a {110} plane perpendicular to the web long axis, and imposed tension, and after some small propagation distance deflected onto the smaller fracture energy {111} planes. Step hackle was predominantly restricted to these {111} planes, and arc-ribs and associated cathedral mirrors were predominantly restricted to the initial {110} planes. The hackle, arc-ribs, and mirrors all radiated away from a single location that indicated the fracture origin, similar to Si {110} fracture observed previously.Reference Tsai and Mecholsky65 Also in both cases, it appeared that as soon as the propagating cracks formed arc-ribs, the cracks deflected from the {110} to {111} planes. The arrows in the magnified images of Figs. 11(b) and 11(c) indicate the fracture origin and the clear mirror center on the fracture surface. In the two examples, the fracture-inducing flaw is not obvious, although the web surfaces are clearly not flat at the fracture origin. These features were observed on the majority of the nearly 20 fracture surfaces examined, with one each of a complete {110} and a {111}-to-{110} failure mode also observed. Observations of fractured samples did not indicate initial fracture in any region other than the web segment.
(a) Schematic diagram of the {111} and {110} fracture planes that occur in the specimen web segment. (b,c) FESEM images of web segment fracture surfaces for the scallop and pit samples, respectively. In both examples fracture initiated on {110} fracture planes and changed to {111} fracture planes once the arc-ribs around the fracture mirror were generated. The mirror location and corresponding origin location is indicated by the arrow; in both (b) and (c), fracture initiated at a sidewall etch feature. Cleavage step hackle radiates from the fracture mirror and origin. The size of the fracture mirror in the scallop-etch example in (b) is clearly smaller than the mirror in the pit-etch example in (c).

Measurements of fracture mirrors were performed on magnified images of fracture surfaces: The mirror radius was taken as half the separation of the first discernible arc-ribs delineating the mirror at or near the web surface. Mirror radii, R, varied from just over 200 to 1100 nm. Combining the mirror radii with the strength values for all samples examined and using Eq. (4) generated a mean and standard deviation mirror constant of A = (1.2 ± 0.4) MPa m1/2, which compares with the constant of (1.61 ± 0.14) MPa m1/2 determined previouslyReference Tsai and Mecholsky65 for Si {110} fracture on a {110} tensile surface on micro- rather than nano-scale mirrors.
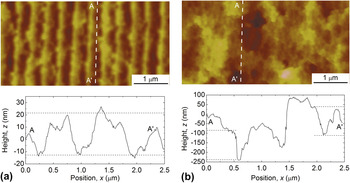
Figure 12 shows AFM images and topographic line scans of a DRIE scallop surface [Fig. 12(a)] and a pitted surface [Fig. 12(b)]. The images are similar to the FESEM presented in Fig. 5. The peak-to-valley topography of the DRIE scallop surface along the loading direction parallel to the scallops, and presumably perpendicular to a fracture-initiating flaw and the observed {110} initial fracture surface, was approximately 35 nm. The peak-to-valley topography of the pitted surface along the loading direction was approximately 250 nm, although the valley base level was much more irregular than that observed for the scalloped surface to give surface features approximately 150 nm in scale. The strength value ranges for the two strength distributions noted in Section IV.B and delineated in Fig. 10(c) are 0.8–1.9 and 1.4–2.7 GPa. Using these strength values in Eq. (3) provides the corresponding critical flaw size ranges of 200–35 and 65–18 nm, respectively. As a consequence of the overlapping strength distributions, the estimated flaw size ranges also overlap. The pairs of dashed horizontal lines in the line scan graphs of Fig. 12 are separated by 35 [Fig. 12(a)] and 150 nm [Fig. 12(b)] indicating that the upper bounds of the calculated critical flaw sizes are comparable to the extremes of the surface topography for both surface types.
AFM images and line-scans of sidewall etch surfaces with (a) scallops and (b) pits. The surface features along the length of the scallops and pits are similar to the maximum flaw sizes calculated via linear elastic fracture mechanics.

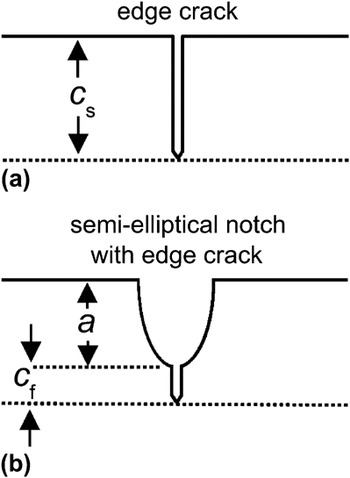
Figure 13(a) shows a schematic diagram of the failure-causing flaw as described by Eq. (3), a sharp edge crack of length c s on a planar surface. Consideration of the surface roughness suggests a better representation of the flaw is that of a sharp crack of length c f at the bottom of semielliptical notch of depth a, as shown in Fig. 13(b). Fracture mechanics analysisReference Yamamoto, Sumi and Ao69 shows that the relation between strength and size for a semielliptical notch with a crack flaw is Eq. (3) with c s = a + c f. Setting a as the characteristic topography dimensions above and using the estimated flaw sizes in this relation suggests crack lengths, c f, in the range of a few nanometers to a few tens of nanometers.
Schematic diagrams of (a) a sharp crack on a planar surface and (b) a short sharp crack at the root of a semielliptical notch that is more representative of failure-causing flaws on rough etched surfaces.

V. DISCUSSION AND CONCLUSIONS
The microfabricated miniaturized theta specimens presented here, the original Durelli geometry and the new arch geometry, along with associated additional design features and calibration and testing protocols, provide a simple and effective method for measuring the tensile strength of brittle materials at the microscale. Microfabrication methods allow many samples to be formed at once, and the ease of use of the combined sample geometry and testing protocol allows many measurements to be performed in a time-effective manner, thus enabling statistically relevant numbers of strength measurements to be obtained; hundreds of samples were formed on a single wafer and a single test time was about 5 min. Much of the ease of use and measurement efficacy arises from two critical design features: (1) Forming the samples in a thin device layer on top of a thick handle wafer allowed thick bars incorporating thin samples to be handled easily. This enabled sample mounting in the IIT system with negligible loading hysteresis and very small system loading compliance. Direct checking of the measured load–displacement responses to verify the accuracy of the compliance and stress and strain analyses was thus a simple matter. Ease of sample handling also enabled straightforward recovery of broken samples for post-failure analysis. (2) The incorporation of a specimen hat and the use of a spherical IIT loading probe maximized the uniformity of stress in the web and minimized secondary, non-web stresses. This led to maximized testing yield with all samples appearing to fail in the intended web segment. The arch theta specimen was designed to have smaller regions of secondary stress, but the hat appears to have mitigated secondary stress effects for both Durelli and arch designs. Additional design, testing, and analysis features, such as separating the samples by blocks on the bars (Figs. 3 and 5), using a sample break detection routine, and incorporating variations in web width into the stress and strain analysis (Fig. 4), also increased testing yield and measurement accuracy and precision.
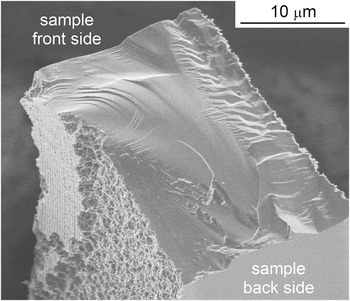
The measurements on the etched Si samples demonstrated that the theta specimen can be used to achieve a materials science and engineering goal of establishing processing–structure–properties relations, albeit here an unintended demonstration. Variations in the etching process led to two different surface structures that in turn led to two different strength properties (Figs. 5, 10, and 12). Surface-roughness measurements suggest that the strength-controlling flaw sizes in the samples were comparable to the surface roughness, which appeared in two forms: regular scallops about 35 nm in scale and irregular pitting about 150 nm in scale. The two flaw size populations gave rise to two strength populations, a stronger one associated with the smaller roughness front-side device-layer DRIE scallops and a weaker one associated with the unintended larger roughness pitting. The processing step leading to the pitting was probably the back-side handle-wafer DRIE, step (c) in Fig. 3. The pits were most likely formed when the SiO2 isolation layer separating the device and handle layers was fractured or punctured during steps (b) or (c), leading to backside DRIE gases passing through the SiO2 and re-etching the front-side surfaces during step (c). An example of this is shown in Fig. 14, which is a FESEM image of a (non-web) sample fragment. The fragment smooth face at the front of the image was the location of the SiO2 layer, and regular front-face DRIE scallops can be observed on an isolated mesa at the rear of the fragment. The left face is clearly etched with a pitted surface to leave the mesa and leading to a thinner sample, consistent with the observation that “rough” webs were also thinner. The formation of this unintended rough surface was not related to specimen geometry, affecting Durelli and arch designs approximately equally. As a consequence, as both designs had approximately the same stressed area, the strengths of both designs were the same, consistent with the implication from Fig. 1 that if processing and stressed area are the same then similar strengths should be observed.
FESEM image of an inhomogeneously etched surface of a sample fragment. The flat surface at the front of the image was initially covered with an oxide separating the specimen device layer and the handle wafer (not shown). The re-etched pitted surface is apparent on the left of the fragment, leaving a small mesa of device layer DRIE surface remaining.

Other test specimens that have enabled statistically meaningful numbers of small-scale tensile strength measurements have often used more complex geometries microfabricated from multilayer polycrystalline material; these include pull tabsReference Miller, Boyce, Dugger, Buchheit and Gall54, Reference Bagdahn, Sharpe and Jadaan70, Reference Boyce, Grazier, Buchheit and Shaw71 and chains of linksReference Boyce72 for which specialized mechanical loading systems were required and on-chip tensile bars for which electrical connection was required for thermal actuation of the tests.Reference Hazra, Baker, Beuth and de Boer73, Reference Hazra, Baker, Beuth and de Boer74 Simpler geometries microfabricated from single-layer SOI material have also been demonstrated: In one case, large numbers of samples in the form of beams were tested, using loading by an AFM and an indentation systemReference Namazu, Isono and Tanaka45; in another, a tensile dog-bone geometry was demonstrated,Reference Banks-Sills, Shklovsky, Krylov, Bruck, Fourman, Eliasi and Ashkenazi56 although the specimen does not lend itself well to testing large numbers of samples and a specialized mechanical loading system is required. In both SOI cases, as here, good agreement between the measured small-scale Young’s modulus and the bulk value was found, and the strength of the samples was controlled by flaw sizes linked to the surface roughness. Although the theta specimen is unlikely to reach the throughput of the multilayer specimens (thousands of specimens at a rate of one per minuteReference Boyce72), the advantages of the theta geometry are that the samples are formed from a single layer, which need not be silicon (copper for exampleReference Banks-Sills, Shklovsky, Krylov, Bruck, Fourman, Eliasi and Ashkenazi56), the geometry is simple, and specialized equipment beyond an IIT system is not required. In addition, samples need not necessarily be formed by lithography and microfabrication, but by focused ion-beamReference Greer and Nix75 or laser machining,Reference Pecholt and Molian76 for example, leading to even greater flexibility in selection of materials.
An additional, technologically important goal of materials science and engineering is to establish the linkage of material properties (set by processing and structure) to the performance of components formed from the material. The theta specimen can be used to great effect to predict the manufacturing yield and operational reliability of MEMS components. Strength distributions measured with theta specimens can be used to predict the strength distributions of other components fabricated by the same process; the theta strength distribution is used as input to extrapolate to the scale of the components (in the manner of the dashed lines in Fig. 1). If the loading spectrum and reliability of the components are known or assumed, the component strength distribution can thence be used to predict the lifetime spectrum of the device. Alternatively, theta specimens could be incorporated into witness chips on MEMS wafers to ensure that fabrication processes remain within specification or to enable lifetime assurance on a wafer-by-wafer basis.
A critical enabling element of the theta specimen protocol in enhancing yield and reliability is the ability to test a statistically relevant number of samples such that a lower bound or threshold value of a strength distribution, σ th, can be determined with sufficient precision to be useful in design. If a precise strength threshold can be determined, the manufacturing and reliability design processes change from the stochastic process of minimizing the probability that a component or system will fail to the deterministic process of controlling the component geometry or manufacturing or operating environments such that a component is never exposed to stresses above the threshold strength and thus never fails. Here the relative precision of the threshold strength was a few percent, suggesting that designing components to within a safety factor of 2 or even less is feasible.
ACKNOWLEDGMENTS
The authors thank George D. Quinn of the National Institute of Standards and Technology (NIST) for assistance and guidance with fractography and Weibull statistics. Research performed in part at the NIST Center for Nanoscale Science and Technology.