

Histories of mass migrations are almost always comparative, whether explicitly or implicitly. For example, claims about the modernity of the transatlantic migrations of the nineteenth century and their embeddedness in the processes of industrialization, liberalization, globalization, and improved communication technologies, establish a difference from earlier times and from other places such as Asia which did not undergo such massive transformation and are assumed not to have experienced so much mass mobility. Similarly, studies of Chinese emigration are suffused with assertions and counter-assertions about the distinctness and ‘Chineseness’ of those migrations, debating whether or not Chinese people had a unique propensity to be sojourners, to be unwilling to migrate, to be attached to their homes, to have a bias against female migration, to form associations, to resist assimilation, to engage in business, or to establish resilient networks and personal relations (guanxi). And studies of almost any specific migrant flow are framed by assumptions and demonstrations of what is unique and generalizable about that flow.
Unfortunately, however meticulous the original research, these comparative dimensions are often grounded in poor empirical knowledge and stereotypes. Claims about the uniqueness of Chinese migration often uncritically accept myths of the monodirectional European settler, who had weak ties to home, a weak associational life, and was readily assimilated. Historians of European migrations will easily recognize the inaccuracy of these characterizations. Similarly, claims about the unique nature of the Atlantic migrants often rest on stereotypes of Chinese migrants as mostly indentured, unaware of the world, unlikely to settle, and driven to move only by famine, overpopulation, coercion, and European intervention. Even accounts that are critical of racist and orientalizing attitudes tend to replicate these kinds of characterizations. While some of these causes have been found to have played roles in particular European migrations (such as the Irish potato famine), historians have largely downplayed them as important explanations of the broad scope of mass migration over the nineteenth century, preferring to emphasize such broader causes as industrialization, commercialization, transportation, and political liberalization. To continue to depict Chinese migration in the terms listed above is to understand it as having existed in isolation from the forces that shaped European emigration and Chinese people as having behaved according to categorically different impulses than Europeans.Footnote 1
The search for similarities is another form of comparison, from which Asians are often excluded. This kind of comparison usually aims to create generalizations about the patterns and cycles of migration. It requires analyses that move back and forth between case studies and the understanding of broader patterns. This is very well developed for the transatlantic migrations, where case studies proliferate and the broad patterns are well known. On the Chinese side, however, our understanding of the broader patterns is still comparatively rudimentary. Most generalizations are projected from case studies only, and attempts to establish generalizations are often criticized for essentializing Chinese identities.Footnote 2 This lack of knowledge means that generalizations developed in the Atlantic can easily be projected as understandings of migration as a whole. Claims that those generalizations are historically specific to the Atlantic are often then deflected with the argument that areas beyond the Atlantic did not yet have the conditions to produce the modern mass migrations that are the subject of these generalizations.Footnote 3
A better understanding of the broad patterns of Chinese migration is necessary to allow the comparative work that will establish these migrations as part of the global wave of mass migration in the nineteenth century. This will help to overcome the East–West stereotypes and show how patterns of Asian migrations operated according to principles similar to those of the transatlantic migrations. It will also help to establish the differences – both between different Chinese flows and between Chinese and non-Chinese flows – and to avoid projecting patterns that were specific to the Atlantic as generalizations that are applicable to all migrations.
This article begins by establishing some broad outlines of Chinese migration from 1850–1940, in terms of both broad trends and the comparisons of specific flows. It then compares those patterns with Chinese migration to Manchuria and some non-Chinese flows (mostly transatlantic, owing to the ready availability of data and the prominence of the Atlantic in existing research). Special attention is given to return and female migration, two quantifiable phenomena that can be linked to economic cycles, family structures, and patterns of migration such as sojourning that are often thought to be unique to the Chinese. Sources for the charts, tables, and other quantitative claims are discussed in the appendix.
The main goal of this paper is establish the significance of Asian migration as part of the global wave of mass migration from the 1840s to 1930s. But some of the most interesting conclusions are methodological ones on how to frame comparative and global research. The first such conclusion is the importance of situating any comparison within historical time. Trends in return and female migration around the world grew more similar in the late nineteenth and early twentieth centuries. This convergence took place even as the destinations of migration diverged into segregated systems in the late nineteenth century; and on into the 1920s and 1930s, when emigration rates also diverged and political boundaries increasingly segregated migration. Rather than only finding absolute differences and similarities between flows that can be explained in terms of different cultures and local economic contexts, we also find that patterns of migration changed and that differences emerged and disappeared in the context of common global forces.
The second conclusion concerns the need to be aware of how similarities and variations emerge according to the scale of analysis. Commonalities across the world are most likely to appear at the level of large, aggregate comparisons. This is the scale at which specific variations are most likely to be subsumed under common global forces. The smaller the flows being compared, the more likely that significant differences will appear, generated by specific local and historical contingencies. History does happen as a result of local choices, often with effects that are at odds with global trends. But global trends do exist, and may have an important role in structuring possible local choices. Neither perspective is truer than the other.
Both of these conclusions point towards the need for a broader awareness that migrations must be understood within the context of global history. The work of analysis often proceeds best by breaking down and comparing. This is an important method of approach, but it can all too often reify particular groups and project findings from one region or scale of analysis into larger generalizations about the nature of particular migrations, of migration in general, or of East versus West. This method must be augmented with attention to broader processes, how those processes changed over time, and how different contexts become visible at different levels of analysis. This includes an awareness not only of the similarities across the world but also of the ways in which difference is produced.
Overview of Chinese migration
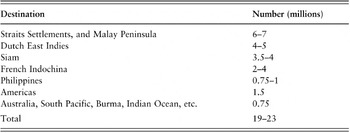
About 20 million Chinese emigrated overseas from 1840 to 1940, of whom 90% went to Southeast Asia (see Table 1). In terms of overall numbers and density of emigration, Chinese migration was comparable to European overseas migration, and very much a part of the global wave of mass migration from 1840 to 1940. Data to measure this migration are readily available from the south China ports of Xiamen, Shantou, and Hainan after the 1870s, and from Hong Kong after the 1850s. These emigration data correspond extremely well with Singapore immigration data after 1880, creating a strong foundation for comparison with other well-documented migrations. Data for other destinations are often not as detailed or reliable (see appendix). Thus, in addition to describing the overall scale of Chinese migration, this section also establishes the relative importance of the various emigration ports and Singapore in the overall patterns of Chinese migration, so as to create the context for later figures that focus on flows to and from Singapore and Hong Kong.
Destinations of overseas Chinese migration, 1840–1940

Much nineteenth-century migration followed the paths of merchant and labour circuits into Southeast Asia that had been forged over the previous three centuries or more. However, the most important nodes that channelled much of the massive increase in migration after the 1840s were relatively new. For example, Singapore was only founded in 1819 but, in the century after 1840, at least 11 million (over 50%) of overseas migrants passed through that port during their journey, with many continuing on to Malaya, Penang, the Dutch East Indies, and, to a lesser extent, Burma, Siam, and Borneo. Similarly, the burst of migration in the 1850s from the Pearl River Delta region near the newly created port of Hong Kong to the gold fields of California and Australia and the plantations of Latin America and the Caribbean (although most of those destined for the latter left through Macao) probably caused a doubling of the total number of emigrants compared to the 1840s (although it is hard to be precise because numbers of migrants to Southeast Asia before the 1870s are estimates). However, this burst was of relatively short-term significance. Over the following ninety years, migration beyond Asia remained stagnant, blocked by anti-Chinese immigration laws and the decline of convenient transportation to Latin America after the end of indenture in 1874. Numbers to Southeast Asia, on the other hand, increased more than twenty-fold (see Figure 1). In the 1850s and 1860s, as many as 40% of all Chinese emigrants travelled beyond Asia. This declined to 25% in the 1870s, and 10% by the 1880s. For the next fifty years, the proportion of emigrants who went beyond Asia rarely surpassed 6% for any year, except for a brief period from 1913 to 1924 when it returned to 9.5%. Total migration, on the other hand, increased steadily to a peak of 400,000 in 1912, returning – after a dip during the First World War – to a new peak of nearly 700,000 in 1928, before being hit hard by the Great Depression.
Annual overseas migration from South China, 1851–1939.

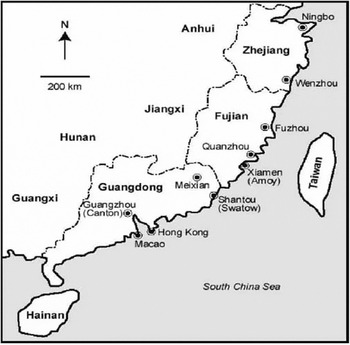
The great majority of emigrants left from four areas in southern China: Hong Kong, Xiamen (Amoy), Shantou (Swatow), and, to a lesser extent, Hainan Island and the Leizhou Peninsula across the straits from Hainan (see Figure 2). Migrants from each area were associated with distinct dialect groups: Cantonese from Hong Kong, Teochiu from Shantou, and Hokkien from Xiamen. One other dialect group, the Hakkas, mostly lived inland from Shantou, in the region around Meixian; most departed through Shantou, although some left through Xiamen, and others living in the Pearl River Delta departed through Hong Kong. A smattering of migrants also departed from the northern ports of Fuzhou, Wenzhou, Ningbo, and Shanghai, mostly to Japan and Europe or to work as seamen.Footnote 4 Migrants from Shandong and Hebei provinces in the north also travelled abroad: 64,000 to the South African gold mines from 1904–07; 150,000 to Europe as labourers during the First World War; and close to half a million to Siberia.Footnote 5 The bulk of the first two flows were repatriated. The migrants to Siberia were part of a broader migration of over 30 million people who travelled from Hebei and Shandong to Manchuria.
South China emigrant ports.

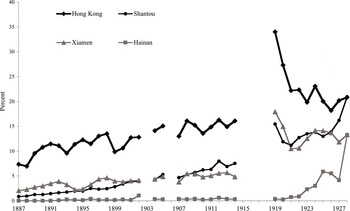
The reverberations of the great boom of Cantonese migration in the 1850s could still be felt in the early 1870s, when 50% of all emigrants still departed from Hong Kong. But the other ports recovered their significance in subsequent decades, hand in hand with the increasing proportion of migrants to Southeast Asia. By the 1880s, the bulk of emigration was evenly divided between Hong Kong, Shantou, and Xiamen, with Hainan growing to a 10% share by the 1890s (see Figure 3). Hong Kong began to recover its importance after the turn of the century, in the 1930s once again accounting for half of all emigrants.
Proportions of emigrants from Chinese ports, 1875–1939. Note: numbers for Xiamen 1929–30 and Hainan 1932–36 are estimates. Hainan customs reported negligible emigration until 1885.

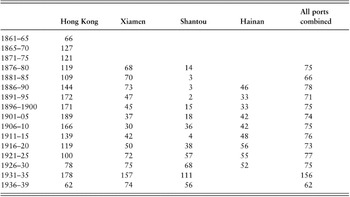
Some scholars have speculated that many migrants travelled to Hong Kong first before departing overseas. Migration data, however, suggest that migrants were much more likely to return via Hong Kong than to depart this way.Footnote 6 Return rates for Hong Kong from the 1870s to 1920s ranged from 120% to 190% (calculated for five-year periods), while return rates for other ports were generally below 50%, sometimes as low as 2–4% for Shantou, and return rates calculated on the basis of the combined numbers of departing and returning migrants from all ports remained steady in the 70th percentile from the 1870s until the 1920s (see Table 2). This pattern of return migration through Hong Kong is further supported by the fact that as many as five times as many coastal passengers travelled from Hong Kong to other south China ports than travelled from those ports to Hong Kong (with Shantou accounting for 60–70% of those voyages out from Hong Kong). The importance of Hong Kong as a node for return migration started to decline after 1912, suggesting that the banking, provision of consumer goods for returned migrants, and other services once provided by Hong Kong could now be more readily accommodated in other ports. At the same time, the importance of Hong Kong as an emigrant port also grew after 1912, suggesting a proportional rise in Cantonese emigrants during that period. The reasons for this rise are unclear, but this growing predominance as an emigrant port in the later years of migration helps explain why Hong Kong and the Cantonese often dominate the historical memory of overseas migration.
Return rates for Chinese ports, 1861–1939 (%)

Indenture to Europeans under long-term labour contracts played a relatively small role in overall Chinese migration. Less than 4% (about 750,000) of Chinese migrants were directly indentured to Europeans. These include about a quarter of a million to the Americas (mostly Cuba and Peru, with some to the British Caribbean, Central America, and Surinam) from 1847 to 1874; over 300,000 to Sumatra and Bangka, most intensively in the 1870s and 1880s but continuing to the 1920s; and perhaps 200,000 to other locations, including Malaya, Australia, and islands in the Indian and Pacific Oceans.Footnote 7 The overall role of coercion and the European plantation economy, however, is much more difficult to ascertain. A total of 844,910 newly arrived migrants signed labour contracts under the auspices of the Chinese Protectorate in Singapore from 1881 to 1915, amounting to 15% of all the immigrants to that city during that period. Many of these were destined for Sumatra, but the majority were contracted out to Chinese employers in Singapore and Malaya, under conditions that remain unclear.Footnote 8 It is likely that many Chinese migrated under some form of debt or labour obligation, whether formal or informal, to other Chinese merchants, recruiters, employers, or collectively operated mines and farms (gongsi), which may have entailed more or less coercion depending on the circumstances.Footnote 9 The same was true for European migrants, many of whom openly signed contracts with employers in the Americas both before and after departure, while others obtained employment through more informal and underground debt and personal obligations in places where contract migration was outlawed. In this sense, the organization of Chinese migration was little different from that of European migration – certainly not different enough to justify the juxtaposition of Chinese ‘coolies’ against ‘free’ Europeans.Footnote 10
One of the most notable features of European attempts to recruit indentured Chinese was – with the exceptions of Peru, Cuba, and Sumatra – their short duration and failure to achieve steady labour streams. European planters in Singapore and Malaya constantly complained of their inability to compete with Chinese recruiters and planters (although they usually formulated these complaints as attacks on the ‘evils’ of Chinese secret societies and corrupt innkeepers who took advantage of ignorant peasants and undermined free markets). Indeed, the Chinese Protectorate was as much a (failed) attempt to channel Chinese labour to local British planters as it was an attempt to protect the interests of migrants.Footnote 11 But if formal indenture projects were of relatively little significance in the overall mobilization of Chinese migration, they were enormously significant in the production of diplomatic correspondence, sensationalistic journalism, investigative reports, popular images, and the historical memory of Chinese migration. This documentation is, more than anything, responsible for the images of earthbound, immobile Chinese and victimized coolies who would not have migrated without the direct intervention and coercion of Europeans and their capital.
Chinese migration in global and comparative perspective
Whatever the role of direct European intervention in Chinese migration, there is no doubt that European capital and industrialization provided a context for the overall growth of Chinese migration as part of the global wave of mass migration in the nineteenth century. Migrants from China, Europe, and India moved to the less-populated frontiers of the Americas, Southeast Asia, and northern Asia, each of which received over 50 million migrants.Footnote 12 All of these flows grew steadily over the nineteenth century and reached peaks in the 1910s and 1920s. The entanglement of the Chinese with these global trends is obvious in the mid nineteenth century, when Chinese people joined Europeans in the settlement of frontier gold fields and the construction of railway lines in North America and Australia. With the rise of exclusionary laws in the 1880s, Chinese migration was increasingly restricted to Asia;Footnote 13 however, it remained no less entangled in the global economic processes that generated migration. The tin mines and rubber plantations of Malaya, the rice fields of southern Vietnam and Thailand, the soy and wheat fields of Manchuria, and the ever-expanding Chinese marketing networks stretching from the Amazon to Siberia were as much a part of the expanding global economy as were the factories of Chicago, the sheep ranches of Australia, and the coffee plantations of Brazil.
Migrations around the world were linked through an ever-expanding global industrial economy, but they were each inserted into this economy in distinct ways. The linkage can be seen in the growing homogenization in overall patterns of outward, return, and female mobility between Chinese and European migrations. Differences that once existed were increasingly overcome by the early twentieth century. This convergence took place even as the destinations of migrants grew increasingly segregated (see Figure 1) and the relations of migration to overall economic development began to diverge. Moreover, when we narrow our scope down to particular flows, the differences grow more pronounced. It can be hard to specify the similarities and differences due to the difficulties of establishing similar units of analysis, but a series of varied comparisons can help to establish that these differences are as apparent between specific Chinese flows as between Chinese and European flows. From here, we can begin to distinguish between conditions that were specific to certain regions, such as Southeast Asia and the Atlantic, and between specific migrant circuits within those regions, each of which was produced through a unique historical nexus of these broader forces.
Global comparisons of emigration rates and the distance and costs of voyages address questions about the causes of mass migration. To what extent were high-density migration and the choice of destinations generated by factors such as improved transportation infrastructures, access to information, liberal migration controls, job opportunities, relative costs of migration compared to incomes at home or abroad, population density, urbanization, industrialization, or the penetration of commercial economies? If overall migration rates and the expenses associated with migration in Asia were comparable to those in Europe and across the Atlantic, we would be compelled to question the importance of many of these factors. There is little doubt that the Atlantic was significantly advanced over Asia in terms of communication infrastructure, urbanization and industrialization. However, if Atlantic mobility were no higher than that in Asia then either these were not important causes of mobility or else the expanding world economy also generated other causes of mobility in Asia.
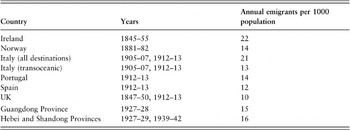
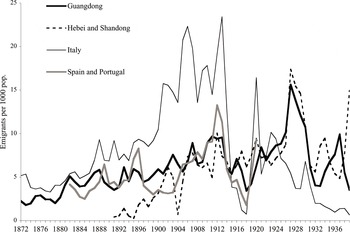
First, let us establish some of the similarities between Chinese and European emigration. At first glance, 20 million overseas Chinese may seem like a drop in the bucket compared to the many millions who departed from much smaller countries such as England, Germany, Italy, and Spain. But if we compare regions of similar size and population, the peak emigration rates (annual migrants per 1000 population) are quite similar (see Table 3). Even during the peak European years of 1912–13 (which were not peak years for China), emigrants also left Guangdong and north China at a rate of 9.5 migrants per thousand, not far behind the highest European rates.
Some peak emigration rates

Note: Numbers for Spain and Guangdong are only for overseas destinations, and numbers for Hebei and Shandong are only for Manchuria. Numbers for Ireland, Norway, Spain, Portugal, and the UK are for all destinations, although European destinations amount to a small proportion in these cases.
Emigration rates (emigrants per 1000 population) around the world also changed concurrently over time. For example, emigration rates from Guangdong Province, north China, Italy, and Iberia all grew steadily until the 1890s, after which they increased more dramatically until the First World War, and then again in the early 1920s (see Figure 4). The timing of short-term fluctuations also corresponded remarkably well, rarely diverging by more than a year. Local variations to these common patterns include the relatively late start of mass migration to Manchuria, the decline of Iberian migration around the turn of the century (also apparent in the Portuguese numbers, so not entirely explainable by the effect of Cuban revolution on Spanish emigration), and the decline of Italian migration in the 1920s with the erection of migration barriers in the United States in 1924 and emigration barriers from Italy in 1927. With the coming of the Great Depression, Chinese migration, especially to Manchuria where the Japanese continued to pump money into the local economy, weathered the tough times much better than European migration.
Emigration rates from Guangdong, Hebei and Shandong, Italy, and Iberia, 1872–1939.

The comparison of emigration rates brings up the question of the relevant units of comparison. The four flows in Figure 4 were chosen because they originated in areas of relatively similar size and population and all peaked in the early twentieth century. This helps to illustrate some broad similarities in disparate parts of the world. However, more detailed comparisons have to confront the problem of what exactly is being counted. For example, Figure 4 only counts migrants from Guangdong and not Fujian, in part because I could not find reliable population statistics for Fujian but mostly because only the southern third of the province was a significant emigrant region. Given the entire lack of sub-provincial population data, should I only calculate emigration rates in proportion to one-third of the Fujianese population? This is only the most egregious example of the fact that emigration was always uneven. Within any nation, province, county, or sub-county district, emigration rates and practices could vary greatly from region to region and from village to village. Any of the larger units used in Figure 4 could have been sliced up into smaller regions or amalgamated with other nations and provinces to generate very different rates.
There are also the problems of who is being counted and what kinds of voyages. These are problems both in the collection and presentation of historical statistics and in the comparability of different kinds of travel within or across borders and of greatly varying distances. The Iberian statistics only count transoceanic emigrants, who usually made up over 90% of all emigrants. The Italian numbers include all migrants, both transoceanic and within Europe. I chose to use these numbers in part because I had access to a longer time series than for the transoceanic numbers, and in part because the higher numbers made the chart a bit more legible. Had I plotted only the transatlantic Italians, the line would have been harder to distinguish from the other three, except that it was lower in the 1870s and early 1880s and had two exceptionally high peaks around 1906 and 1913. Neither the transatlantic nor the total Italian numbers, however, would be directly comparable to the Chinese numbers in terms of distance and cost of voyage. The journeys from north China to Manchuria were relatively short voyages within a single nation, probably comparable to intra-European migrations in terms of expense but longer in terms of time because of the poorer infrastructure. The voyages of southern Chinese to Southeast Asia were longer than most intra-European journeys but shorter than the transatlantic voyages. Furthermore, both emigrant regions also sent migrants to other parts of China, sometimes at distances longer and more costly than the journeys abroad and to Manchuria. I do not have a good estimate of rates for intra-Chinese voyages (although this should be possible by looking at Chinese customs reports for domestic passenger traffic) but I suspect that they were higher than the Iberian and lower than the Italian intra-European journeys.
Rather than seeing this as a problem, perhaps we can treat issues of units and scale as a methodological premise. The larger scales of comparison show the broad processes that have shaped developments over larger regions. As we move down in scale, we find specific historical conjunctions of these broader forces and local events that create increasingly divergent histories. With this increased variation, the choices of unit and grouping will become more critical. The emigration history of one village may not look at all like the history of the neighbouring village, even though both are counted in the overall statistics that show that residents of Guangdong Province were much more likely to travel overseas than those from Zhejiang. This variation ultimately reaches the point of absolute and irreconcilable difference at the smallest scale of the choices of the sister who decided to stay at home and the sister who travelled 5,000 miles. Both of these personal choices, however, and the economic and personal circumstances that resulted from these choices, were ultimately made possible by the broader forces that come into focus most clearly at the largest scales.
Return rates (return migrants as a proportion of emigrants) are a good way to approach these variations of scale. Return rates are less hampered than outward rates with ambiguities in the units of comparison because they are generated by comparing outward and return streams within the same flow. They rarely have the clear long-term trends of emigration rates, but the short-term cycles correspond very well to business cycles. When employment abroad is good, return rates tend to be low; when employment prospects are poor, return rates are high. Average return rates over several decades are linked to specific local conditions such as family structure, occupation, cost of voyage, and so on. But a comparison of return cycles can show the extent to which migrant streams were embedded in common economic forces that crossed the variations in average rates.
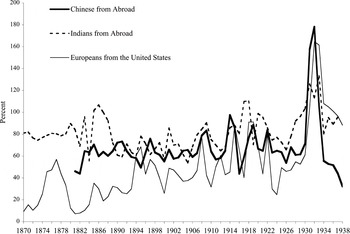
A comparison of the return cycles of Chinese (from all destinations), Indian (from all destinations), and European (from the United States) migrants shows a convergence from the 1870s to the 1930s (see Figure 5). In the 1870s and 1880s, the return rates were very diverse. By the 1890s, they began to converge, not only in their timing but, even more surprisingly, in their absolute proportions. The economic conditions shaping migration were converging around the world (although Manchurian migration, shown in Figure 7, corresponds much less well, for reasons discussed below). When we compare these findings to those of Figure 1 (and to similar trends of concentration within Asia for Indian emigrants), we find that global migration became much more segregated in its destinations even as it became more integrated in terms of short-term cycles and their economic context.
Return rates of major emigrant flows, 1870–1938.

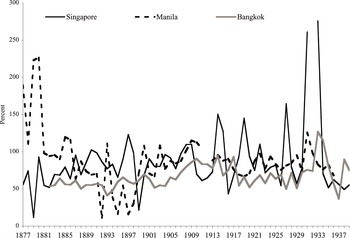
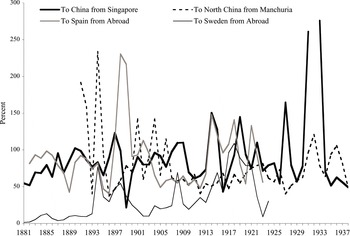
If we narrow this comparison to more specific flows, however, the similarities start to dissipate. Chinese return rates from Singapore, Manila, and Bangkok show much less convergence than do the large global flows (Figure 6). The return rates of Spaniards, Swedes, Chinese from Singapore, and Chinese from Manchuria are even more disparate (Figure 7). The migrant flows compared in Figure 7 are admittedly eclectic. To some degree, this is a limitation of readily available data, but almost any comparison at these smaller levels would be equally unimpressive in the amount of correspondence.
Chinese return rates from Singapore, Manila, and Bangkok.

Return rates of diverse migrants flows, 1881–1938.

However much the broad trends of migration were increasingly embedded in common global conditions, specific flows still had their own histories at specific nexuses of these conditions. The diverse trajectories shown in Figure 7 allow us to suggest what those specific histories might look like. For example, the spike in Spanish return rates at the turn of the century can probably be attributed to the Cuban revolution, although the lack of response to the economic crisis of 1907 (as is also the case for Manchuria) is less easy to explain. In Manchuria, the great fluctuations around 1895 were surely an effect of the Sino-Japanese war, and those around 1905 a result of the Russo-Japanese war and competition from South African recruiters in north China (although both of these fail to explain the huge spike of returns in 1901). After 1908, Manchurian cycles are in greater synchronization with the other flows shown in Figures 5 and 7, although usually at a one-year lag and with less volatility. This correspondence weakens in the Great Depression, when the Japanese continued pumping money into Manchuria. Manchurian return rates did not spike nearly so much as other flows, and emigration reached new peaks in the late 1930s.
Swedish return rates, in comparison, seem to follow an entirely different logic than the other three. The Swedes are an example of a large flow that has so far received little attention in this analysis, that of north-western Europeans. Migration from this area grew more dramatically than anywhere in the world in the 1840s and 1850s and peaked in the 1880s, generally with relatively lower return rates and higher proportions of women than migrations in other places and times. North-west Europe was not immune to the trends of global history. Migration from that region also participated in the global burst after the 1890s, reaching a secondary peak in the early 1900s, often with more returns and fewer women than before (as was certainly the case for southern and eastern Europeans in comparison to north-western Europeans). However, even then, these higher returns followed a slightly different dynamic than other flows.
The variations between different parts of Europe point towards broader regional differences between transatlantic migration and Chinese emigration abroad. Most of the origin regions of Chinese emigration in the 1930s were the same as those in the 1850s. Specific villages and counties might have shifted, and mass migration from Hainan was relatively new after the 1880s, but the bulk of emigrants still departed from the hinterlands of the three main emigration ports. In Europe, on the other hand, waves of migration swept dramatically across the continent from north-west to south-east Europe from the 1840s to the 1910s. Flows from specific regions could rise and fall dramatically in the space of five or ten years. These constantly shifting flows correlated with the spread of industrialization in Europe and with the convergence of wages between the Americas and northern Europe, which helped to reduce migrations from the north.Footnote 14 In Asia, on the other hand, there is no evidence that wages ever converged between Southeast Asia and either China or India, despite the relocation of millions of labourers.Footnote 15 Most migrants continued to travel from rural areas to rural areas, and occupations abroad also remained relatively stagnant, without the transition from agriculture to industry, finance, and urban sectors seen around the Atlantic. Despite a gradual concentration over time into retail and middleman activities in Southeast Asia, the agricultural, mining, transportation, and artisan jobs that occupied migrants in the 1850s still predominated in the 1920s.Footnote 16 Transoceanic migration around the world may have been embedded in a common global economy, but each region was inserted into that economy differently.
Perhaps the biggest difference between Chinese and European migration (or between European and all of the other important global migrations) is the long-term legacy over generations. About 11 million Chinese could be found outside China in the early 1950s, and 27 million in the early 1980s.Footnote 17 This was similar to the European-descended population of Canada alone (although growing more quickly than the Canadians). The total number of descendants of European migrants in the 1950s exceeded 250 million (while Indians amounted to only 4.6 million).Footnote 18 Whatever the similarities in actual numbers and density of emigration, the genetic, political, and social impact of European emigrants has dwarfed that of other migrants.
Several factors have contributed to these legacies, including differences in environments, occupations, and social structures at the destinations, rates of return and female migration, and the wealth and power of the Europeans’ home nations. As shown in the next section, Chinese and Indian women were much less likely to emigrate than Europeans. Chinese return rates also averaged over 70%. Although European return rates crept up to the 60% range by the early twentieth century, the higher rates of settlement in the early years of migration are much more significant in producing the generations of descendants that made up the ethnic legacy. A variety of factors may have produced these differences, including different family structures, greater willingness of Asians to marry native women, the cost of return voyages in both time and money, and the fact that most Asian migrants engaged in rural labour on tropical frontiers. Most Europeans migrated to temperate frontiers, where small farms and even the new cities of the Americas provided a much better context for raising a family than did tropical plantation and mine work. Rural and urban retailing in the tropics, on the other hand, did provide a good context for families, but this did not give a steady source of employment for large numbers of Chinese people until the early twentieth century, after which numbers of female migrants did begin to rise.
The exclusion of Chinese people from the temperate frontiers was not mere coincidence, but a product of power. Nearly all Asian emigrants other than those to Manchuria moved either to tropical frontiers or to places with well-established native or colonial states. European emigrants, on the other hand, almost always became the power-holders in the places that they settled, and displaced the bulk of the natives on the temperate frontiers. The erection of anti-Chinese laws and immigration barriers in the white settler nations around the world helped keep Chinese migration out of the temperate areas and restricted to the tropics. Moreover, the locally born children of Chinese migrants, whether born of Chinese or local spouses, often identified with the dominant societies and were counted as local Vietnamese or Thai. Europeans might become Americans, Argentinians, or Australians, but their European origins still remained obvious.
Manchuria supplies an example of how the long-term legacy of Chinese emigration looks different on a temperate frontier with substantial urbanization, where the natives were almost entirely displaced and where, despite interludes of Russian and Japanese intervention, the Chinese ultimately maintained political control (not least because they overwhelmed the place with migrants). Nearly 50 million Chinese resided in Manchuria by 1953, over four and a half times the number that could be found abroad. On the other hand, both the United States and Manchuria started with populations of about 6 million in 1800 and received similar numbers of migrants over the succeeding 140 years, yet the end result was a much larger population in the United States than in Manchuria, with the former counting 134 million people of European descent by 1955. The differences must be explained by the facts that the mass migrations to Manchuria began later, average return rates were higher (about 65%), and female migration rates were low (10–15%, even into the 1930s).Footnote 19
Any complete analysis of comparative global migration patterns and their relation to the world economy and regional differences would have to expand the scale of analysis to include the entwined processes of domestic migration, urbanization, and military mobility. Merely looking at transoceanic migrations only addresses one particular dimension of global processes, because the oceans around the world were all relatively well connected through European- and Japanese-dominated shipping, and frontier plantation zones were closely connected to the industrial core. Better knowledge of the densities and destinations of overland and domestic migrations, in areas where infrastructure and economies varied greatly, is necessary to understand better the causes of migration and to comprehend the varieties of integration and differentiation in the modern world.
Migration of Chinese women
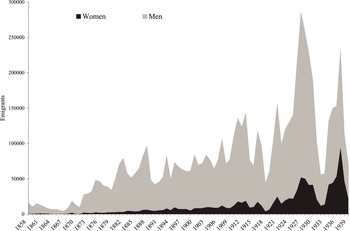
The Chinese had one of the lowest rates of female emigration in the world. Only 16% of all migrants from Hong Kong between 1858 and 1939 were women, and annual rates were always lower than this until 1923, when the proportion of women began to increase rapidly (see Figure 8). This clearly distinguishes Chinese flows from the major European flows, most of which averaged around 35–40% women, although proportions of women from south-east Europe were sometimes much lower (and scattered evidence suggests that the migration of women from India was also as low as or lower than that for the Chinese). Like the cycles of return migration, however, proportions of female migration around the world converged over time, but this happened at a much later date than for return migration. It also happened at a time, after the First World War, when some of the other patterns of specific migration streams were growing increasingly divergent and subject to various forms of migration control. As with the preceding analysis of return migration, a comparative analysis of female migration can help to identify the existence and timing of broad forces, regional and local peculiarities, and their interaction.
Male and female emigrants from Hong Kong, 1858–1939.

The structure of the Chinese family provides a possible explanation for the overall low rates of Chinese women. As in many parts of southern and eastern Europe, the ideal family in China was a multigenerational patriarchal stem family. The preservation of this lineage through time, with property and land intact, was often a higher priority than the co-residence of spouses and children. Young men were frequently sent to cities and abroad to make money that would ultimately be used for the benefit of maintaining the family, while women stayed at home to take care of the household, farms, children, and old people. This was a strategy that could continue for generations. When men did establish new families abroad they were often with second wives, both locally born and brought over from China. In contrast, north-western Europeans generally lived in small nuclear households. Women from this region were more likely to migrate as part of family relocation or as young single women looking for work.Footnote 20
As with return rates, however, the picture becomes more complicated when we disaggregate the numbers into smaller streams, and when we look at changes over time. For example, the proportions of women migrating to Singapore from different ports in south China varied significantly. Women from Hong Kong arrived at over twice the rate of women from other ports (see Figure 9). Hainanese women, on the other hand, were negligible until the 1920s. The proportion of Cantonese women was still significantly lower than most European flows, remaining under 20% before the 1920s. There was indeed a general difference between Chinese and most Europeans that could plausibly be rooted in family structure. However, appeals to the patriarchal stem family still can not explain why the proportion of women should vary from flow to flow.
Women as a proportion of total migrants from Chinese ports to Singapore, 1887–1928.

The explanation of these varying rates does not lie in variations between the different dialect groups. Hakka women are sometimes thought to be more likely to migrate than other Chinese women, because of their unbound feet, greater participation in the household economy, reputation for hard work, migratory heritage within China, and relatively frequent conversion to Christianity.Footnote 21 But most Hakkas in Singapore emigrated through Shantou, which had much lower rates of female emigration than Hong Kong. More to the point, the high rates of Cantonese women were specific to Singapore. Proportions of Cantonese women migrating to other destinations were similar or even lower than those of non-Cantonese migrants to Singapore (see Figure 10). Thus, the explanation of variations in female migration has to be sought in specific migrant circuits.
Female migrants as a proportion of total emigrating from Hong Kong to various destinations, 1860–1939.

Rather than looking only at conditions in the region of origin or destination to explain differences in female migration, we have to look at the historical circumstances specific to each flow. This requires greater attention to the question of why Chinese women migrated (or not). Did they migrate for reasons similar to men, in search of work and high wages? Were they coerced into migration? Or did they mostly migrate as wives, daughters, and wives-to-be, to rejoin or create families? The reasons varied from case to case, and also over time.
For example, the high number of Cantonese women travelling to Singapore may be due to the silk-weaving women of Shunde county. These women tended to remain single all of their lives, living together in all-female communal homes and continuing to contribute economically to their natal families. Many are known to have migrated to Singapore for employment, sending money back home much as male sons did. Few are known to have migrated elsewhere.Footnote 22 The negligible rates of Hainanese migration, on the other hand, may be due to the relative lateness of the establishment of that migration stream. This argument, however, implies that females emigrated largely for the sake of family cohabitation, not departing until men had established themselves well enough to support the migration of wives and daughters. But relatively high rates of female migration in the earlier years of migration to the Americas reminds us that we must not take this explanation for granted. These high rates are a combination of both attempts to recruit women for plantations in Surinam and relatively high rates of female migration to San Francisco, many of whom may have migrated to work as prostitutes. Prostitution in both California and Singapore seems to have declined after the 1870s. The reasons are unclear, but may have something to do with attempts by Chinese elites and American officials to limit their emigration from Hong Kong.
The imposition of exclusionary laws in the United States and Australia also had an effect on rates of female migration, although not necessarily in the direction predicted by the common assumption that exclusionary laws stopped the immigration of women. In both cases, the proportion of women actually grew as exclusionary measures took hold. In the United States, the proportion of women rose from about 2% of all arrivals in 1881 (the year before exclusion) to 5% in the late 1880s and 14% in 1889, the highest proportion of any year until the 1920s. This is because the exclusion laws were directed at excluding male labourers, and women could still migrate under the conditions under which many if not most had migrated in the 1870s, as spouses and daughters. A similar bump in female migration to Australia happened in 1905–09, after the establishment (1901) and strengthening (1905) of the dictation test to keep out Chinese immigrants. Over time, however, female migration returned to pre-exclusion rates or less.
But even then, female migration to North America was never as low as that to Latin America. In this context, it is helpful to think of female migration in terms of the cost of migration. The more expensive the journey, the less likely that families would spend resources to send women abroad, whether as family members or wage earners. Exclusion laws made migration to North America and Australia very expensive. However, the great distances made travel to the Caribbean and South America equally expensive.Footnote 23 As is obvious from all these cases, the variations and possible explanations are numerous and complicated, fully justifying the production of specialized monographs on particular streams. Such monographs will always be richer, however, if written with awareness of broader patterns and an eye towards helping to understand some of the larger puzzles of migration.
In the case of female migration, one of the big puzzles is the broad similarities in trends over time. After some variation in the 1860s and 1870s, all of the Chinese flows in Figures 9 and 10 settled on relatively stable proportions of women for three to four decades, which then which began to grow in the 1910s and 1920s, and boomed in the 1930s, reaching nearly 50% for Cantonese migrants to Singapore. Almost identical trends can be found for proportions of European women to the United States, although the slope for the 1920s and 1930s is not quite so steep because European women started with higher numbers and then topped out at about 50% or 60% (Figure 11).Footnote 24 As had happened with return rates after the 1890s, Chinese women migrated at rates more similar to Europeans after the 1920s. Did the Chinese family suddenly dissolve and lose its constraining effects on female migration in the 1920s and 1930s? There is little evidence that rural Chinese families changed fundamentally in this period, although footbinding was in rapid decline, while female education was on the rise. But the rise in female migration was global, transcending the effects of local changes in China.
Female migrants as a proportion of total migrants from European countries and Hong Kong, 1820–1939. Note: Rates for European countries are only to the United States, while rates for Hong Kong are to all destinations.

If the broad picture remains a puzzle, the overall trends can also help us decide where to look for an explanation. For example, the Depression of the 1930s looks like an immediate candidate for understanding shifts in female migration, but more careful examination suggests that we have to focus earlier. The Depression stifled male migration for employment, with the effects of making female migration appear proportionally larger and of suppressing the viability of migration as a means of supporting transnational stem families. This latter effect also helped increase the number of women, as families increasingly made choices to settle abroad or at home as smaller, nuclear units. This explanation, however, assumes that the bulk of female migration was for the purpose of family reunification. It falls short for at least three reasons: first, the global rise in female migration began in the 1910s and 1920s, before the Depression; second, both male and female Chinese migration were booming again in the late 1930s; and third, Chinese women also returned to China at higher rates that were more similar to men after the 1920s. The Depression certainly had some effect on female migration, but that effect built on changes that had begun in the 1910s, changes that may well have been grounded in the changing nature of female migration.Footnote 25
Overall, women made up a lower proportion of migrants retuning to Hong Kong than departing (see Figure 12). When they went abroad they were more likely to stay. This suggests that female migration was part of the process either of relocating families or of establishing bi-nuclear households. But, beginning in the 1910s, the proportion of women returning increasingly resembled the outbound proportion. This suggests that women were more and more likely to migrate according to the same employment and business cycles as men, whether to work in family businesses or to find their own employment. The annual changes in female migration confirm this impression. Until the 1890s, annual numbers of female and male migrants rose and fell in very different directions and proportions. After 1900, female rates remained more volatile than those for male migration but were more likely to change in the same direction. In other words, women increasingly behaved like male migrants. This appears to have been true for female migrants around the world, regardless of family structure. However, this argument remains a hypothesis until supported by specific research.
Women as a proportion of migrants to and from Hong Kong, 1861–1939.

Putting migration in world history
Chinese migration was part of the global wave of mass migration from the 1840s to 1930s. It cannot be contained neatly within categories of indenture, sojourning, and response to famine and overpopulation, but was part of the same processes that shaped migration around the world. Starting from this assumption of commonality, we can better specify the differences between migrant flows and understand them as variations on common processes. We can also learn when not to generalize the experiences of certain (usually transatlantic) migrants as typical of all modern migrations.
We find that Chinese migrations do differ from many other migrations in the low proportion of women, the lack of wage convergence, the relative stability of sending regions over long periods of time, and a relatively low number of descendants compared to European migrants. When looked at as trends over time, however, cycles of Chinese return and female migration became increasingly similar to those of other migrants around the world, suggesting that even these differences were embedded in common global processes. At the same time, the destinations of Chinese people were increasingly limited to Asia. The segregation regions of Asian migration were also areas with different economic development from the Atlantic, with wages remaining stagnant, urbanization scarce, and migrant origins and occupations having changed relatively little. Yet such economic divergence was embedded within a global economy that produced increasingly similar cycles of migration around the world.
Variations increase as the scale of analysis grows smaller, both across and within larger flows. To some extent this is an artefact of different levels of generalization. For example, the observation that all migrants form associations that play important roles both in adaptation abroad and in maintaining connections to home is entirely compatible with the fact that the form, influence, activities, scope, and intensity of such associations have varied from group to group and from place to place.Footnote 26 Yet the different scales can also draw attention to entirely different processes that are often not apparent in the comparison of specific case studies. This is especially true when we plot trends over time – such as the fact that, at the turn of the twentieth century, migrant associations grew increasingly politicized and focussed on the creation of common ‘diasporic’ and nationalist identities (or, on the flip side, took up explicitly assimilationist ideologies). The specific timings and forms of this awareness always varied, but few migrants groups escaped the pressures of a consolidating international system. By bringing global patterns into our understanding of migration history, we can better situate our case studies so as to understand the causes and effects of migration.
Ultimately, a better understanding of global migration patterns will help to create a better understanding of world history, with grounded narratives that engage with regional differences and do not project European models as global templates. If Chinese migration followed many of the same demographic trends as other migrations around the world, we must rethink causes of migration that were developed through the study of Atlantic migrations. Similarly, a better sense of how some differences disappeared over time and others became more pronounced will produce insights not only into how the world is integrated over time but also into how it came to be differentiated into West and East, rich and poor, developed and developing.
Appendix: sources and estimates
The main quantitative sources for Chinese migration are the Hong Kong Harbourmaster reports from 1856 to 1939, generously provided to me by Elizabeth Sinn from her Hong Kong Research Grants Council funded project, ‘The impact of Chinese emigration on Hong Kong’s economic development, 1842–1941’; Chinese customs reports for Xiamen (1874–1928), Shantou (1869–1929), and Qiongzhou (1876–1929), published as Imperial Maritime Customs, Customs Gazette, Quarterly Returns of Trade, Shanghai, 1869–1913, China Maritime Customs, Returns of Trade and Trade Reports, Shanghai, 1914–1919, and China Maritime Customs, Annual Trade Reports and Returns, Shanghai, 1920–29; and the Reports of the Singapore Protector of Chinese from 1881–1938. The latter were found as part of the Straits Settlements, Annual Reports, Singapore: Government Printing Office, 1881–1939, at Mudd Library in Yale University and at the New York Public Library.
Additional data from Chinese customs for the 1930s is in Lian Xinhao, ‘Jindai haigang jianji yu Dongnanya huaqiao yimin (Modern port hygiene and Chinese migrants to Southeast Asia)’, Huaqiao Huaren Lishi Yanjiu, 1997, pp. 50–1, for Xiamen and Shantou; Li Zhiya and Huang Yinying, eds., Huaqiao yu Qiaowu Shiliao Xuanji Bian (Selected documents on overseas Chinese and overseas Chinese affairs), Guangzhou: Guangdong Renmin Chubanshe, 1991, pp. 39, 133–4, for Hainan and Shantou; and Kaoru Sugihara, ‘Patterns of Chinese emigration to Southeast Asia, 1869–1939’, in Kaoru Sugihara, ed., Japan, China, and the growth of the Asian international economy, 1850–1949, vol. 1, Oxford: Oxford University Press, 2005, pp. 246–56. In instances of discrepancy, I relied on Sugihara both for the sake of consistency (he offers the most complete numbers) and because he is most explicit about his methodology. Sugihara’s numbers for Hong Kong, however, are incomplete and I have relied entirely on the data provided to me by Elizabeth Sinn, much of which is also presented in her ‘Emigration from Hong Kong before 1941: general trends’, in Ronald Skeldon, ed., Emigration from Hong Kong: tendencies and impacts, Hong Kong: The Chinese University Press, 1995, pp. 11–34. Emigration numbers for Xiamen for 1929–30 and for Hainan for 1932–36 are my own estimates, based on trends and immigration statistics at main destinations.
For Table 1 and Figure 1, numbers of emigrants from Macao and Whampoa until the 1870s and from Hong Kong before 1856 were gathered from Charles Price, The great white walls are built: restrictive immigration to North America and Australia, 1836–1888, Canberra: Australian Institute of International Affairs and Australian National University Press, 1974, pp. 66–8; Arnold J. Meagher, The introduction of Chinese laborers to Latin America: the ‘coolie trade’, 1847–1874, PhD thesis, University of California at Davis, 1975, pp. 105A, 108A (now published by Xlibris Books, 2008); David Northrup, Indentured labor in the age of imperialism, 1834–1922, Cambridge: Cambridge University Press, 1995; and Wang Sing-wu, The organization of Chinese emigration, 1848–1888: with special reference to Chinese emigration to Australia, San Francisco, CA: Chinese Materials Center, 1978.
The greatest gap in the data is for emigration from Xiamen and Shantou to Southeast Asia before the 1870s. Immigration numbers for Singapore from 1845 to 1853 (averaging 9,885 immigrants a year) are in Thomas Braddell, ‘Notes on the Chinese in the Straits’, Journal of the Indian Archipelago and Eastern Asia, 9, 1855, pp. 109–24; and the Singapore Colonial report of 1876 also has numbers for 1871–75 (averaging 22,765 migrants a year, but increasing from 14,000 to 37,000). Otherwise, I have made estimates based on population statistics and anecdotal reports found in G. William Skinner, Chinese society in Thailand: an analytical history, Ithaca, NY: Cornell University Press, 1957, pp. 58–9; Meagher, ‘Introduction’, pp. 143–5; and Lee Poh Ping, Chinese society in nineteenth century Singapore, Singapore: Oxford University Press, 1978, p. 86. It is unlikely that the total number of migrants to Southeast Asia in this period amounts to more than a million, or about 5% of the total emigration detailed in Table 1. The trend-line for total migration before the 1870s in Figure 1 must be taken with a pinch of salt.
All of the Chinese data for Tables 2 and 3 and Figures 3 to 12 rely on the Hong Kong Harbourmaster, Chinese Customs, and Singapore immigration reports, with the exception of Bangkok return data in Figure 6, which relies on Skinner, Chinese society, pp. 61 and 173. The correlation between the emigration statistics and Singapore immigration statistics are extremely high. From 1881 to 1928 the total number of immigrants counted in Singapore amounts to 103% of emigrants counted at the ports of departure. Only 1887 and 1927 diverged by more than 10%, with three-quarters of the years varying by 5% or less. This is about as good as it gets for migration statistics. Figures for other destination ports, however, show greater discrepancies with the emigration numbers. Thus, in the creation of Table 1 and Figure 1, I made the following estimates and adjustments.
Numbers for French Indochina are the most troubling. The French did not count immigrants at the ports. The leaders of the Chinese congrégations were expected to register them upon arrival, and these were counted as immigration statistics. Numbers of immigrants for Cochinchina (south Vietnam) for 1879–83 (averaging 11,440 a year) and for Hanoi for 1920–24 are in Imre Ferenczi and Walter Willcox, International migrations, vol. 1, Statistics, New York: National Bureau of Economic Research, 1931, pp. 154 and 920. Numbers for all of French Indochina for 1923–40 are in Annuaire statistique de l’Indochine, Hanoi, averaging over 40,000 a year. The total immigration statistics for these scattered years amount to 1.15 million immigrants, which is substantially more than the total of 293,266 emigrants counted in Chinese port statistics. Charles Robequain, The economic development of French Indo-China, trans. Isabel Ward, London: Oxford University Press, 1944, writes that ‘The rich and well-to-do Chinese travel on big liners like Europeans; but most of the immigrants are crammed together in picturesque, ill-smelling groups on the decks of small boats.’ Can we assume that many of the migrants who travelled by small boat may have left from smaller ports or were otherwise not counted in emigration statistics? I think we must. Projecting from existing data, population estimates, and anecdotal evidence that migration rates decreased temporarily after the imposition of immigration restrictions in 1906 (see Wang Wen-Yuan, Les relations entre l’Indochine Française et la Chine, Paris: Éditions Pierre Bossuet, 1937, pp. 16–17), I estimate that at least 3 million emigrants travelled to French Indochina. The estimates used for the chart in Figure 1, however, are based on a very conservative estimate of fewer than 2 million.
The emigration numbers to Thailand from 1881 to 1940 are only 71% of those in Skinner’s Chinese society, pp. 61 and 173, a difference of 850,000 migrants. Skinner says that his numbers are based on Thai customs reports and Hong Kong and Chinese emigration reports from 1882 to 1940, but he does not explain how he calculated them. He may have also counted overland journeys from Malaysia and French Indochina into Thailand. According to the Straits Settlements reports, 374,380 Chinese made the trip to Thailand between 1931 and 1939. Most of these overland movements were probably short back-and-forth journeys, or else were already counted in Singapore immigration statistics. But it is unlikely that Skinner counted overland migration, given that he does not mention it and only counts 423,000 immigrants in the 1930s (which would leave an improbably low 49,000 Chinese coming directly from China over that decade).
I have chosen to accept Skinner’s numbers for Figures 1 and 6 for three reasons: first, the greater likelihood of undercounting rather than overcounting in the historical records, as made clear in the French Indochina case; second, as a compensation for the undercounting of migrants to French Indochina, one that gives a better sense of year-to-year changes; and third, because the number of Chinese in Thailand in the 1950s seems to correlate better with a higher number of immigrants. In the early 1950s, 3.6 million Chinese lived in Thailand, 3.3 million in Singapore and Malaysia, 2 million in Indonesia, 1.2 million in Vietnam and Cambodia, and 0.15 million in the Philippines (see Dudley Poston, Jr. and Mei-YuYu, ‘The distribution of the overseas Chinese in the contemporary world’, International Migration Review, 24, 3, 1990, p. 496). The relative proportions of these numbers correspond fairly well to the relative numbers of immigrants counted in Table 1, with the exception of Thailand, which seems to have about twice as many Chinese in the 1950s as it should have (and the Philippines seems somewhat low, which may be due to relatively high return rates). This is especially surprising given the strong reputation for assimilation in Thailand, the relative ease with which descendants of Chinese people could identify legally and culturally as Thai, and the criticisms of the 1953 census for undercounting the Chinese. Thus, it seems best to set the estimate for migration numbers to Thailand as high as possible. This rarely adds up to more than 4% to the entire migration total for any given year in Figure 1.
Similarly, Chinese emigration statistics to Manila are 30% lower than immigration statistics in the Annual report of the Philippine Commission and the Annual report of the Bureau of Customs for Manila from 1899 to 1939, a difference of 150,000 migrants. This is especially surprising, given that the imposition of Chinese exclusion laws by the United States in this period generated an incentive to evade immigration officials when entering the islands. Again, I have chosen to use the higher numbers for Figure 1 for much the same reasons as given for Thailand (although I used only the Xiamen numbers for Figure 6, because return numbers are not available from the Philippines). Given the relatively small number of migrants spread out over forty years, the difference rarely amounts to more than 1% of total migration for any given year in Figure 1.
For the Americas, it is very difficult to make estimates for specific countries. For example, in the United States the inconsistencies and technicalities in the categorizing of migrants means that the numbers of Chinese ‘immigrants’ are 20–30% of the number of cases recorded by the Bureau of Immigration at US ports, and Hong Kong emigration statistics are somewhere in between the two. Many Chinese also left for Canada, Hawaii, or Mexico before attempting to enter the United States, whether openly or clandestinely; and many who originally shipped from Hong Kong to San Francisco moved on to final destinations in Latin America. But, whatever the final destination, it seems that any overall estimate for the Americas and Hawaii based on Hong Kong emigration numbers should be accurate for the region as a whole, if not for specific nations.
Finally, statistics for the Dutch East Indies from 1900 to 1938 in Statistisch Jaaroverzicht van Nederlandsch Indië, Batavia, and Departement van Economische Zaken, Volkstelling 1930, vol. 7, Chineezen en andere vreemde Oosterlingen in Nederlandsch-Indië, Batavia, 1935, are divided according to a variety of unclear and unexplained administrative categories. I have found it impossible to make them correspond with migration statistics from China and Singapore. The chart in Figure 1 counts only those migrants who left directly from Chinese ports to the Dutch East Indies – 430,000 from 1923 to 1939 – and assumes that all of the other migrants transshipped in Singapore and were counted in Singapore statistics. The Singapore immigration reports count 1.14 million migrants moving on to the Dutch East Indies from 1923 to 1939. The estimate for the Dutch numbers in Table 1 is based on existing numbers plus a projected estimate of transshipment from Singapore before 1923.
The high and low totals at the bottom of Table 1 do not equal the totals of highest and lowest of the single country estimates because, in calculating the final numbers, any lowering of the Straits and Malaysia estimate is compensated for by an increase in estimates for transshipment destinations. The chart in Figure 1 is based on a total estimate of 20.2 million migrants. The emigration data used for Figures 3 to 12 (that is, Hong Kong and Chinese customs data with no additions based on immigration statistics or other estimates) accounts for 16 million migrants, or 86% of the total 18.5 million migrants estimated in Figure 1 for 1875–1939.
Statistics for European migration are from Ferenczi and Willcox, International migrations, vol. 1, supplemented for the 1920s and 1930s when possible by B. R. Mitchell, ed., International historical statistics: Europe 1750–1993, 4th edition, New York: Macmillan Reference, 1998, pp. 129–40. Return migration from the United States is from Susan B. Carter, et al, eds., Historical statistics of the United States, vol.1, Cambridge: Cambridge University Press, 2006, pp. 547–8. The proportions of female migrants to the United States were provided to me by José C. Moya. Indian numbers are from Kingsley Davis, The population of India and Pakistan, New York: Russell and Russell, 1951, pp. 99–100. Statistics for Manchurian migration and the population of Hebei and Shandong are from Thomas Gottschang and Diana Lary, Swallows and settlers: the great migration from north China to Manchuria, Ann Arbor, MI: The University of Michigan, Center for Chinese Studies, 2000. Population data for Guangdong is from Robert Marks, Tigers, rice, silk, and silt: environment and economy in late imperial south China, Cambridge: Cambridge University Press, 1998, p. 280. Population data for the rest of the world is from Angus Maddison’s spreadsheet, ‘Statistics on world population, GDP and per capita GDP, 1–2006 AD’, http://www.ggdc.net/maddison/ (consulted 1 August 2009).