Introduction
Recent scholarship has demonstrated that within-country income inequality can yield corrosive social and economic effects and can fuel ethnic violence (Bauman, Reference Bauman2011; Stewart, Reference Stewart2000; Hurrell, Reference Hurrell, Hurrell and Woods1999), destabilise migration patterns and refugee flows (Wade, Reference Wade, Seligson and Passé-Smith2003; Oman, Reference Oman, Hurrell and Woods1999) and bring about diminished returns on economic growth (Ferreira and Ravallion, Reference Ferreira and Ravallion2008). Developing states appear particularly vulnerable to such negative effects of inequality. Thus, policies aimed at reducing within-country income inequality seem critical to any international development agenda. Yet, while ‘for the past 30 years the dominant discourse in international development has been the “global politics of poverty alleviation”’(Deacon and Cohen, Reference Deacon and Cohen2011: 234), ‘inequality has remained a neglected policy issue’ (Cook and Yi, Reference Cook and Yi2011: 135). International campaigns against global poverty supported by donor governments (e.g., ‘Make Poverty History’, ‘ONE campaign’, ‘Stand Against Poverty’) have given little attention to inequality, neither as a dimension of poverty nor as an exacerbating exogenous force, and the Millennium Development Goals (MDGs) – ‘the fulcrum on which development policy is based’ (UN, 2005: 2) – show a similar bias. Topping this ‘global wish list’ (Saith, Reference Saith2006: 1172) set forth in the MDGs is Target 1.A, which aims at halving the number of global citizens living under the $1 per day poverty line (UN, 2000). While the other seven MDGs focus on a range of issues including gender equality, child mortality, education, and environmental sustainability, the challenges associated with unequal within-country income distributions are left unmentioned (Fukuda-Parr, Reference Fukuda-Parr2010). Rather unsurprising, then, ‘discussions of [inequalities] in international organizations and policy recommendations or conditions attached to international aid have conspicuously failed to provide solutions’ (McBride, Reference McBride2011: 134).
In the following, we explore the extent to which this underexposure of inequality in the MDGs is a reflection of international aid agencies’ discourses, both before and after the MDGs’ adoption in 2000. We first synthesise the literature on inequality and its political economy and their uptake by global development policy during the past three decades. We then explain why language constitutes an important variable in the study of policy-making. In the empirical sections of this article, we build on Prior et al.'s (Reference Prior, Hughes and Peckham2012) method of using algorithms and visualisation in textual analysis. Combining frequency analysis and comparisons of textual similarity with regard to the contexts in which the documents evoke poverty and inequality allows us to compare and depict discursive emergence and dynamics over time. Our sample comprises all World Development Reports (WDRs) published between 1978 and 2010 (n = 31), all Human Development Reports (HDRs) published between 1990 and 2010 (n = 19) and eighteen white papers from selected bilateral institutions. We provide an in-depth introduction to our method, describe our findings and conclude with suggestions for international social policy-making and further research.
Why do inequalities matter?
The literature on national inequality and social and economic development varies widely in its interpretation of causal or correlative relationships between inequality and other phenomena. Early contributors viewed inequality as a necessary step in the process of economic development. In their article on functional stratification, Davis and Moore (Reference Davis and Moore1945) wrote that differences in compensation and status accorded to certain valued positions in society ensure that only the most capable individuals fill those positions; a degree of inequality thus fuels meritocracy. Kuznets's (Reference Kuznets1955) ‘inverted-U’ model of inequality and economic developmentFootnote 2 predicted that inequality necessarily increases as countries begin to industrialise, followed by a period of stabilisation, and finally decreases as countries reach later stages of development. Hirschman and Rothschild (Reference Hirschman and Rothschild1973) argued that relative inequality catalyses an environment of economic optimism in which the gains of some individuals provide hope to others that their fortunes might soon change as well. Referring to the initial stages of Kuznets's inverted-U model, Perotti (Reference Perotti1993) argues that in very poor countries with limited resources, a high degree of inequality may be the only context that yields economic growth, as unequal concentration of these resources among the upper class at least allows some development of human capital.
On the other hand, deleterious effects of inequality on economic growth, social stability and institutional performance are equally well documented, especially in recent research. Such studies have found a strong negative association between inequality and growth, theorising that in a democratic polity, higher inequality will lead voters to support redistributive tax policies, which in turn inhibit economic growth (Alesina and Rodrik, Reference Alesina and Rodrik1994; Persson and Tabellini, Reference Persson and Tabellini1994). Chong and Gradstein (Reference Chong and Gradstein2004) point to a correlation between high domestic inequality and poor quality of institutions in developing countries. Ferreira and Ravallion (Reference Ferreira and Ravallion2008) argue that higher levels of domestic inequality reduce the effect of economic growth on poverty reduction in a given country. Echeverri-Gent (Reference Echeverri-Gent2009) examines the relationship between economic power and political power, arguing that a high degree of domestic inequality enables elites to shape institutions and policies in ways that maintain their influence, resulting in poor or non-existent provision of public goods. Writing on the relative import of poverty and inequality vis-à-vis social problems, Pickett and Wilkinson, in The Spirit Level (Reference Pickett and Wilkinson2009), create an index of health and social problems and then compare national income levels and levels of income inequality in twenty rich countries. Through regression analysis, Pickett and Wilkinson find a weak correlation between national income and health and social problems, but find that, as income inequality widens, health and social problems worsen (Pickett and Wilkinson, Reference Pickett and Wilkinson2009).
Both scholars and policy makers at global development agencies recognised several decades ago the need to address not only poverty but also inequality. ‘In the 1960s and early 1970s’, McNeill (Reference McNeill2011: 149) explains, ‘the development literature was replete with radical critiques of political and social relations both within and between countries.’ Writing in 1980, Gary S. Fields (Reference Fields1980: 8), an economist at Cornell University and adviser to several international organisations, described international development discourse at the time as a nexus between poverty and inequality:
Academicians, aid agencies, and policy makers in less-developed countries (LDCs) alike have become aware of the severity of poverty and inequality and are now trying to deal with them. The international development community has awakened to the income-distribution problem with calls for Redistribution with Growth (World Bank), Meeting Basic Needs (United Nations International Labour Office), and New Directions in Development Assistance (United States Agency for International Development).
Indeed, Redistribution with Growth (Chenery et al., Reference Chenery, Ahluwalia, Bell, Dulloy and Jolly1974),Footnote 3 whose principal author was the World Bank's Vice President for Development Policy at the time, urged aid agencies to move beyond the conceptual dissociation in traditional economics of optimum growth and distribution policies and put distributional issues at the forefront of development debate, if not actual policy. Echoing this sentiment nearly twenty-five years later, a paper presented by then-Chief Economist at the World Bank Francois Bourguignon (Reference Bourguignon2004: 2) argued that ‘the real challenge to establishing a development strategy for reducing poverty lies in the interactions between distribution and growth, and not in the relationship between poverty and growth on the one hand and poverty and inequality on the other’. Bourguignon's rationale apparently seeped into the World Bank's 2006 WDR, Equity and Development (World Bank, 2006; see also McNeill, Reference McNeill2011), which posited that political and economic inequalities led to unequal opportunities among groups, waste of productive potential, inefficient allocation of resources and poor institutional development, not to mention a violated sense of fairness – all of which undermine the poverty reduction agenda.
Language as a frame for policy formulation
Newman and Vidler (Reference Newman and Vidler2006: 195) argue that policies constitute a ‘linguistic repertoire on which managers, professionals, user groups and other stakeholders can draw’, connecting the language of policy with implementation. Policies thus reflect the ‘strategic packaging’ (Joachim, Reference Joachim2007: 16–17) of problems and solutions as ‘the result of social constructions and collective attributions [and] efforts by groups of people to fashion shared understandings of the world and of themselves that legitimate and motivate collective action’ (ibid.). Read this way, documents such as the WDRs, HDRs and white papers exist as nodes in a normative framework ensuring inter-organisational cooperation among a myriad of stakeholders (Brett, Reference Brett, Robinson, Hewitt and Harriss1999) or, in Schmidt's (Reference Schmidt2008: 310) words, as a ‘coordinative discourse among policy actors’. Indeed, if discourse ‘encompasses not only the substantive content of ideas but also the interactive process by which ideas are conveyed’ (Schmidt, Reference Schmidt2008: 305), then we should expect international development discourses to have discernible effects on implementation, as ‘discourses determine what is considered acceptable and appropriate within a particular institution’ (Joachim, Reference Joachim2007: 25; Gardner and Lewis, Reference Gardner and Lewis2000; Motion and Leitch, Reference Motion and Leitch2009; St Clair, Reference St Clair2006). Since little communicative discourse occurs between ‘formulators’ and ‘recipients’ of resulting policies, discourses between policy actors – not between policy actors and those affected by those policies – are the main ‘producers’ of development policies.
It then seems warranted to argue that the framing of development challenges in official policy documents effectively tethers implementing organisations to certain strategies, which in turn overshadow other discourses and strategies (Deacon, Reference Deacon, Hurrell and Woods1999). To illustrate, the MDG framework owes so much to the idea of the ‘poverty trap’ that the latter can explain the predominance of income poverty metrics in development policies more broadly. Sachs and Warner (Reference Sachs and Warner1997: 185) describe this trap as a cycle in which one ‘low-human-capital generation is succeeded by another low-human-capital generation’. Sachs (Reference Sachs2005) elaborates on this notion as one in which the poor use all of their income for day-to-day survival, abrogating all possibility of saving or investing for the future; large infusions of foreign aid are thus necessary to break this bottleneck in developing countries. Sachs's role as Director of the Millennium Project means that these ‘practical’ and targeted solutions to the perceived problem of the poverty trap dominate the MDG framework, potentially also explaining the absence of income inequality and redistribution issues. After all, ‘the goal’, according to Sachs (Reference Sachs2005: 289), ‘is to end extreme poverty, not to end all poverty, and still less to equalise world incomes or to close the gap between the rich and the poor’ (emphasis in the original). Thus, if a given implementing agency looks to the MDGs as a blueprint for development, its actions will be a direct application of the ideational content arising from dominant policy discourses (Joachim, Reference Joachim2007: 16). However, as we have outlined in the introduction, the MDGs are not the sole proxy for international development thinking writ large; rather, they provide a mere snapshot of development policy priorities in the year 2000. ‘[I]t is in language that policy is made’, Prior et al. (Reference Prior, Hughes and Peckham2012: 2) remind us, and since discourses are never static (Schmidt, Reference Schmidt2008: 322), it is essential to examine the discursive ebbs and flows of key concepts like poverty and inequality over time in order to gauge their impact on policy language and implementation.
Method
Official reports and white papers provide a rich repository of data that can be analysed to trace international attention paid to key terms such as poverty and inequality. Such sources obviously ‘constitute only one genre of discourse’ (Prior et al., Reference Prior, Hughes and Peckham2012: 15), but the intention with which they are produced, namely ‘to promote and support favoured narratives rather than to open a space for public discussion’ (ibid.) is precisely why such texts are ideal units of analysis if the objective is to measure the prominence and usage of specific concepts among policy-makers authoring these documents. While we do not claim that our sample is in any way exhaustive, we believe that it is large enough to highlight trends as well as differences in multilateral and bilateral agencies’ usage of these concepts. Our results, which we discuss below, appear to confirm this position.
Early WDRs and HDRs typically have between 7,000 and 11,000 words, whereas more recent reports contain between 9,000 and 25,000 words. The length of donors’ white papers vary more substantially; some only have 2,500 words, whereas the length of others, especially those by the Department for International Development (DFID), rival early WDRs in terms of their length. In total, our frequency analysis covered textual data in excess of 500,000 words from a total of sixty-eight documents, demonstrating why the use of algorithms is both promising and necessary for the analysis of large amounts of such data.
Like Prior et al. (Reference Prior, Hughes and Peckham2012), we use co-occurrence algorithms provided by textual analysis software to determine the frequency with which concepts appear in each report, as well as the strength of co-occurrence across reports over time. Prior et al. argue that automated text mining techniques help eliminate subjectivity in concept selection (cf. Borins, Reference Borins2011: 166) in their study of a specific policy discourse at one point in time. Conversely, we pre-select ‘poverty’ and ‘inequality’ (and various signifiers of these concepts) since our aim is to examine discursive dynamics.
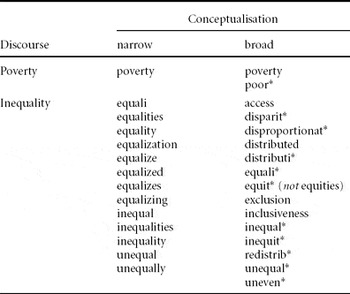
To capture variation in use of language related to poverty (pov) and inequality (ineq), we developed narrow (povn; ineqn) and broad (povb; ineqb) conceptualisations of each of the two concepts under investigation. As Table 1 shows, our narrow conceptualisation of poverty includes only one search term, namely the word ‘poverty’. In its broader form, ‘poverty’ is complemented by ‘poor’, ‘poorer’ and ‘poorest’. In comparison, the narrow conceptualisation of inequality comprises thirteen search terms, whereas the broader approach includes eleven additional sub-concepts (for example, ‘access’, ‘disparities’, ‘equity’, and ‘exclusion’, inter alia) and their variations.
Narrow and broad conceptualisations of pov, ineq

Note: *An asterisk indicates that all meaningful permutations of the word stem were included.
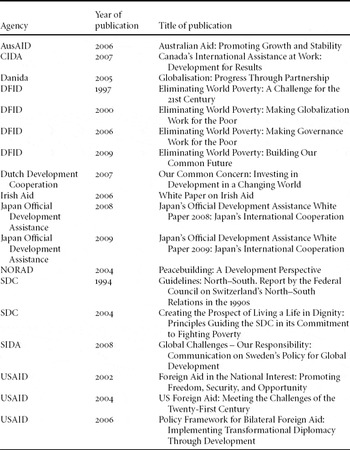
Using version 9 of QSR's NVivo software application, we ran word frequency analyses in each of the three document categories included in our sample. Complete lists of all WDRs and HDRs analysed in this paper can be found on the World Bank and UNDP websites.Footnote 4Table 2 lists bilateral agencies’ white papers included as a third category of texts, based on a blinded review of executive summaries in order to determine their relevance to the study. Since this third category does not permit longitudinal comparison given that authoring agencies vary, we calculated a frequency ratio for each white paper as a proxy for the relative prominence of pov and ineq in them, using the following formula:
 \begin{equation}
{\rm relative}\,{\rm dominance}\,{\rm of}\,pov_b \,{\rm or}\,ineq_b = \frac{{pov_b }}{{(pov_b + ineq_b )}}\end{equation}
Selected white papers*

Note: *Retrieved from agencies’ websites.
This formula has a theoretical range of 0 to 1 (assuming povb + ineqb > 0). Values below 0.5 indicate a dominance of ineqb; values above 0.5 indicate a dominance of povb. We chose to report the ratios between povb and ineqb rather than povn and ineqn since a comparison of frequency ratios in the WDRs and HDRs (calculated as well but not reported here) showed that using the broader conceptualisation made ineq appear to be 2.2 and 1.6 times more prominent in each of these two document categories, on average, as compared to the ratios calculated based on our narrow conceptualisations. In other words, our broader conceptualisations increased the frequency of ineq 1.6 to 2.2 times more than the frequency of pov. This is hardly surprising given that povb increases the number of words to be included in the search from one (‘poverty’) to four (‘poverty’ as well as ‘poor’, ‘poorer’ and ‘poorest’), whereas ineqb adds entirely new concepts such as ‘access’, ‘disparity’, ‘distribution’, ‘equity’, ‘inclusion’ and ‘exclusion’, as well as all meaningful variations of their word stems. Reporting ratios for the white papers calculated based on the broader conceptualisation thus reflects our desire to capture as much ineq in the white papers as our analytic framework permits.
The second step in our analysis consisted of a longitudinal comparison of the degree of similarity of different documents in the same document category. Using an algorithm and visualisation techniques offered in NVivo, we calculated textual similarities, or co-associations, within our three categories – WDRs, HDRs and white papers – based on each of the four conceptualisations (povn; ineqn; povb; ineqb). In order to measure co-association solely in terms of the concept of interest (povn; ineqn; povb; ineqb; povn and ineqn; povb and ineqb), we defined all other words included in our source documents as so-called ‘stop words’ (QSR, n.d.), with the effect that similarity between documents was reported based only on the position of our search terms (e.g., ‘poverty’) within the text. To illustrate, two documents in which ‘poverty’ is mentioned frequently in the same sentences as, for instance, ‘violence’ and ‘politics’ would likely be reported as similar (or co-associated). Conversely, documents in which ‘poverty’, ‘violence’ and ‘politics’ appear frequently, but on different pages, would be reported as dissimilar. Using Pearson's correlation coefficient r, we then ran similarity calculations at nine different levels of correlative strength, with r ≤ 0.1 being the most weakly correlated to r ≤ 0.9 being the most strongly correlated. We call these nine different levels of r the ‘sensitivity levels’ of our analysis and expect co-associations between two documents in the same category to be highest at r ≤ 0.1 and lowest at r ≤ 0.9. Put another way, lower sensitivity levels (those approaching r ≤ 0.1) cast a wider net, leading to more, but weaker, co-associations, while higher sensitivity levels (those approaching r ≤ 0.9) zero in on fewer, but stronger co-associations. This technique allows us to determine which reports and white papers use each of the four concepts as well as their combinations in most similar ways, thus demonstrating which reports and papers have, over time, framed a dominant discourse on poverty and inequality.
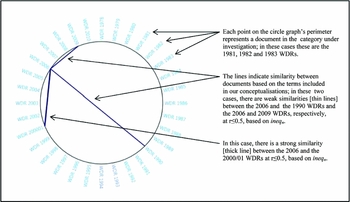
Results are visualised in ‘circle graphs’ (see Figure 1). A circle graph is ‘[a] circle where all the items are represented as points on the perimeter’ (ibid.). Each of our circle graphs thus contains all documents included in the category in question. Given that our sample includes three document categories, we work with three different circle graphs (see the following section for examples). ‘Similarity between [source documents] is indicated by connecting lines of varying thickness . . .’ (ibid.); the thicker a line between two documents, the more similar (i.e., co-associated) these are at a given level of r with regard to the conceptualisation (e.g., povn) measured. Comparing circle graphs at different levels of r (sensitivity levels) helps us differentiate further between weaker and stronger co-associations between documents in one category.
Example of NVivo-generated circle graph: ineqn at r ≤ 0.5 in WDRs, 1978–2010

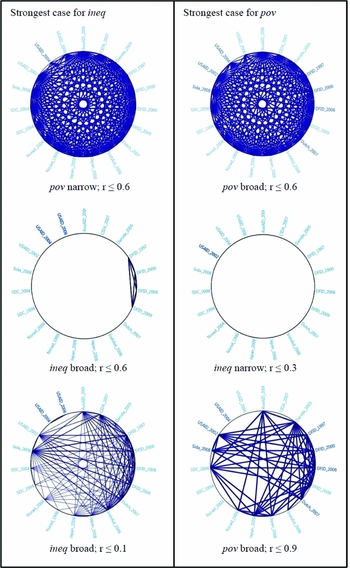
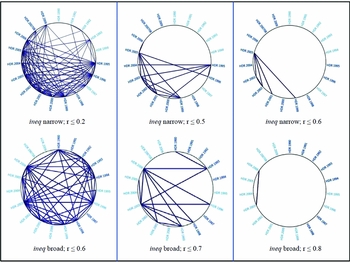
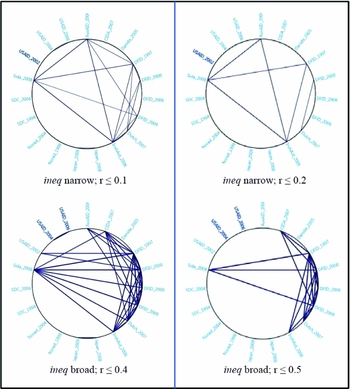
We structure the presentation of results from our comparison of similarity as follows. First, building on our first analytical step, i.e. the frequency analysis (see Figures 2 and 3), we now compare the strongest case for the claim that ‘ineq has dominated the emerging discourse in this category (as opposed to pov)’ with the opposite claim that ‘pov has dominated the emerging discourse in this category (as opposed to ineq)’ (see Figures 4 through 6). To do so, we first compare the pattern of similarities using povn with the pattern of similarities using ineqb at the same level of sensitivity; this comparison depicts the strongest case for a discourse dominated by ineq in this category. Conversely, a comparison of povb with ineqn at the same sensitivity level then renders the strongest case for an pov-dominated discourse in this category. Depending on intensity of patterns observed, we conduct this comparison at either two or three levels of sensitivity. For the white papers, we add a third circle graph to each pairing in order to illustrate similarity patterns at much lower sensitivity levels since the pairings at identical sensitivity levels render little insight, which is not surprising since the eighteen documents included in this category were published by eleven different bilateral agencies.
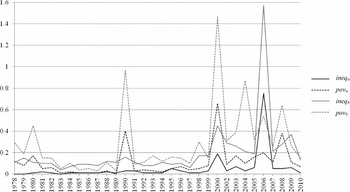
Comparison of frequencies of ineqn, povn, ineqb and povb as a percentage of total words in WDRs, 1978–2010

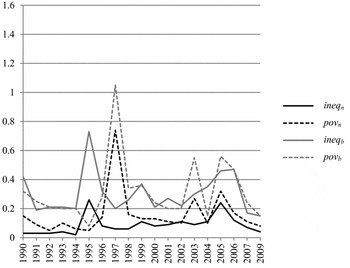
Comparison of frequencies of ineqn, povn, ineqb and povb as a percentage of total words in HDRs,1990–2009

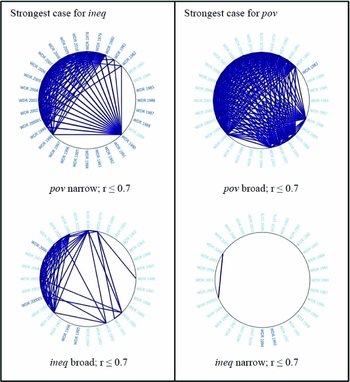
WDR: comparison of povn and ineqb versus povb and ineqn

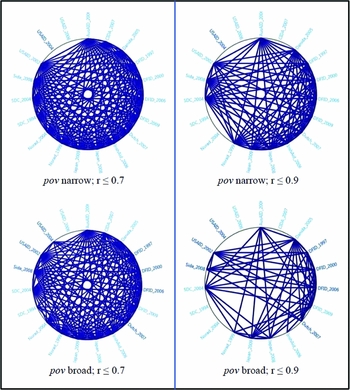
Second, we compare patterns of similarity based on povn with patterns based on povb at different sensitivity levels, followed by patterns based on ineqn with patterns based on ineqb, in each of our three categories. These comparisons – reported at either two or three sensitivity levels depending on the intensity of patterns observed – allow us to gauge the extent to which variation in conceptualising each of the two concepts changes the pattern of similarities between documents in each category (see Figures 7 through 12).
Results
Our longitudinal comparison of frequency counts of povn, ineqn, povb and ineqb, respectively, in WDRs from 1978 until 2010 (see Figure 2) shows that both povb and povn spiked with the 1990 WDR that defined the $1/day poverty line, and again a decade later when the World Bank chose Attacking Poverty as the theme of its annual report. Conversely, both ineqb and ineqn were evoked considerably less until the recent past. Ineq was slightly more prominent in the 1990 and 2000 WDRs, suggesting that frequent mentions of pov also spur mentions of ineq. The first time that ineq dominated pov in both conceptualisations was in the 1989 WDR on Financial Systems and Development, albeit at very low frequencies. Conversely, the 2006 WDR on Equity and Development constituted a real trend reversal. Here, ineqb was three times as prominent as povb and ineqn was almost four times as prominent as povn. Although the subsequent WDR in 2007 returned to the dominant pattern observed prior to Equity and Development, ineqb was again more prominent than povb in the 2009 WDR on Reshaping Economic Geography. As in earlier WDRs published between 1985 until 1989 and again in 1991, however, povn (i.e., solely the word ‘poverty’) in the 2009 WDR outnumbered all terms included in our narrow conceptualisation of ineq.
The longitudinal analysis of frequency counts of povn, ineqn, povb and ineqb in HDRs published between 1990 and 2009 (see Figure 3) generates a similar picture compared to the case of WDRs, although the temporal pattern is distinct. Here, too, one report stands as leading to a clear – although less dramatic as in Equity and Development – domination of ineq over pov: the 1995 HDR, which focussed on gender and development. Notions of gendered dimensions of inequality thus emerge as a major building block of the discourse on equalities writ large. Despite this specific approach to broaching inequality, it is equally noteworthy that the first UNDP report to do so predated the first WDR with a clear focus on equality by more than a decade. Since then, only the 2002 and 2004 HDRs contained language balancing ineq and pov. In several other HDRs, including those published in 1990, 1993, 1999, 2001 and 2004, ineqb trumped povb, but always by a very small margin. Conversely, the 1997 HDR, which introduced the human poverty index, mirrored the 1990 and 2000 WDRs in terms of the dominance of pov over ineq.
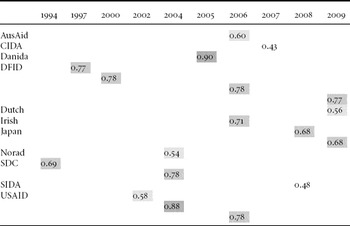
In the third category analysed, bilateral donors’ white papers since 1994 are characterised by moderate to considerable dominance of povb over ineqb (see Table 3). Recent papers by the Canadian International Development Agency (CIDA, 2007) and the Swedish International Development Agency (SIDA, 2008) are the only two notable exceptions. Povb and ineqb appear balanced in the papers by the Norwegian (Norad) and Dutch agencies. The 2005 paper by the Danish agency (Danida) is most skewed toward povb. Notably, whereas all four DFID white papers published between 1994 and 2009 are moderately dominated by povb – a pattern also visible in the cases of the Japanese (JICA) and Swiss agencies (SDC) –, povb and ineqb across the three papers by the United States Agency for International Development (USAID) vary substantially between a near-balance in the 2002 paper (see Table 2 for themes) and a clear dominance of povb over ineqb in two subsequent papers.
Relative dominance* of povb or ineqb in 18 white papers, 1994–2009

Note: *Values between 0 and 0.49 indicate a dominance of ineqb; values between 0.51 and 1.00 indicate a dominance of povb. The closer the value is to the extremes of 0 or 1.00, the stronger the relative dominance of either povb or ineqb.
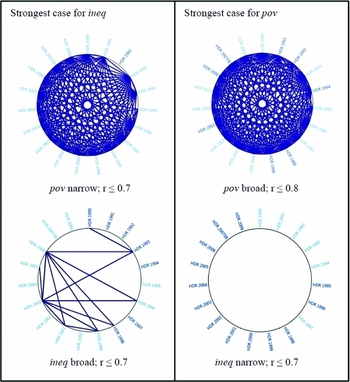
Our comparison of best cases for ineq and pov, respectively, supports the findings from our frequency analysis. This becomes easily visible in the WDRs (see Figure 4). In the strongest case for an ineq-dominated discourse, we see how at the same sensitivity level (r ≤ 0.7) similarities between reports when measured based on ineqb cluster among WDRs published during the last decade. When based on ineqn, the only similarity at r ≤ 0.7 that can be detected links the 2000 WDR on Attacking Poverty and Equity and Development from 2006. This suggests that these two WDRs in particular frame ineq as part of pov, the aforementioned hypothesis which we will investigate further below. We note that conceptualisation seems to play a relatively more decisive role in the HDRs than in the WDRs. Figure 5 illustrates this argument from a different vantage point. The strongest case for an ineq-dominated discourse shows connections that are scattered across the category; in the strongest case for pov, the algorithm detected no similarities between any of the HDRs at r ≤ 0.7. Conversely, all but one HDR (the 1992 report) are similar in terms of the contexts in which both povn and povb appear in them.
HDR: comparison of povn and ineqb versus povb* and ineqn
Note: *We report r ≤ 0.8 rather than r ≤ 0.7 since the pattern remained the same at the higher sensitivity level.

Figure 6 depicts semantic similarities between the eighteen different white papers included in our third category. It shows that whereas all of these papers use pov in similar contexts, similarities in the usage of ineqb only connect four documents in the category; these are the four papers by DFID. When using ineqn as the basis for detecting similarities, these connections already disappear at r ≤ 0.3. The two circle charts at the bottom of Figure 6 show that patterns of similarity with respect to ineqb beyond the four papers by DFID can only be detected at a low-level sensitivity. Still, these connections – which again exclude the 2004 and 2006 USAID papers – are weaker than those forged by povb at r ≤ 0.9.
White papers: comparison of povn and ineqb versus povb and ineqn

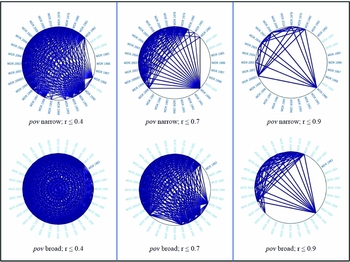
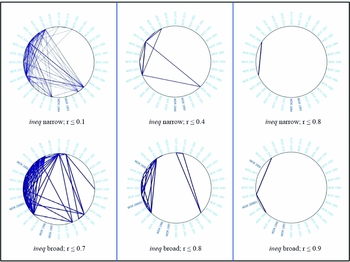
Figure 7 illustrates the effect of varying sensitivity levels in the analysis of semantic similarities among the WDRs. Compared at three different levels (r ≤ 0.4, 0.7 and 0.9), the patterns shaped by povn and povb are highly analogous; however, increasing the level of sensitivity again demonstrates the function of the 1990 WDR as a lynch pin for the World Bank's pov. Given the larger number of search terms included in ineqn and ineqb, the picture in Figure 8 is necessarily more varied, but suggests that in the WDRs, notions of ineq may, in fact, be subsumed in pov. Both circle charts in the left column suggest that this is indeed the case. The circle graph depicting ineqn at r ≤ 0.4 even shows similarities not only between the 2000 and 2006 WDRs, as already observed above, but also between these two and the two WDRs characterised by spikes in ineqb (2009) and povb (1990), respectively. At the highest level of sensitivity, however – depicted in the right column of Figure 8 – this effect disintegrates: whereas ineqn still connects the 2000 and 2006 WDRs, ineqb shapes a completely different pattern. When applying this broader conceptualisation of ineq, the WDRs from 1998 (Knowledge for Development), 2002 (Building Institutions for Markets) and 2008 (Agriculture for Development) use this conceptualisation similarly. Thus, while the narrow conceptualisation of inequality appears to have been integrated into the Bank's poverty discourse, critical dimensions of inequality only captured in our broader conceptualisation still co-exist independently from the Bank's poverty discourse. This is particularly noteworthy as these dimensions might potentially forge an alternative, broader ineq provided that future reports adopt language on inequality as it appeared in the 1998, 2002 and 2008 WDRs.
WDR: comparison of conceptualisations: povn and povb

WDR: comparison of conceptualisations: ineqn and ineqb

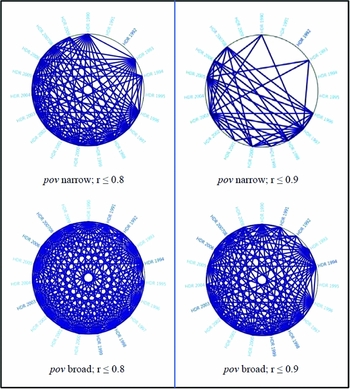
Figure 9 shows how HDRs since the mid-1990s have converged on a consistent pov, which – unlike the discourse framed by recent WDRs – does not subsume notions of inequality as well. The 1995 HDR on gender equality is a case in point; excluded from the general pattern in both povn at r ≤ 0.8 (and therefore also at r ≤ 0.9) and povb at r ≤ 0.9, its focus on inequality as it results from gender dynamics renders it the strongest outlier in this category. Focussing on the HDRs’ framing of ineq (see Figure 10) illustrates that our two alternative conceptualisations of ineq result in different patterns of similarity between documents in this category. Whereas ineqn at a medium level of sensitivity (r ≤ 0.5) suggests, on the one hand, semantic similarities between the 1995 HDR and its successors published in 2000, 2002, 2003 and 2004 and, on the other hand, similarities between the 2005 HDR and the reports from 1996, 1999, 2001, 2003 and 2004, measurement on the basis of ineqb renders stronger similarities between the 2006 HDR (Beyond Scarcity: Power, Poverty and the Global Water Crisis) and earlier reports published in 1993, 1996, 1998, 1999, 2001 and 2003. Corresponding variation is visible at the highest levels of measurement sensitivity in this comparison. Whereas ineqn still connects the 2005 HDR with its predecessors from 1999, 2001, 2002 and 2003 at r ≤ 0.6, the only similarity for ineqb at r ≤ 0.8 exists between the 2003 and 2006 HDRs. Unlike ineq in the WDRs, in which ineqn has been included in a broader pov while ineqb has remained separate, the main distinction in the case of the HDRs is between a homogenous pov on one side and a highly varied ineq on the other.
HDR: comparison of conceptualisations: povn and povb

HDR: comparison of conceptualisations: ineqn and ineqb

Our final sensitivity analysis, which focuses on the eighteen white papers’ use of pov and ineq, demonstrates that measuring semantic similarity at different levels of sensitivity adds important facets (see Figures 11 and 12). While Figure 11 merely confirms our observations from Figure 6 in greater detail, Figure 12 establishes the 2008 SIDA paper and the 2006 Irish Aid paper as additional nodes of ineq among bilateral donor agencies. Albeit at relatively low sensitivity levels, these two papers are similar to at least two of the aforementioned papers by DFID, as well as to the 2007 paper by the Australian Government (AusAID). DFID, SIDA, CIDA, AusAID and Irish Aid thus emerge as those bilateral agencies whose discourse on inequality share at least some semantic features.
White papers: comparison of conceptualisations: povn and povb

White papers: comparison of conceptualisations: ineqn and ineqb

Discussion
Four observations described in the previous section stand out and require further discussion. These are, first, the overall dominance of pov over ineq in all three categories; second, the timing of frequency in the WDRs and HDRs; third, the difference in the usage of ineqn and ineqb in the WDRs as opposed to the HDRs; and, fourth, the patterns of semantic similarity observed between documents included in our sample of bilateral donor agencies’ white papers.
To those already familiar with the course of development policies during the past three decades, the overall dominance of references to poverty over mentions of inequalities is hardly surprising; however, we believe that the agency-specific patterns revealed by our analysis add an important degree of nuance. In particular, they seem to point to distinct agency-level approaches to discursively including or excluding the politically contentious challenge of inequality. Schmidt (Reference Schmidt2008: 307) reminds us that for issues to eventually trigger policy-level responses, they must have ‘administrative and political viability’. The agenda of absolute poverty reduction embraced by the MDGs, with its clear-cut income indicators for poverty reduction and seemingly ‘practical’ approach to solutions such as ‘roads, power, transport, soils, water and sanitation, disease control’ (Sachs, Reference Sachs2005: 289) speaks to relative administrative feasibility. Contrasted with addressing distributional issues, a focus on poverty also appears politically more feasible since inequalities stem from ‘structural relationships that are singularly skewed in favour of the rich’ (Bracking, Reference Bracking2009: 32; cf. Maxwell, Reference Maxwell1999). Changing these ‘structural relationships’ is politically risky, and politicians have limited incentives to address inequalities through unpopular measures (Milanovic, Reference Milanovic2011: 160–1). Indeed, Milanovic (Reference Milanovic2011: 84–5) warns that ‘inequality studies are not particularly appreciated by the rich’ and reminds us that ‘the World Bank refused to call [the 2006 WDR] a report on inequality: it was, more tamely, called a report on “equity” instead’.
As noted above, the UNDP's 1995 HDR on gendered dimensions of inequality preceded the World Bank's (2006) Equity and Development by over a decade. In an essay on the 1995 HDR's political significance, Seguino (Reference Seguino2006: 5) correctly characterised it as ‘one of the first to shift emphasis from consumption and income measures of gender gaps in well-being to an expanded list of capabilities and empowerment measures’. However, our analysis shows that this foray into dimensions of inequality beyond incomes did not get much traction in subsequent HDRs. While this may seem surprising, it appears likely that two developments taking place soon after the publication of the 1995 HDR played a role in its limited discursive impact. First, UNDP's own decision to focus on multiple dimensions of poverty in its 1997 report may have inadvertently narrowed the discursive space for inequality, especially given the heterogeneous conceptualisations prevalent in the HDR that became apparent through our analysis. By failing to frame a coherent position on inequality as a precondition for launching a debate on adequate measures to address it, UNDP missed an opportunity in the mid-1990s to catalyse political action in this area. Second, the Millennium Declaration in 2000 was, as all political institutions, a path-dependent expression of power (Moe, Reference Moe2005); its near-exclusion of inequality reflects the dominant interests of the Declaration's 189 signatories. As several of the visual comparisons in the previous sections demonstrate (e.g., Figures 4 and 7), the MDGs have succeeded in forging a unified discourse on poverty since 2000. Our findings echo and add nuance to McNeill's (Reference McNeill2011) contravention of the common assumption held in progressive circles that UNDP – rather than the World Bank – is the agency relatively better suited to carrying out independent, critical political and social analysis. In fact, McNeill writes that not only has the gap between HDRs and WDRs narrowed significantly in recent years, but the UNDP ‘is constrained in a different way: it needs to work closely with national governments – many of them quite resistant to both the language and practice of justice for their citizens’ (2011: 151). Whereas the World Bank's poverty discourse increasingly integrates central notions of inequality – namely those that we included in our narrow conceptualisation – as well as framing complementary dimensions of inequality in an alternative discourse, UNDP has thus far failed to effectively pursue either of these strategies, instead opting for cacophony when broaching the different facets of inequality.
In addition to uncovering such differences in strategic communication between the World Bank and UNDP, our analysis also detects substantial variation in bilateral donor agencies’ approaches to framing both poverty and inequality. Unlike the Bank and UNDP, both of which operate globally, these bilateral agencies seek to translate national perceptions of priorities into policies in selected recipient countries. In this context, Schmidt (Reference Schmidt2008: 307) has pointed to the ‘role of national values and political culture in the adoption of transnational policy ideas’ into programs and actual policies, and this phenomenon is clearly evident from our comparison of semantic patterns in the different white papers included in our investigation. McCall and Kenworthy (Reference McCall and Kenworthy2009), in their recent study of US social policy preferences, found that most Americans still object to wealth redistribution in the form of welfare programmes or direct transfers to the poor. Conversely, the relatively greater prominence of inequality across white papers authored or commissioned by agencies such as DFID, SIDA and CIDA seems to reflect, at least to some extent, societally shared values that are commonly associated with these nations (cf. Benabou and Ok, Reference Benabou and Ok2001; Osberg and Smeeding, Reference Osberg, Smeeding, Toft and Cordes2008).
Conclusion
Our findings suggest that the prompt by one of the architects of the MDGs to draw a sharp line between ‘development’ on the one hand and ‘clos[ing] the gap between the rich and the poor’ on the other (Sachs, Reference Sachs2005: 289) is slowly losing influence. In this sense, our research highlights a slight shift away from the ‘economic/technocratic approach’, which has ‘proved quite effective in “framing” debate’ among and within international organisations (McNeill, Reference McNeill2011: 150), toward a new current shaped by the moderate ascendancy of power dynamics and inequality in the global development discourse. Although political incentives ‘to pass inequality in silence’ (Milanovic, Reference Milanovic2011: 84) are unlikely to change, the more recent WDRs have moved beyond the dominant discourse of the ‘roaring nineties’ (Stiglitz, Reference Stiglitz2003) when inequality was portrayed as a motivation rather than a challenge. Although there is no doubt that the ideological battle inside the Bank continues (Broad, Reference Broad2006; Yusuf, Reference Yusuf2009), internal political dynamics during the past few years create reason for hope that the debate on inequalities’ negative effects on human development globally has entered into a new round. Recent adjustments in the calculation of the Human Development Index (HDI) made in 2010 lend additional gravitas to this diagnosis. Although the suggestion took thirteen years to gain traction (Hicks, Reference Hicks1997), the HDI now also includes measures of inequality. From the perspective of progressive social policy-makers, the facilitation of and participation in alliances between those inside the Bank who have been furthering this agenda (e.g., Bourgignon et al., Reference Bourguignon, Ferreira and Walton2007) and those representing bilateral agencies such as DFID, SIDA and CIDA are a promising strategic option. While we share the concern about globally manufactured social policies for developing countries, it strikes us that ‘the continuing global contestation between agencies’ (Deacon, Reference Deacon2011: 147) to shape such policies may be altered for the better as a result of such alliances.
Moving forward, we hope that our study will serve as a basis for qualitative studies of how discourses at the level of specific organisations have been shaping global development policy-making and programmatic planning. Beyond the context of development policy, we hope our research will spur both qualitative and quantitative discourse analyses of national social policies in the rich world as well, perhaps by examining the discourse of national agencies vis-à-vis the well-documented rise in poverty and inequality in OECD countries over the past two decades (Deacon and Cohen, Reference Deacon and Cohen2011). While such national- and international agency-level inquiries are beyond the scope of this investigation, they are necessary to capture the politics of language underpinning our observations and thus to mitigate some of the limitations of our method. Frequency counts tell us little about concepts’ underlying meaning; this constraint can only be addressed through classic discourse analysis. We also acknowledge that our quantitative treatment of language in this study risks solidifying and objectifying it, thus potentially stripping it of its inherently interpretive nature. Still, we hope to have shown that software-aided analyses of large amounts of textual data can complement established approaches to studying discourses by adding important insights on the nexus of power and knowledge in social policy formulation across the globe.
Acknowledgements
The authors thank the editors as well as two anonymous reviewers for their excellent comments. Very helpful feedback on earlier versions of the manuscript was provided by Deborah Bräutigam, Sakiko Fukuda-Parr, Mary K. Good, Craig Hayden, Patrick Th. Jackson, James Mittelman, Julie Novkov, Vivien A. Schmidt and Robert H. Wade. Jed Benjamin Byers, Sonja Egeland Kelly and Michael Schmitz provided invaluable editorial support. All remaining errors are entirely the authors’ responsibility.