1. Introduction
Many scholars have employed the detrital mineralogy and chemical composition of clastic deposits to infer the nature and composition of the source rocks, tectonic setting, degree of weathering of the source area, and the provenance (Valloni & Maynard, Reference Valloni and Maynard1981; Bhatia, Reference Bhatia1983; McLennan et al. Reference McLennan, Hemming, McDaniel, Hanson, Johnsson and Basu1993; Cullers & Podkovyrov, Reference Cullers and Podkovyrov2000; Gu et al. Reference Gu, Liu, Zheng, Tang and Qi2002; Madhavaraju & Ramasamy, Reference Madhavaraju and Ramasamy2002; Hofmann, Reference Hofmann2005; Wanas & Abuel-Hassan, Reference Wanas and Abuel-Hassan2006; Moosavirad et al. Reference Moosavirad, Janardhana, Sethumadhav, Moghadam and Shankara2011; Fatima & Khan, Reference Fatima and Khan2012; Tao et al. Reference Tao, Sun, Wang, Yang and Jiang2014; Armstrong-Altrin, Reference Armstrong-Altrin2015; Migani et al. Reference Migani, Borghesi and Dinelli2015; Zaid, Reference Zaid2015; Etemad-Saeed et al. Reference Etemad-Saeed, Hossein-Barzi, Adabi, Miller, Sadeghi, Houshmandzadeh and Stockli2016; Z. M. Wang et al. Reference Wang, Han, Xiao and Sakyi2017). Thus, clastic sedimentary rocks contain important information about the tectonic evolution of an area.
The North Qilian Orogenic Belt is located on the northern margin of the Tibetan Plateau in NW China. The origin of the Palaeozoic North Qilian Belt is related to the evolution of the Proto-Tethys Ocean. It is in a key tectonic position for understanding the evolution of Asia (Du et al. Reference Du, Zhang, Zhou and Peng2002, Reference Du, Zhu and Gu2007; Yan et al. 2007, Reference Yan, Xiao, Windley, Wang and Li2010; Lin & Zhang, Reference Lin and Zhang2012; Yuan & Yang, Reference Yuan and Yang2014a,b, Reference Yuan and Yang2015). This orogen contains an important Tibetan tectonic collage consisting of a complexly deformed Cambrian rift basin, Cambrian–Silurian arcs, subduction–accretion complexes, ophiolites, and back-arc and fore-arc basins (Du et al. Reference Du, Zhu and Gu2007; Yan et al. 2007, Reference Yan, Xiao, Windley, Wang and Li2010; Xiao et al. Reference Xiao, Brian and Yong2009; Xu et al. Reference Xu, Du and Yang2010; Yuan & Yang, Reference Yuan and Yang2014a,b, Reference Yuan and Yang2015; Yang et al. Reference Yang, van Loon, Jin, Jin, Han, Fan and Liu2019). The structural geology, regional geology, stratigraphy and sedimentology of the Angzanggou Formation has been explored (Xia et al. Reference Xia, Xia and Xu1996; Zuo & Wu, Reference Zuo and Wu1997; Du et al. 2002, 2004, Reference Du, Zhu and Gu2007; Xu et al. Reference Xu, Du and Yang2010; Yan et al. Reference Yan, Xiao, Windley, Wang and Li2010). However, the petrography, geochemistry or tectonic setting of the Angzanggou Formation was not reported. This study aims to assess the petrography and the major- and trace-element geochemistry of the sandstones from the Silurian Angzanggou Formation and deduce their provenance, tectonic setting and the intensity of weathering. Knowing the provenance and tectonic setting of the Silurian-deposited material could enhance the understanding of the architecture and orogenic processes of the North Qilian Belt. The study provides the basis for understanding the architecture and the tectonic evolution of the northern Tibetan Plateau.
2. Geological background
The North Qilian Belt is located between the Alxa Block and the Central Qilian Block (Zuo & Liu, Reference Zuo and Liu1987; Xu et al. Reference Xu, Xu, Zhang and Li1994). It is separated from the Alxa Block in the north by the Longshoushan fault and from the Central Qilian Block in the south by the Northern Boundary fault (Fig. 1). The Alxa Block was considered to be unconnected to the North China Block before Early to Middle Triassic times (Yuan & Yang, Reference Yuan and Yang2014a,b). However, Santosh et al. (Reference Santosh, Wilde and Li2007) and Zhao et al. (Reference Zhao, Sun, Wilde and Li2004, Reference Zhao, Sun, Wilde and Li2005) suggested that the Alxa Block was the westernmost part of the North China Block. The Central Qilian is composed of ultramafic rocks, basalt, gabbro and granite. U–Pb zircon ages for a gneissic granite and metatuff indicated that the Central Qilian Belt might be an ancient continental block (Guo & Li, Reference Guo and Li1999). The Qilian Orogen was considered to have had a close evolutionary relationship with Gondwana from Neoproterozoic to early Palaeozoic times (Xu et al. Reference Xu, Zhang and Li2000; Xiao et al. Reference Xiao, Brian and Yong2009). However, Xia et al. (Reference Xia, Xia and Xu2003) believed that the Central Qilian Belt was a continental block rifted away from the southern margin of the North China Plate in Neoproterozoic to Cambrian times. Therefore, knowing the tectonic setting of the North Qilian Belt between the Alxa Block and the Central Qilian Block could enhance the understanding of the tectonic evolution of Asia.
Tectonic framework of North Qilian orogenic belt and distribution of the studied sections (revised from Xu et al. Reference Xu, Du and Yang2010 and Yan et al. Reference Yan, Xiao and Liu2007).

The tectonic setting of the Early Silurian period is controversial. Xu et al. (Reference Xu, Xu, Zhang and Li1994), Feng & He (Reference Feng and He1995) and Zhang et al. (Reference Zhang, Sun and Zhou1997) interpreted the sedimentary strata as having been deposited in a relict basin. Xia et al. (Reference Xia, Xia and Xu2003) and Du et al. (Reference Du, Zhu, Han and Gu2004) interpreted the Angzanggou Formation as a foreland basin fill based on the presence of Silurian remnant-flysch. Xiao et al. (Reference Xiao, Brian and Yong2009), Gehrels et al. (Reference Gehrels, Yin and Wang2003) and Zuo & Liu (Reference Zuo and Liu1987) interpreted the Angzanggou Formation as an arc-related basin fill based on its sandstone and detrital mode. However, the petrology and geochemistry of volcaniclastic material in the Silurian sandstones indicate that the sediments were fore-arc basin fill (Xiao et al. Reference Xiao, Brian and Yong2009; Yan et al. Reference Yan, Xiao, Windley, Wang and Li2010; Hou et al. 2016, Reference Hou, Mou, Wang and Tan2018a,b; Yuan & Yang, Reference Yuan and Yang2015).
The study areas include Sunan (LHP), Yumen (YEP), Yongdeng (SHP) and Tianzhu (TZP). Sunan (LHP) and Yumen (YEP) are located in the western part of the North Qilian Belt. Yongdeng (SHP) and Tianzhu (TZP) are located in the eastern part of the North Qilian Belt. The Angzanggou Formation ranges from 200 to 450 m in thickness and mainly consists of conglomerate, sandstone and mudstone. The bedding structures include horizontal bedding, parallel bedding and ripple marks. There are many massive graptolites, including Demirastrites triangulatus, D. convolutes, Monograptus sedgwickii, Glyptograptus persculptus, Hunanodendrum sp., H. irregulare and Pristiograptus sp., in the Angzanggou Formation (Xia et al. Reference Xia, Xia and Xu2003; Guo & Li, Reference Guo and Li1999; Wan et al. Reference Wan, Xu, Yang and Zhang2003). The above graptolite assemblages indicate that the Angzanggou Formation should be assigned to the Lower Silurian.
3. Samples and analytical methods
The study area is located in the western and eastern part of the North Qilian Belt. A total of 32 sandstone samples were collected from a section of the Angzanggou Formation in the North Qilian Belt (Fig. 1). Sampling locations are shown in Figure 2. All collected samples were packed into plastic bags to avoid contamination and oxidation.
Stratigraphic section and different clast contents of the Angzanggou Formation (locations in Fig. 1).

The petrographic features (composition, texture and fabric) of the clastic rock samples were studied with an optical microscope. A total of 35 thin-sections were prepared, and approximately 300 points were counted in each thin-section by using the Dickinson and Valloni method (Dickinson & Suczek, Reference Dickinson and Suczek1979; Valloni & Maynard, Reference Valloni and Maynard1981; Dickinson et al. Reference Dickinson, Harbaugh, Shaller, Heller and Snyder1983; Meng, Reference Meng1993).
The samples were crushed and ground to smaller than 200-mesh in an agate mortar for geochemical analysis. The oxides of major elements were analysed using an X-ray fluorescence spectrometer (AB-104L, PW2404) in the laboratory of CNNC Beijing Research Institute of Uranium Geology. The analytical uncertainty is generally less than 2 %. Using an inductively coupled plasma-mass spectrometer (ICP-MS), we analysed 36 trace elements (including rare earth elements (REEs)) in 32 samples according to the method described in the Chinese National Standard DZ/T 0223-2001 (2001). The analytical procedure is described as follows. Firstly, 25 mg of powder were weighed, placed in high-pressure-resistant beakers containing a mixture of HF-HNO3 (1:1), heated for 36 h at 80 °C and evaporated. Secondly, after the solutions were evaporated to dryness, 1.5 mL of HNO3, 1.5 mL of HF and 0.5 mL of HCLO4 were added. The beakers containing the solutions were then capped for digestion in a high-temperature oven at 180 °C for at least 48 h until the samples were completely dissolved. Finally, the solutions were diluted to a volume of 50 mL with 1 % HNO3 for analysis. The trace elements were measured with a Thermo Scientific ELEMENT XR ICP-MS instrument at 20 °C and under 30 % relative humidity. The analytical uncertainty is generally less than 5 %.
4. Results
4.a. Petrography
The conglomerate is distributed at the edge of the basin and near the source area, and its composition directly reflects the composition of the parent rock in the source area. Statistics on the composition and proportion of the gravel can be used to determine the characteristics of the source rock (Yu, Reference Yu1984). Because the framework mineral composition of sandstone is sensitive to the maturity of the source and tectonic environment, determining the tectonic properties of the source area based on the composition of the sandstone and further exploring the basin type and basin evolution have become a general method for basin analysis (Hendrix, Reference Hendrix2000).
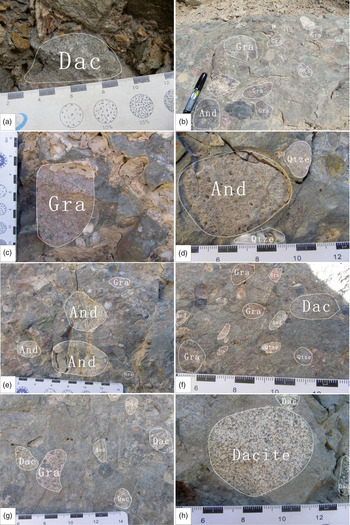
The content of conglomerates in the Silurian Angzanggou Formation was less than 20 %. The conglomerates are not modified by regional metamorphism and are distributed together with massive to thinly bedded, medium-to-coarse-grained sandstone (Fig. 3). The conglomerates are typically poorly sorted (Fig. 3a), coarse grained, and matrix and clast supported, although rounded pebbles and cobbles and angular boulders (Fig. 3b, c) occur in some outcrops. In order to guarantee the correct determination of pebble type, the diameter of the selected pebbles should be larger than 5 cm (Duerr, Reference Duerr1994). The clasts of the conglomerate consist of volcanic, sedimentary, metamorphic and plutonic rocks, the majority being volcanic clasts (Fig. 3d–h). The volcanic clasts are mainly dacites, porphyritic andesites and silicified tuffs. We consider that these conglomeratic clasts were derived from a volcanic source.
Photographs of different clasts of the Angzanggou Formation.

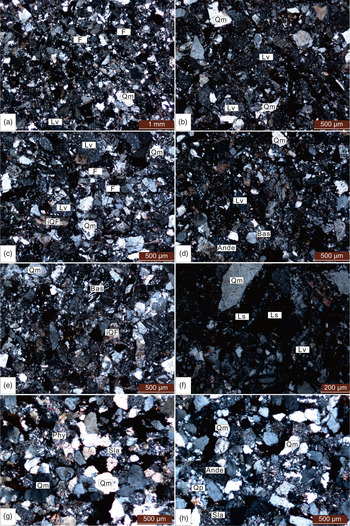
The thick sandstone layer is mainly located on the top of the conglomerate in the study area. Lithic fragments (56–86 %, average = 71 %) are the main component of the sandstone in the study area. The litharenites are medium- to fine-grained and interbedded with grey-green muddy siltstones and silty mudstones (Fig. 2). The sandstones are composed of angular–subangular lithic clasts, feldspar (Fig. 4a) and quartz fragments (Fig. 4b). The lithic fragments (Fig. 4c) of the litharenites are complex, consisting of chert (Fig. 4d), granite, siltstone (Fig. 4e), dacite (Fig. 4f), carbonate (Fig. 4g), andesite (Fig. 4h), quartz schist and mica-quartz schist. The major igneous fragments are dacites and granites, and minor amounts of andesite fragments exist in some sections. The high ratio of volcanic lithic fragments indicates that the lithic clasts in the sandstone of the Angzanggou Formation were derived from felsic volcanic and granitoid rocks (Dickinson & Valloni, Reference Dickinson and Valloni1980). The detrital mode of the sandstones suggests that these fragments were derived from a continental arc (Hou et al. 2016, Reference Hou, Mou, Wang and Tan2018a).
Photomicrographs of sandstones from the Xueshan Formation, cross-polarized light. (a) Litharenite with monocrystalline quartz (Qm), volcanic fragment (Lv) and granite fragment (iQF). (b) Basalt (Bas). (c) Litharenite with monocrystalline quartz (Qm) and volcanic fragment (Lv). (d) Andesite (Ande). (e) Greywacke with polycrystalline quartz (Qp). (f) Sedimentary lithic clast (Ls). (g) Slate lithic clast (Sla). (h) Metamorphic lithic clast (Phy).

4.b. Geochemistry
4.b.1. Major-element concentrations
The concentrations of major elements and trace-element ratios in the Angzanggou Formation sandstone are listed in Table 1. The average contents of chemical components in the samples were compared with upper continental crust normalization values (UCC; Table 1). The results of the comparison show that the clastic sedimentary rocks of the Angzanggou Formation have a low SiO2 content (53.78–87.68 %, average = 66.66 %), which is close to that of Palaeozoic greywacke (66.10 %), but significantly lower than that of typical quartz sandstone (91.5 %) and arkose (77.1 %) (Fedo et al. Reference Fedo, Nesbitt and Young1995; Cullers & Podkovyrov, Reference Cullers and Podkovyrov2000). The major elements of the Angzanggou Formation show little change on the whole and are relatively stable. Compared with UCC, the concentrations of Fe2O3 and MgO in the sandstone samples are higher than those in UCC, indicating that their source rocks had basic rock features. The SiO2/Al2O3 ratio indicates the maturity of sedimentary rocks. A SiO2/Al2O3 ratio above 5 represents a mature chemical composition (Roser et al. Reference Roser, Cooper, Nathan and Tulloch1996). The SiO2/Al2O3 ratio of the Angzanggou Formation clastic sedimentary rocks is relatively high (3.33–18.42, average = 5.9), indicating low maturity (Armstrong-Altrin & Machain-Castillo, Reference Armstrong-Altrin and Machain-Castillo2016).
The concentrations of major elements in sandstones from the Angzanggou Formation

Most samples have low K2O (0.15–4.15 %, average = 2.17 %) and Al2O3 (4.76–17.98 %, average = 12.71 %) contents, suggesting a small content of clay minerals. The MgO, TiO2 and Fe2O3T contents are negatively correlated with the SiO2 contents (Fig. 5), indicating that unstable component contents in the sandstones gradually decreased with the increase in the maturity of the clastic rocks. The TiO2 content was positively correlated with the Fe2O3T and MgO contents (R2 = 0.57, 0.46, respectively; Fig. 5), showing that Ti content was mainly controlled by mafic materials.
Variation diagrams of major oxides for Angzanggou Formation sandstone.

4.b.2. Trace-element concentrations
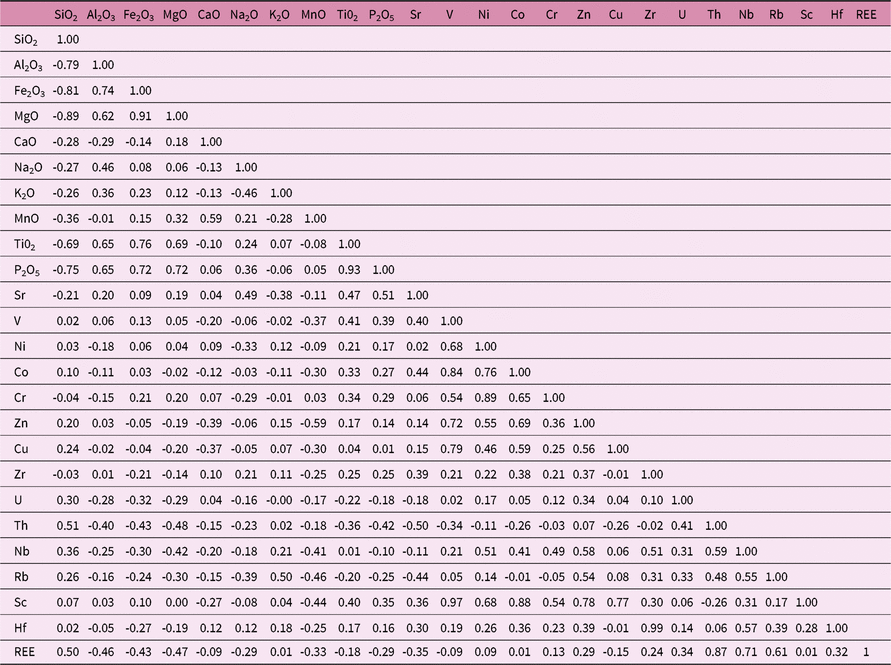
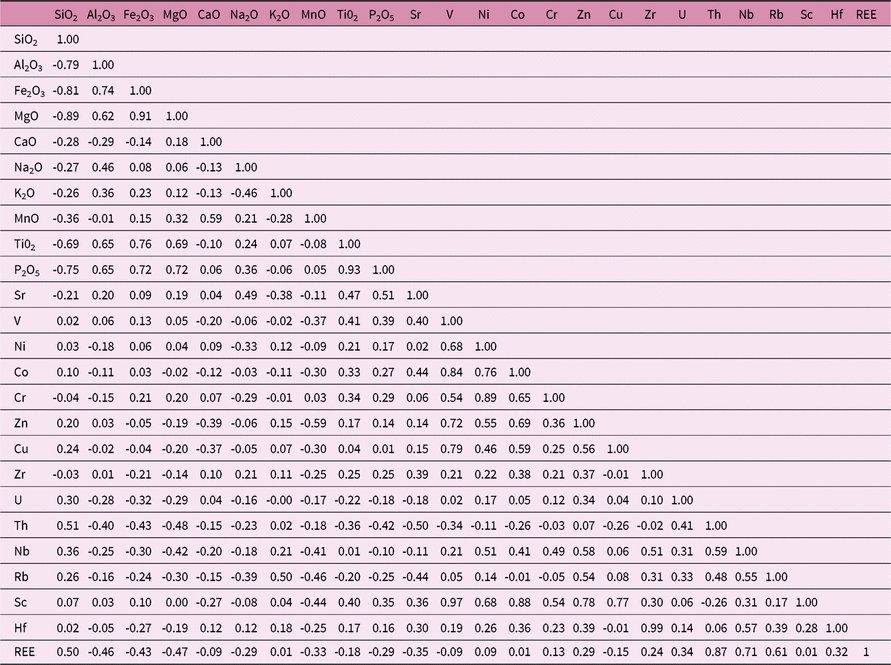
Regarding large ion lithophile elements (LILEs), compared with UCC, the Rb and Cs contents were relatively high, but the contents of Ba and Sr in the sandstones were depleted. Rb was positively correlated with K2O (r = 0.5) (Table 4), indicating that the Rb content in the Angzanggou Formation sandstone was mainly controlled by K-feldspar. However, the correlation between Th and Al2O3 in the Angzanggou sandstone was not statistically significant, suggesting that their distribution was not mainly controlled by phyllosilicates (Armstrong-Altrin et al. Reference Armstrong-Altrin, Ramos-Vázquez, Zavala-León and Montiel-García2018).
Transition trace elements, also called ferromagnesian trace elements, include Ni, V, Co, Cu and Cr and show convergent behaviours during the evolutionary processes of volcanic rocks (Armstrong-Altrin et al. Reference Armstrong-Altrin, Lee, Verma and Ramasamy2004). Compared with UCC and Post Archaean Australian Shale (PAAS), the contents of Ni, V, Co, Cu and Cr were moderately depleted (Table 2). The correlation between Al2O3 and V, Sc and Ni contents for the Angzanggou sandstones (r = 0.06, 0.03 and −0.18, respectively) (Table 4) indicate that these elements might be not controlled by phyllosilicates (Lopez et al. Reference Lopez, Bauluz, Fernandez-Nieto and Oliete2005; Armstrong-Altrin, Reference Armstrong-Altrin2015).
The concentrations of trace elements in sandstones from the Angzanggou Formation

High-field-strength elements have more ionic charges and become insoluble and immobile during weathering and metamorphism, displaying a low sensitivity to post-crystallization alteration (White et al. Reference White, Pringle, Garzanti, Bickle, Najman, Chapman and Friend2002; Grosch et al. Reference Grosch, Bisnath, Frimmel and Board2007; Koralay, Reference Koralay2010). In the Angzanggou Formation, the Zr content ranges from 9.56 to 225 μg/g (Table 2). Zr was closely correlated with Hf (r = 0.99, n = 32) (Table 4), indicating that they had similar geochemical behaviours and were not differentiated during weathering/sedimentation processes (Hu et al. Reference Hu, Qi, Fu and Yu2015; Tapia-Fernandez et al. Reference Tapia-Fernandez, Armstrong-Altrin and Selvaraj2017).
4.b.3. Rare earth elements
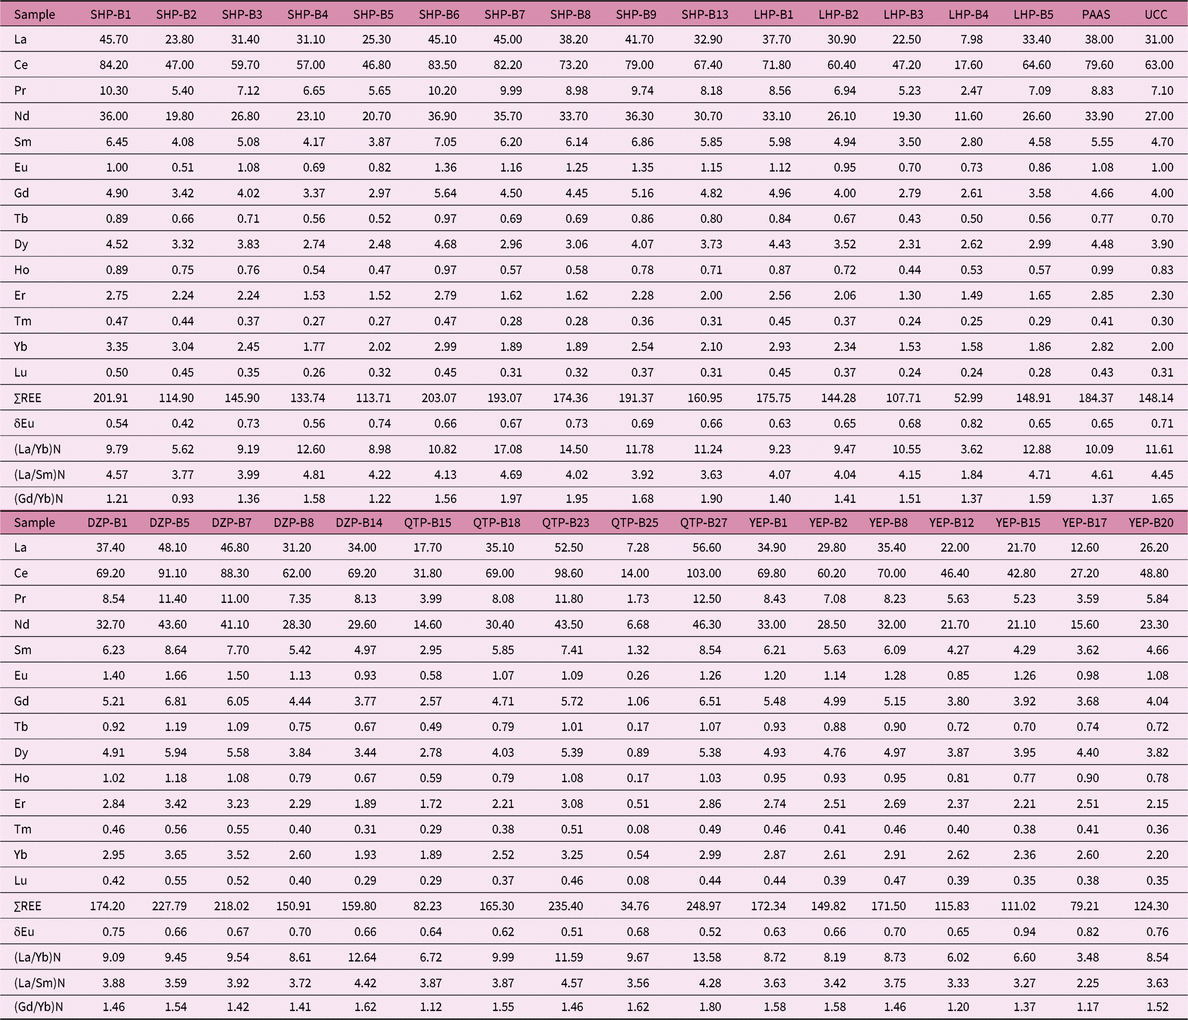
Sedimentary rocks in the Angzanggou Formation are rich in rare earth elements (∑REE) with a concentration range of 34.76–248.97 μg/g and an average of 152.62 μg/g (Table 3). Most samples have higher ∑REE than UCC (146 μg/g; Taylor & McLennan, Reference Taylor and McLennan1985) (Table 3). The ratio of light rare earth elements (LREEs) to heavy rare earth elements (HREEs) (LREE/HREE) ranged from 3.63 to 17.83, and the average was 10.07, indicating that there was a significant enrichment in LREEs compared to HREEs. Compared with PAAS and UCC (Eu/Eu* = 0.66, 0.72), the samples from the Angzanggou Formation showed a slight positive Eu anomaly (Eu/Eu* = 0.42–0.94, Eu/Eu*average = 0.67).
The concentrations of rare earth elements in sandstones from the Angzanggou Formation

The correlation between ∑REE and Al2O3 in the Angzanggou sandstones (r = − 0.46, n = 32) (Table 4) was statistically significant. The correlation between ∑REE and Zr content in the Angzanggou Formation sandstones was not statistically significant (r = 0.24, n = 32) (Table 4). These correlation coefficients suggest that REEs were mainly hosted in clay minerals rather than detrital minerals (Armstrong-Altrin et al. Reference Armstrong-Altrin, Lee, Kasper-Zubillaga, Carranza-Edwards, Garcia, Eby, Balaram and Cruz-Ortiz2012; Ali et al. Reference Ali, Stattegger, Garbe-Schongerg, Frank, Kraft and Kuhnt2014).
Correlation matrix of chemical elements and maturity index in sandstones from the Angzanggou Formation
5. Discussion
5.a. Sediment maturity
The SiO2/Al2O3 ratio indicates the maturity of sedimentary rocks. A SiO2/Al2O3 ratio above 5 represents a mature chemical composition of rocks (Roser et al. Reference Roser, Cooper, Nathan and Tulloch1996). The SiO2/Al2O3 ratio of clastic sedimentary rocks in the Angzanggou Formation was relatively high (3.33–18.42, average = 5.9), indicating a relatively low degree of recycling and maturity of the sediments. The index of chemical variability (ICV = ((Fe2O3 + MnO + MgO + CaO + Na2O + K2O + TiO2)/Al2O3)) (Cox et al. Reference Cox, Lowe and Cullers1995) can be used to identify the compositional maturity of sediments and has been successfully applied in many studies (Armstrong-Altrin et al. Reference Armstrong-Altrin, Nagarajan, Lee and Kasper-Zubillaga2014; Garzanti et al. Reference Garzanti, Vermeesch, Padoan, Resentini, Vezzoli and Ando2014; Absar & Sreenivas, Reference Absar and Sreenivas2015). Rock-forming minerals such as amphiboles, pyroxenes and feldspars show ICV values of >1, whereas alteration products such as illite, kaolinite and muscovite show ICV values of <1 (Cox et al. Reference Cox, Lowe and Cullers1995; Cullers & Podkovyrov, Reference Cullers and Podkovyrov2000). Compositionally mature sediments with low ICV values show high degrees of recycling, whereas compositionally immature sediments with high ICV values indicate first-cycle deposits (Vandekamp & Leake, Reference Vandekamp and Leake1985). The ICV values of the Angzanggou sandstones (0.88–2.15, average = 1.32) are higher than 1 (Table 1), inferring that they were associated with rock-forming minerals and derived from a slightly weathered source area. Therefore, the compositional maturity for the sandstones of the Angzanggou Formation is moderate.
5.b. Weathering history of the source area
Chemical weathering in a source area progressively modifies the original mineralogy of rocks. The mineral maturity of sediments mainly reflects the weathering process, where the degree of conversion of feldspar to aluminous clays is related to palaeoclimate, palaeoweathering and tectonism (Fedo et al. Reference Fedo, Nesbitt and Young1995; Nesbitt et al. Reference Nesbitt, Fedo and Young1997; Armstrong-Altrin et al. Reference Armstrong-Altrin, Nagarajan, Madhavaraju, Rosalez-Hoz, Lee, Balaram, Cruz-Martinez and Avila-Ramirez2013; Nagarajan et al. Reference Nagarajan, John, Armstrong-Altrin and Franz2015). In this study, the chemical index of alteration (CIA) is used to comprehensively reflect the intensity of chemical weathering in the source region. The CIA can be calculated as (molecular proportion):
 $${\rm{CIA}} = 100 \times \left( {{\rm{A}}{{\rm{l}}_2}{{\rm{O}}_3}/\left( {{\rm{A}}{{\rm{l}}_2}{{\rm{O}}_3} + {\rm{CaO}}* + {\rm{N}}{{\rm{a}}_2}{\rm{O}} + {{\rm{K}}_2}{\rm{O}}} \right)} \right)$$
where CaO* is the amount of CaO incorporated in the silicate fraction of the rock. The correction of CaO is done as carbonate contribution and it is difficult to determine the proportions of dolomite and calcite. Thus, the assumption by Bock et al. (Reference Bock, McLennan and Hanson1998) was adopted. Bock et al. (Reference Bock, McLennan and Hanson1998) assumed that CaO values were accepted only if CaO < Na2O. If CaO > Na2O, it was assumed that CaO = Na2O. On the basis of the classification method of Fedo et al. (Reference Fedo, Nesbitt and Young1995), we have included some studies on chemical weathering intensity in different areas (Nesbitt & Young, Reference Nesbitt and Young1982, Reference Nesbitt and Young1989; Nesbitt et al. Reference Nesbitt, Young and McLennan1996; Chen et al. Reference Chen, Pei, Li and Li2014; Ding et al. Reference Ding, Jiang and Sun2014). Generally, when CIA values vary from 50 to 65, it reflects a low degree of weathering corresponding to a cold and dry climate; when CIA values vary from 65 to 85, it reflects a moderate degree of weathering corresponding to a warm and humid climate; when CIA values vary from 85 to100, it reflects a strong degree of weathering corresponding to a hot and wet climate. The CIA values of the Angzanggou sandstones varied from 51.35 to 75.92 with an average of 67.24 (Table 1). These Angzanggou sandstone CIA values indicate a moderate degree of chemical weathering.
5.c. Provenance
5.c.1. Petrography
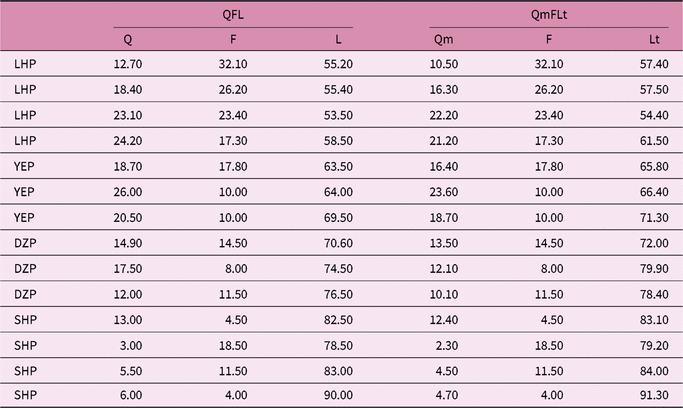
The detrital framework mode data for the sandstones (Table 5) were plotted on the Q–F–L and Qm–F–Lt ternary diagrams (Dickinson & Suczek, Reference Dickinson and Suczek1979; Dickinson et al. Reference Dickinson, Harbaugh, Shaller, Heller and Snyder1983) (Fig. 6). The Angzanggou Formation sandstones are rich in lithic fragments and lie in the magmatic arc field on the Q–F–L ternary provenance diagram (Fig. 6). The Qm–F–Lt diagram for the sandstones was plotted from the Q–F–L diagram. Sandstone samples from the Sunan section plot in the recycled orogenic source field (Fig. 6).
Contents of detrital composition from the Angzanggou Formation sandstones

(a) Q-F-L and (b) Qm–F–Lt tectono-provenance discrimination diagram (Dickinson, Reference Dickinson and Zuffa1985) for the Angzanggou Formation sandstone.

The petrography results indicate that the angular volcanic and granitoid gravel clasts were proximal deposits. The well-rounded metamorphic and sedimentary gravel clasts were derived from a distant source. The volcanic gravel clasts are similar to arc volcanic rocks in the Central Qilian Belt and the metamorphic gravels are similar to Precambrian felsic gneisses in the Central Qilian Belt (Yan et al. Reference Yan, Xiao, Windley, Wang and Li2010). The Silurian sandstones are rich in lithic fragments and plot in the magmatic arc fields on the Q–F–L ternary provenance diagram. In the Qm–F–Lt diagram, the sandstone samples from the Yongdeng and Tianzhu sections mainly plot in the transitional and undissected arc fields, and some samples from the Sunan and Yuerhong sections plot in the remnant oceanic arc field. These geographical relationships indicate a distinct change in the trend of the source areas from a continental arc to a remnant arc westwards across the region. Therefore, we infer that, in the Silurian sandstones, sedimentary and metamorphic fragments decrease but volcanic fragments and dacite fragments increase towards the west across the North Qilian Belt.
5.c.2. Geochemistry
Girty et al. (Reference Girty, Ridge and Knaack1996) believed that if sediments were sourced from mafic rocks, the Al2O3/TiO2 ratio was less than 14; if sediments were sourced from felsic rocks, the Al2O3/TiO2 ratio ranged from 19 to 28. The Al2O3/TiO2 ratio of the samples from the Angzanggou Formation varied from 13.94 to 87.14 (average = 22.92), indicating that source materials were mainly felsic rocks. In addition, an equation for discriminating the provenance of sedimentary rocks was established by Roser & Korsch (Reference Roser and Korsch1988). According to the F1–F2 discrimination diagrams (Fig. 7), the provenance of the Angzanggou sandstones mainly consisted of sedimentary rocks, with five samples falling in the felsic volcanic provenance field. These observations are in good consistency with the petrographic results.
Discrimination diagrams for the provenance signature of sedimentary rocks of the Angzanggou Formation using major elements (after Roser & Korsch, Reference Roser and Korsch1988). F1 = − 1.773TiO2 + 0.607Al2O3 + 0.76Fe2O3T − 1.5MgO + 0.616CaO +0.509Na2O − 1.224K2O − 9.09; F2 = 0.445TiO2 + 0.07Al2O3 − 0.25Fe2O3T − 1.142MgO + 0.438CaO + 1.475Na2O + 1.426K2O − 6.861.

The plot of La/Th versus Hf is a widely used provenance discrimination diagram (Gu et al. Reference Gu, Liu, Zheng, Tang and Qi2002). Most samples are scattered in the felsic source area and the mixed felsic/basic source area fields (Fig. 8). The results are consistent with Figure 7. Certain trace elements (i.e. Y, Th, Co, Zr, Hf and Sc) in clastic rocks can indicate provenance because they have low mobility and are thought to be quantitatively transferred from source rocks to the clastic sediments during the weathering, transportation and diagenesis processes (McLennan et al. Reference McLennan, Hemming, McDaniel, Hanson, Johnsson and Basu1993; Armstrong-Altrin et al. Reference Armstrong-Altrin, Lee, Verma and Ramasamy2004).
La/Th–Hf diagram (after Floyd & Leveridge, Reference Floyd and Leveridge1987) for the Angzanggou Formation.

5.c.3. Evidence from rare earth element concentrations
REEs in sedimentary rocks can provide significant information about the source area (Taylor & McLennan, Reference Taylor and McLennan1985; Bhatia & Crook, Reference Bhatia and Crook1986; Floyd & Leveridge, Reference Floyd and Leveridge1987; Gu et al. Reference Gu, Liu, Zheng, Tang and Qi2002). The chondrite-normalized REE patterns for the Angzanggou sandstones are given in Figure 9. Its distribution patterns are similar to those of UCC and PAAS, indicating that the Angzanggou sandstones were sourced from upper crustal rocks. Compared with PAAS and UCC (Eu/Eu* = 0.66, 0.72, respectively), the samples from the Angzanggou Formation rocks showed a negative Eu anomaly (Eu/Eu* = 0.42–0.94, Eu/Eu* average = 0.67). It can be concluded that the Angzanggou Formation rocks may be evolved from felsic rocks.
Chondrite-normalized REE patterns for the sandstone from the Angzanggou Formation and the source rocks located near to the study area. Chondrite-normalized date from Sun & McDonough (Reference Sun, McDonough, Saunders and Norry1989).

5.c.4. Source rock
The Angzanggou sandstones are enriched in REES, in the concentration range of 34.76–248.97 μg/g (Table 3), and they generally show low–medium fractionation of light to heavy REES ((La/Yb)N = 3.48–17.08). According to the REE patterns (Fig. 9a, b), the LREE section dips steeply with a large slope, which is shown as an obvious right decline, showing low–medium fractionation of LREEs ((La/Sm)N = 2.25–4.71); the HREE section has a smaller slope, indicating weak fractionation of HREEs ((Gd/Yb)N = 0.93–1.97). The North Qilian Ophiolite displays a flat and slightly enriched REE pattern ((La/Yb)N = 1.01–2.56) and a weak negative Eu anomaly (Eu/Eu* = 0.77–1.0) (Fig. 9c) (Song et al. Reference Song, Niu, Su and Xia2013). The North China Craton granite shows enriched LREE patterns with high (La/Yb) ratios (60.5 to 90.0) and weakly negative Eu anomalies (Eu/Eu* = 0.86–1.13) in the chondrite-normalized REE patterns (Fig. 9d) (Zhou et al. Reference Zhou, Zhao, Wang and Guo2011). The Dunhuang volcanic rocks display moderate fractionation between LREEs and HREEs ((La/Yb)N = 3.62–4.38), with minor positive or negative Eu anomalies (Eu/Eu* = 0.92–1.05) (Fig. 9e) (Z. W. Wang et al. Reference Wang, Wang and Fu2017). The North Qilian acid volcanic arc rocks generally feature low–medium fractionation of LREEs to HREEs ((La/Yb)N = 6.48–23.28); the LREE section dips steeply with a large slope, which is shown as an obvious right decline (Fig. 9f) (Z. Y. Liang, unpub. MSc. dissertation, China Univ. Geosci., 2017). From comparison with the source rocks located near to the study area, the characteristics of the samples from the Angzanggou Formation are in agreement with the North Qilian acid volcanic arc rocks. The diagrams indicate that the formation environment of the fine clastic sedimentary rocks in the Angzanggou Formation was mainly related to the North Qilian acid volcanic arc rocks.
5.d. Tectonic setting
The tectonic setting of the Angzanggou Formation is an important constraint on the Palaeozoic tectonic history of the North Qilian Belt and the northern Tibetan Plateau.
The discrimination diagrams based on the detrital framework proposed by Dickinson & Suczek (Reference Dickinson and Suczek1979), Dickinson & Valloni (Reference Dickinson and Valloni1980) and Dickinson et al. (Reference Dickinson, Harbaugh, Shaller, Heller and Snyder1983) can be used to identify the provenance and tectonic setting of sandstones. The analysis of lithic fragments and feldspar grains suggests that the sandstones in the Angzanggou Formation were derived from an active continental margin or an island arc and deposited in an arc-related basin. A palaeocurrent study showed that the palaeocurrent directions in the North Qilian Belt were mainly 330°–50° (Du et al. Reference Du, Zhu, Han and Gu2004), so the rocks had a provenance from the south.
Tectonic discrimination diagrams (Bhatia, Reference Bhatia1985; Bhatia & Crook, Reference Bhatia and Crook1986; Roser & Korsch, Reference Roser and Korsch1988; Armstrong-Altrin & Verma, Reference Armstrong-Altrin and Verma2005) have been used to assess the major-element-based discrimination diagrams for Miocene to Holocene clastic sedimentary rocks. Bhatia (Reference Bhatia1985) realized a low success rate of 0–23 %, and Roser & Korsch (Reference Roser and Korsch1988) achieved a success rate of 31.5–52.3 %. However, Verma & Armstrong-Altrin (Reference Verma and Armstrong-Altrin2013) proposed two discrimination diagrams based on major elements to infer the tectonic setting of siliciclastic sediments, and the two discrimination diagrams have been successfully applied in recent studies (Armstrong-Altrin et al. 2014; Armstrong-Altrin, Reference Armstrong-Altrin2015; Tawfik et al. Reference Tawfik, El-Sorogy and Mowafi2015; Zaid, Reference Zaid2015).
Some low-mobility trace elements (Th, Co, Y, Zr and Sc) are the most appropriate for the discrimination of source area and tectonic setting (Bhatia, Reference Bhatia1985; Bhatia & Crook, Reference Bhatia and Crook1986). The discrimination diagrams of Th–Sc–Zr and Th–Co–Zr proposed by Bhatia & Crook (Reference Bhatia and Crook1986) were used to explore the tectonic setting classification of the clastic sedimentary rocks. The samples from the Angzanggou Formation mostly fall in the island arc field and active continental margin field, with even the samples that fall outside these fields still being close to them (Fig. 10).
Tectonic discrimination diagrams of Th–Co–Zr/10 and Th–Sc–Zr/10 (after Bhatia & Crook, Reference Bhatia and Crook1986) for the clastic rocks from the Angzanggou Formation. OIA – oceanic island arc; CIA – continental island arc; ACM – active continental margin; PM – passive margin.

Verma & Armstrong-Altrin (Reference Verma and Armstrong-Altrin2013) proposed two new discriminant-function-based major-element diagrams for the tectonic discrimination of siliciclastic sediments from three main tectonic settings (island or continental arc, continental rift and collision) for the tectonic discrimination of high-silica ((SiO2)adj = 63–95 %) and low-silica ((SiO2)adj = 35–63 %) rocks. These two diagrams were proposed based on worldwide examples of Neogene–Quaternary siliciclastic sediments from known tectonic settings, loge-ratio transformation of ten major elements with SiO2 as the common denominator and linear discriminant analysis of the loge-transformed ratio data. In recent studies (Armstrong-Altrin, Reference Armstrong-Altrin2015; Nagarajan et al. Reference Nagarajan, John, Armstrong-Altrin and Franz2015; Samir & Zaid, Reference Samir and Zaid2015), these diagrams were used to discriminate the tectonic setting of a source region based on sediment geochemistry.
The (SiO2)adj content of clastic sediments in the Angzanggou Formation was higher than 63. The high-silica diagram of Verma & Armstrong-Altrin (Reference Verma and Armstrong-Altrin2013) was used to identify the probable tectonic setting of the source area. The samples mainly plotted in the collision and arc fields (Fig. 11a). The (SiO2)adj content in a small number of samples was lower than 63. The low-silica diagram of Verma & Armstrong-Altrin (Reference Verma and Armstrong-Altrin2013) was used to identify the probable tectonic setting of the source area. The samples plotted in the arc fields (Fig. 11b). The sediments in the Angzanggou Formation were thus derived from a continental arc zone, and an active continental margin sedimentary cover probably overlaid the volcanic arc. The results obtained from these two discriminant-function-based multi-dimensional diagrams provides good evidence for the tectonic system of the North Qilian Belt. The results were consistent with the above trace-element geochemical analysis and petrographic analysis.
(a) New discriminant-function multi-dimensional diagram proposed by Verma & Armstrong-Altrin (Reference Verma and Armstrong-Altrin2013) for low-silica clastic sediments from three tectonic settings (arc, continental rift and collision). The subscriptm2 in DF1 and DF2 represents the low-silica diagram based on loge-ratio of major elements. Discriminant-function equations are: DF1(Arc-Rift-Col)m2 = (0.608 × ln(TiO2/SiO2)adj) +(−1.854 × ln(Al2O3/SiO2)adj) + (0.299 × ln(Fe2O3t/SiO2)adj) + (−0.55 × ln(MnO/SiO2)adj) +(0.12 × ln(MgO/SiO2)adj) + (0.194 × ln(CaO/SiO2)adj) + (−1.51 × ln(Na2O/SiO2)adj) +(1.941 × ln(K2O/SiO2)adj) + (0.003 × ln(P2O5/SiO2)adj) − 0.294. DF2(Arc-Rift-Col)m2 = (−0.554 × ln(TiO2/SiO2)adj) + (−0.995 × ln(Al2O3/SiO2)adj) + (1.765 × ln(Fe2O3t/SiO2)adj) + (−1.391 ×ln(MnO/SiO2)adj) + (−1.034 × ln(MgO/SiO2)adj) + (0.225 × ln(CaO/SiO2)adj) + (0.713 ×ln(Na2O/SiO2)adj) + (0.33 × ln(K2O/SiO2)adj) + (0.637 × ln(P2O5/SiO2)adj) − 3.631. (b) New discriminant-function multi-dimensional diagram proposed by Verma & Armstrong-Altrin (Reference Verma and Armstrong-Altrin2013) for high-silica clastic sediments from three tectonic settings (arc, continental rift and collision). The subscriptm2 in DF1 and DF2 represents the high-silica diagram based on loge-ratio of major elements. Discriminant-function equations are: DF1(Arc-Rift-Col)m2 = (−0.263 × ln(TiO2/SiO2)adj) +(0.604 × ln(Al2O3/SiO2)adj) + (−1.725 × ln(Fe2O3t/SiO2)adj) + (0.66 × ln(MnO/SiO2)adj) + (2.191 × ln(MgO/SiO2)adj) +(0.144 × ln(CaO/SiO2)adj) + (−1.304 × ln(Na2O/SiO2)adj) + (0.054 × ln(K2O/SiO2)adj) +(−0.33 × ln(P2O5/SiO2)adj) + 1.588. DF2(Arc-Rift-Col)m2 = (−1.196 × ln(TiO2/SiO2)adj) +(1.604 × ln(Al2O3/SiO2)adj) + (0.303 × ln(Fe2O3t/SiO2)adj) + (0.436 × ln(MnO/SiO2)adj) +(0.838 ×ln(MgO/SiO2)adj) + (−0.407 × ln(CaO/SiO2)adj) + (1.021 × ln(Na2O/SiO2)adj) +(−1.706 × ln(K2O/SiO2)adj) + (−0.126 × ln(P2O5/SiO2)adj) − 1.608.

Although each provenance discrimination diagram has certain limitations, it can be determined from all the discrimination diagrams that the sandstones of the Angzanggou Formation were mainly from a continental island arc and active continental margin. All these data imply that the sediments of the North Qilian Belt accumulated in an arc-related basin.
The accretion of the Qilian Shan to the Alxa Block is known to have occurred during the Ordovician – late Devonian period (Zuo & Liu, Reference Zuo and Liu1987; Liu, Reference Liu1988; Xia et al. Reference Xia, Xia and Xu1996; Zuo & Wu, Reference Zuo and Wu1997; Xu et al. Reference Xu, Zhang and Li2000; Cowgill et al. Reference Cowgill, Yin, Harrison and Wang2003). The spatial and temporal tectonic frameworks of the northern Tibetan Plateau are controversial, especially the deposition provenance, the subduction polarity and the tectonic setting of the Lower Silurian clastic rocks in the North Qilian Belt. Yang et al. (Reference Yang, Xu, Zhang, Chu, Zhang, Liu, Hendrix and Davis2001) and Xu et al. (Reference Xu, Zhang and Li2000) envisaged that the North Qilian Ocean was enclosed by NE-dipping subduction zones and the Silurian sediments were deposited in a remnant ocean basin in the North Qilian Belt. Zhang et al. (Reference Zhang, Wang and Qian2000) and Feng & He (Reference Feng and He1995) suggested that the collisional orogen in the North Qilian Belt destroyed all oceanic crust formed in the Late Ordovician – Early Silurian period, indicating that the Silurian sediments were deposited in the post-orogenic period. Li et al. (Reference Li, Liu, Zhu, Feng and Wu1978) and Hsü et al. (Reference Hsü, Pan and Sengor1995) suggested that convergent margins faced southwest and northeast, and that a Silurian fore-arc basin was formed in the North Qilian Belt. Zuo & Liu (Reference Zuo and Liu1987), Yan et al. (Reference Yan, Xiao, Windley, Wang and Li2010) and Hou et al. (Reference Hou, Mou, Wang and Tan2018a,b) suggested that the Silurian sediments were deposited in a fore-arc basin.
Taking into account all the above data and previous studies, we interpret the Palaeozoic tectonic evolution of the North Qilian Belt as follows. In Early–Late Ordovician time, the North China Plate was subducted southwards and subduction-related arc magmatism formed an interoceanic arc (Hsü et al. Reference Hsü, Pan and Sengor1995; Yan et al. Reference Yan, Xiao and Liu2007, Reference Yan, Xiao, Windley, Wang and Li2010; Xiao et al. Reference Xiao, Brian and Yong2009; Yuan & Yang, Reference Yuan and Yang2015; Hou et al. Reference Hou, Mou, Wang, Tan, Ge and Wang2018b). Our data from the sandstones and conglomerates of the Lower Silurian Angzanggou Formation are consistent with a fore-arc basin model. The oceanic plate south of the North China Plate was then subducted southwards and subduction-related arc magmatism formed a continental island arc. In the Upper Silurian Hanxia Formation, the arc became accreted to the Central Qilian Terrane in the south, thus forming a composite continental arc upon which the North Qilian sediments were accumulated in a fore-arc basin (Hou et al. Reference Hou, Mou, Wang, Tan, Ge and Wang2018b).
6. Conclusion
Based on the petrographic and geochemical compositions of the sandstones from the Angzanggou Formation in the North Qilian Belt, the following conclusions can be drawn.
The CIA indicated that the intensity of weathering in the Angzanggou Formation was moderate. The SiO2/Al2O3 ratio value, the ICV and Th/Sc versus Zr/Sc discrimination diagram suggested that the compositional maturity and degree of recycling were moderate to low.
The petrography and geochemistry of the rocks of the Angzanggou Formation provide a strong tool to unravel the tectonic position of the North Qilian Belt during the Early Silurian period. Sedimentation was dominated by detritus from the Central Qilian Belt magmatic arc, and a sedimentary cover overlaid the arc. All of this implies that the rocks of the Angzanggou Formation came from a continental arc zone, suggesting that the sandstones of the Angzanggou Formation were formed in a fore-arc basin.
Acknowledgements
This study is financially supported by the Project support by the National Natural Science Foundation of China (NO.41772113). We thank the journal reviewers for their very constructive and helpful comments, which helped to improve the manuscript.