Introduction
Older adults constitute a growing segment of the population in Europe. In Spain, adults aged 60 years and over represent 20.8% of the total population, estimated to increase to 31.4 % by 2025 (World Health Organization, 2002). Increasing age is often associated with deterioration in physical and mental health and decreasing functional ability (Robine and Michel, Reference Robine and Michel2004). In addition, this population has other relevant characteristics, such as leaving the job market with greater dependence on social retirement benefits; the death of contemporaries, especially partners, siblings and friends; and changes in family structures and roles. These aspects do not impact equally on all individuals, and many older adults maintain a good perception of their quality of life (QoL) even though their lives could be judged to have poor quality by external observers.
QoL in older people is sometime equated with functional ability or health status. However, there are many other factors that should be assessed in order to improve the global QoL in the aging process. QoL is a dynamic interaction between external circumstances and internal perceptions of individuals (Browne et al., Reference Browne1994). Health status, residential environment, economic and social resources, relationships and support systems, and emotional well-being are factors that have been commonly linked with QoL (Brown et al., Reference Brown, Bowling and Flynn2004). Therefore, considering QoL as a dynamic construct, both objective and subjective components should be included for an appropriate assessment of global QoL.
The term “health-related QoL” is a more restricted concept, focused on the effects of illness and treatment on QoL (Ferrans et al., Reference Ferrans, Zerwic, Wilbur and Larson2005), considering the subjective perception of these effects in terms of physical, psychological and social functioning.
The World Health Organization has adopted the term “active aging” to express the process of optimizing opportunities for health, participation and security in order to enhance QoL of older people (World Health Organization, 2002). In this sense, politicians and researchers have increased their interest in the measurement of QoL in older adults in order to develop policies to prevent or delay chronic medical conditions, extend the life span, provide social support when required, and allow old people to age at home with autonomy and independence. However, if aging is considered a positive experience, longer life must be accompanied by opportunities for health, participation and security; taking into consideration the real needs, capacities and preferences of older people. Thus, a better understanding of factors that influence QoL in older adults is needed.
The survey “Quality of Life in Older adults-Spain” (“Calidad de Vida en Mayores-España”, CadeViMa-Spain) is aimed at: (1) obtaining information about objective and subjective determinants of global QoL in community-dwelling older adults residing in Spain; and (2) offering elements for analyses from the point of view of older people, which may help to define social and health policies aimed at procuring a good QoL in the older adult population.
This paper aims to present the overall description of the survey, its methodology, sociodemographic characteristics of the sample, and reliability indices of the measures used. This descriptive information will help researchers in using the survey data to further explore research questions about quality of life in older adults.
Methods
Participants and procedure
A cross-sectional design was used on a sample of community-dwelling older adults. A nationally representative sample made up of 1106 adults residing in Spain aged 60 years and over was selected from the total population of this age (9,812,307 individuals according to Official Population Figures of the Municipal Register on December 2007; Instituto Nacional de Estadistica, 2007). The allowable error was ± 3.5% for a confidence level of 95%.
A geodemographically based proportional multistage stratified sampling was employed in order to improve representativeness. The first-stage sampling unit was proportional sampling according to Spain's autonomous communities (14 groups) and town population size (seven groups) to assure that all individuals had an equal probability of being selected; the second-stage sampling unit was quota sampling of gender and age (three groups). The final sample resulted in a proportional sample by sex, age and geographic location.
The inclusion criteria were: (1) men and women aged 60 years or older; (2) community-dwelling; (3) gave informed consent to participate in the survey; and (4) who were able to answer the survey questions. Ability to answer the survey was explored using the Short Portable Mental Status Questionnaire (SPMSQ), which is a brief screening test to detect the presence and degree of intellectual impairment (Pfeiffer, Reference Pfeiffer1975). Bearing in mind that individuals with more than four errors in SPMSQ might have impaired ability to answer self-assessment questions, a total of 51 individuals (4.4% of the initial sample) were excluded. Individuals who failed to meet inclusion criteria were replaced by others from the same sampling stratum.
The survey was designed as a home-based questionnaire, and was conducted through face-to-face semi-structured interviews that took 40 minutes on average. The data collection was carried out in 2008 by a consulting company specializing in health surveys, and supervised by the researchers. All questionnaires were coded numerically, recorded in an electronic database via the double-key data entry method, and checked for errors to ensure data quality. The study was approved by the Ethics Committee of the Carlos III Institute of Health, and written informed consent was obtained from all respondents.
Measures
We designed the CadeViMa-Spain questionnaire based on objective and subjective indicators of QoL dimensions. To develop the questionnaire, we performed a comprehensive review of the literature about QoL and aging, and considered the main QoL domains obtained from a previous QoL survey in older adults living in the province of Madrid (Fernandez-Mayoralas et al., Reference Fernandez-Mayoralas2007).
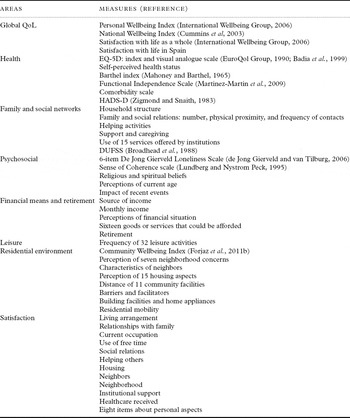
The following aspects were measured using validated scales: subjective well-being, health-related QoL, health status (functional ability, functional independence, comorbidity, and depression), social support, sense of coherence, and loneliness. Validated scales were combined with specific questions focusing on the aspects of QoL relevant in older adults. Table 1 lists the measures included in the CadeViMa-Spain survey.
Measures included in CadeViMa-Spain survey

HADS-D = Hospital Anxiety and Depression Scale–Depression subscale; DUFSS = Duke-UNC Functional and Social Support.
Sociodemographic characteristics
Information about the following sociodemographic characteristics was collected: sex; age in years; marital status; education level; employment status (such as working, retired, etc); profession according to the national classification of occupations (Instituto Nacional de Estadistica, 2007); occupational status in 14 response categories (such as smallholding farmer, management with five or fewer subordinates, unskilled manual worker, etc); and town population size.
Global QoL measures
To assess the individual's perspective about their QoL, respondents were asked to nominate, in order, the five aspects that they considered contributed most to the overall quality of their lives. To measure well-being at different levels, the Personal Wellbeing Index (PWI), and National Wellbeing Index (NWI) were included.
The PWI measures subjective wellbeing through questions of satisfaction directed at personal feelings. The original PWI scale comprises seven items of satisfaction, relating to QoL domains. An item of spirituality/religion was added later (International Wellbeing Group, 2006). Although we included the eight items, the PWI total score was based on the original seven items (Rodriguez-Blazquez et al., Reference Rodriguez-Blazquez2010). As recommended, we also asked about satisfaction with “life as a whole” prior to the PWI items (International Wellbeing Group, 2006).
The NWI inquires about satisfaction with aspects relating to the current situation of the country where people live (Cummins et al., Reference Cummins, Eckersley, Pallant, van Vugt and Misajon2003). We included an additional item to assess global satisfaction with life in Spain.
The PWI and NWI items are scored on an 11-point Likert-type scale from 0 (completely dissatisfied) to 10 (completely satisfied), where 5 represents the neutral point (neither satisfied nor dissatisfied). Each index is represented by the mean values of items once transformed into a percentage of the maximum possible score; therefore, the total score range is 0–100. The PWI and NWI were found to be valid and reliable measures in validation studies with this same sample (Rodriguez-Blazquez et al., Reference Rodriguez-Blazquez2010; Forjaz et al., Reference Forjaz2011a).
Health measures
The EQ-5D is a standardized instrument of health-related QoL and health status (EuroQol Group, 1990). The following EQ-5D measures were taken: the EQ-5D descriptive system converted into a single index by the trade-off method, with a theoretical possible range of –1.00 to 1.00 (Badia et al, Reference Badia, Montserrat, Roset and Herdman1999); the visual analogue scale (EQ-VAS), from 0, worst imaginable health state, to 100, best imaginable health state; and question about health state today compared with health state in the past 12 months, with three response categories (1, better; 2, much the same; and 3, worse). Normative values for the Spanish population are available (Badia et al., Reference Badia, Roset, Herdman and Kind2001). A self-perceived health status measure was also used with five response categories, from 1, very bad, to 5, very good.
Concerning functional ability, we included two scales: (1) The Barthel Index (Mahoney and Barthel, Reference Mahoney and Barthel1965), a commonly used measure of functional ability, thus allowing comparisons with other population groups; and (2) the Functional Independence Scale (FIS), which was specifically created to assess the degree of functional independence in the non-institutionalized older population (Martinez-Martin et al., Reference Martinez-Martin2009).
The Barthel Index (Mahoney and Barthel, Reference Mahoney and Barthel1965) is a 10-item measure of functional ability of the person in the performance of activities in daily living. The total score ranges from 0 (completely dependent) to 100 (completely independent).
The FIS measures functional independence in several activities of daily living (Martinez-Martin et al., Reference Martinez-Martin2009). Each activity has the following response categories: can do it without help, needs help to do it, and cannot do it and someone does it for you. An additional response category – has never done it – is considered for the activities of household duties. This scale was designed and validated for community-dwelling older adults in Spain. Higher scores indicate greater functional independence.
In case respondents needed help from someone for at least one FIS item, the following was asked: the first and second person who helped them most (family members, neighbors, friends, paid helpers, social services); the frequency of received help (from 1, occasionally to 4, daily); and the satisfaction with the support received (0–10 satisfaction scale). In addition, we asked about the age when respondents began to need help for each of the FIS items marked as needing help.
The Comorbidity Scale, adapted from the Cumulative Illness Rating Scale for Geriatrics (Miller et al., Reference Miller1992; Martinez-Martin et al., Reference Martinez-Martin2009) measures the number of self-reported chronic medical conditions. This scale inquires about the presence of 20 chronic medical conditions, and includes one open option, “others”. For each medical condition reported, we also asked whether respondents received any treatment or aid (such as wheelchairs, crutches, incontinence pads, etc).
The depression subscale of the Hospital Anxiety and Depression Scale (HADS-D) is a brief self-report measure developed to screen depression states in non-psychiatric patients (Zigmond and Snaith, Reference Zigmond and Snaith1983). It consists of seven items referring to the past week, rated on a 0 to 3 Likert-type scale. Scores of 7 or less are considered non-cases; 8 to 10 are doubtful cases; and 11 or higher indicate depression states.
Family and social networks measures
Concerning the household structure, we asked where the respondent lived (own house, at a child's or relative's, other); the number of persons living in the household and their kinship, age and gender; and presence of pets at home. Moreover, we inquired about the preference of different forms of residence in the future (seven possibilities including living at own home and moving in with family members).
Family and social relations were considered by inquiring about the number of family member and friends, the physical proximity to the respondent (such as the same house, the same city, another country, etc), and the first and second person with whom they were most intimate. Moreover, we asked about the frequency of contacts (face-to-face and others) with family, friends and neighbors (rated from 1, occasionally, to 4, daily). Respondents were asked if they helped others outside their home (exploring six activities of daily living) and how frequently they engaged in helping activities in general (from 1, occasionally, to 4, daily).
Concerning support and caregiving networks, we asked if the respondent received help at home from paid caregivers or social services. The use of 15 services offered by institutions was surveyed; the response categories were: uses currently; does not use but has applied for it; does not use because does not know about it; no need; does not use for other reasons. Respondents were also asked about use of health services.
The Duke-UNC Functional Social Support (DUFSS) measures the individual's perception of the amount and type of personal social support (Broadhead et al., Reference Broadhead, Gehlbach, de Gruy and Kaplan1988). It is made up of 11 items, answered on a 5-point scale. Since the original factorial structure is not consistent in the Spanish validation studies (de la Revilla Ahumada et al., Reference de la Revilla Ahumada, Bailon, de Dios Luna, Delgado, Prados and Fleitas1991; Bellon Saameno et al., Reference Bellon Saameno, Delgado Sanchez, Luna del Castillo and Lardelli Claret1996), we reported the 11-item total scale score.
Psychosocial measures
The six-item de Jong Gierveld Loneliness Scale measures loneliness in terms of its emotional and social components (de Jong Gierveld and van Tilburg, Reference de Jong Gierveld and van Tilburg2006). It comprises six items, answered in three response categories: yes; more or less; and no. The total loneliness scale ranges from 0 (not lonely) to 6 (extremely lonely), and can be categorized as not lonely (0 and 1), and lonely (2 to 6).
The Sense of Coherence scale (SOC) measures the personal view of life and capacity to respond to stressful situations. We used the short version of the SOC scale (three items) (Lundberg and Nystrom Peck, Reference Lundberg and Nystrom Peck1995), rated on a 3-point rating scale. The total score range is 0–6, where a higher value indicates a lower sense of coherence.
Religious and spiritual beliefs also were assessed through four statements scored on a Likert-type scale from 1 (completely disagree) to 5 (completely agree). Also, we asked about their personal perceptions of their current age (feeling younger, older or the same actual age), and if recent events in their life impacted positively, negatively or had no impact on their QoL.
Financial means and retirement measures
To assess financial means the following aspects were asked about: source of income (wage, pensions, rental property, etc); and monthly income in five response categories. To obtain complementary economic information we also asked about personal perceptions of household economic status rated from 0 (very poor) to 10 (very rich); satisfaction with financial means from 0 (completely dissatisfied) to 10 (completely satisfied); sense of security in terms of financial future from 0 (completely insecure) to 10 (completely secure); and 16 items about goods or services that could be afforded.
Additionally, CadeViMa-Spain survey included questions about retirement such as what the retirement age should be; and the influence of retirement on the QoL rated from 1 (gets much worse) to 5 (greatly improves). If retirement was the current occupation status, respondents were asked their age on retirement and their experience of this stage of life (1, positive stage; 2, neutral; 3, period of emptiness).
Leisure and social participation measures
To assess the use of free time, respondents were asked about 32 leisure activities, grouped into physical, passive (such as watching TV), cultural, social (such as membership in voluntary associations), and travel for leisure. For each activity, several aspects were assessed: the frequency with which respondents engaged in these activities (from 1, never, to 5, daily); current frequency compared with 10 years ago (more, equal, or less than before); activities performed 10 years ago and not now (yes/no); and the three main activities respondents would like to perform now and into the future.
Residential environment measures
The aspect of the residential environment was approached by taking into account four components: community, neighborhood, neighbors and housing. The Community Wellbeing Index (CWI) inquires about satisfaction with the local place of residence (Forjaz et al., Reference Forjaz2011b). It is made up of 10 items rated on an 11-point Likert-type scale from 0 (completely dissatisfied) to 10 (completely satisfied), and grouped into three subscales: community services, community attachment, and physical and social environment. Each subscale is expressed in logit scores, derived from Rasch analysis, and converted into a 0–100 lineal measure scale. Also, we asked about satisfaction with life in general in their place of residence using the same 11-point response scale.
A five-point Likert-type scale from 1 (completely disagree) to 5 (completely agree) was used to ask about the respondent's perception of neighborhood concerns, characteristics of neighbors, and aspects of their housing, (7, 5 and 15 items, respectively). One question inquired about how long, in minutes, respondents took to get to several community facilities (11 items). We asked about the presence of physical barriers and facilitators; number of years living in the same home and neighborhood; home ownership status; and if respondents were planning to adapt their house to remove physical barriers. Also, we inquired about the presence of five facilities in the building and 19 appliances or services at home.
Concerning residential mobility, the respondents were asked if they had changed residence since turning 60 years old. If answered affirmatively, we asked the city, province and country of their former residence; whether they had returned to their own or partner's birthplace; the three main reasons for moving; and if by moving their QoL had improved, remained the same or deteriorated. Moreover, we asked about plans of moving residence for the coming years. If respondents were planning to move, they were asked about the destination (same city, birthplace, nursing home, etc); the three main reasons; and if they considered that by moving their QoL would improve, remain the same or deteriorate.
Other satisfaction measures
The same 11-point response scale used for the PWI and NWI was also used for asking respondents about their satisfaction with the following issues: living arrangements; relationships with partner, sons/daughters, and others family members; current occupation; use of free time; social relations; helping others; housing; neighbors; neighborhood; institutional support; healthcare received in different health services; and eight items about satisfaction with personal aspects (ability to make decisions, freedom of expression, winning respect of others, social position and recognition, appearance, satisfaction with themselves, ability to cope with stressful situations, and self-confidence).
At the end of the questionnaire, an additional item about satisfaction with “life as a whole” was included to evaluate the effect that the questionnaire items might have in the respondent's subjective assessment after having completed it. Finally, we asked about their willingness to continue participating with this investigation in the future as part of a longitudinal study.
Data analysis
Descriptive statistics were applied to describe the respondents' characteristics according to the presented measures. For the FIS, HADS-D, and SOC scales, when there were two or fewer values missing per scale, items with missing values were replaced, for each respondent, by the scale mean. To impute missing values of monthly income, this variable was transformed into a continuous one by assigning the class marks from categorical intervals of the initial variable. Then, the missing values were estimated through a general linear model, using the number of goods or services that could be afforded. Spearman's ρ was used for correlation analyses.
In order to group items of specific aspects for which there were no previously validated scales, we performed principal components factor analyses with varimax rotation. Cronbach's α coefficients were used to assess internal consistency of the scales, except from CWI subscales, which were measured through the Person Separation Index (Forjaz et al., Reference Forjaz2011b). All analyses were conducted using the PASW Statistics 18.0 software for Windows.
Results
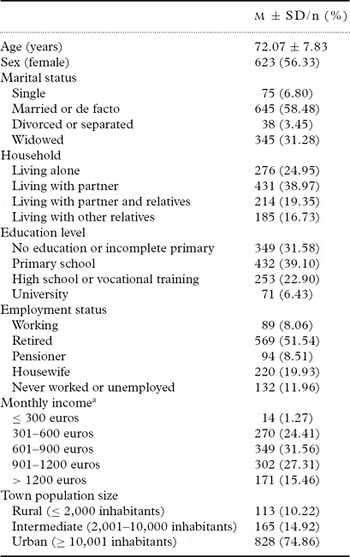
Descriptive statistics of the sociodemographic characteristics are shown in Table 2. Information supplementing the information displayed in the tables is described below.
Sociodemographic characteristics (n = 1106)

a Missing values (30.1%) were estimated through a general linear model, using the number of goods or services that could be afforded
M ± SD = mean ± standard deviation.
Global QoL measures
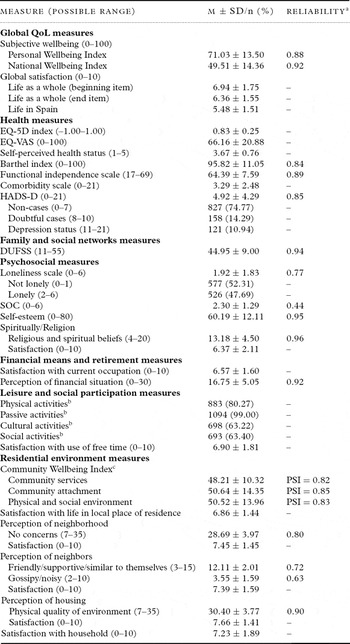
The five aspects considered by respondents as contributing most to their QoL were: health (91.50%), children (78.48%), financial status (60.22%), spouse or partner (53.16%), and other family members (43.58%). Descriptive statistics of global QoL are presented in Table 3. From the two items addressing “satisfaction with life as a whole”, the second showed a higher correlation with PWI than the first (r = 0.50 and 0.43, respectively, p < 0.001).
Descriptives and reliability of global QoL, health, psychosocial, residential environment, and leisure measures (n = 1106)

a For reliability, Cronbach's α is presented excepted when indicated.
b Performance of at least one activity, once or more times a week.
c Scores derived from Rasch analysis.
M ± SD = mean ± standard deviation; QoL = Quality of Life; PSI = Person Separation Index; VAS = Visual Analogue Scale; HADS-D = Hospital Anxiety and Depression Scale – Depression subscale; DUFSS = Duke-UNC Functional Social Support; SOC = Sense of Coherence.
Health measures
In general, the results of health measures indicated a good health state (Table 3). Most people (71.58%) rated their current health state as the same as in the past 12 months. According to the FIS, 22.60% of respondents needed help with at least one activity, which was given in most cases by a daughter (65.20%). The age at which they began to need help was 70.62 ± 10.62 years, and 60.80% of cases received help on a daily basis. Satisfaction with received support was 8.11 ± 1.74 on a 0–10 scale.
The majority of respondents reported having at least one chronic medical condition (89.42%), of whom 93.22% received some treatment, and 23.28% used some help. The three most frequently reported conditions were: bone and joint problems (53.35%); arterial hypertension (39.87 %); and sight problems (29.02%).
The health services reported as most frequently used were primary care physicians (92.19 %). The satisfaction with these services, on a 0–10 rating scale, ranged between 7.62 ± 1.85 (emergency services) and 7.95 ± 1.63 (hospitalization).
Family and social networks measures
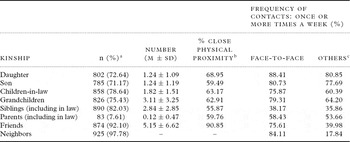
Descriptives and reliability of the DUFSS are presented in Table 3, and family and social relations are presented in Table 4. Almost all respondents (91.37%) had some relative living in the same housing, building or neighborhood. Respondents reported high levels of satisfaction with relatives and friends, and were most satisfied with children (8.92 ± 1.46,on a 0–10 satisfaction scale). Almost one-third (30.23%)of respondents helped others outside their home; the activity most frequently reported (22.17%) was caring for grandchildren. Most engaged in these activities one or more times a week (59.38%).
Family and social relations

a Percentages calculated from the total number of responses for each row, after excluding missing values.
b People who live in the same neighborhood, building or housing of the respondents.
c Telephone, emails, short message service, postal mail.
M ± SD = mean ± standard deviation.
Less than 5% of respondents reported using each of the listed social services offered by institutions, except for holiday services (9.28%). The main reason for not using the social services was “no need” (76.90–94.35%).
Psychosocial measures
Descriptives and the reliability of the Loneliness Scale and SOC are presented in Table 3. According to factor analysis, the four items of religious and spiritual beliefs were grouped in a single factor explaining 89.76% of variance. Factor analysis of items of satisfaction with personal aspects grouped eight items under one factor (self-esteem), which explained 72.47% of total variance. Moreover, almost two-thirds of respondents (65.58%) felt they were as old as their actual chronological age. Most (85.43%) considered that recent events had no impact on their QoL.
Financial means and retirement measures
The perception of household economic status, satisfaction with financial means, and sense of security in terms of financial future were grouped in factor analysis under one factor (perception of financial situation), which explained 86.66% of total variance (Table 3). The respondents reported that they could afford 5.81 ± 4.39 goods or services from a list of 16 items.
The ideal retirement age reported by respondents was 62.34 ± 3.62 years. For most, retirement was perceived as improving their QoL. Of the retired respondents (51.54%), most said that their retirement age had been 65 years (50.79%), and 48.75% reported this stage of life to be a positive experience.
Leisure and social participation measures
The number of respondents who reported performing at least one of each type of leisure activity (physical, passive, cultural or social), at least once a week, is presented in Table 3. The activities most frequently reported (performed by over 50% of the sample, at least once a week) were: watching TV, 97.38%; listening to the radio, 82.07%; city walk, 70.08%; and reading newspapers or magazines, 59.64%. The three most frequently reported activities performed 10 years ago and not now were: travelling, 12.48%; going to movies, 10.58%; and nature walks, 10.13%. These activities were also most frequently reported as the three main activities respondents would like to perform in the future.
Residential environment measures
The respondents reported that they had been living 37.13 ± 19.75 years in the same home, and 49.93 ± 22.57 years in the same neighborhood. The ownership status most frequently reported was fully paid home (83.82%). Most lived in their own house (93.58%); and if they needed help in the future, most would prefer to continue living in their own home (87.16%).
Over 98% of the sample had the following systems or appliances at home: toilet, air/water heating system, washing machine, refrigerator, television, and radio. The three least frequently owned appliances and services were: dishwasher (31.58%), computer (24.55%), and Internet connection (16.42%). Half of the respondents (50.14%) had a car, and 16.96% had a second or summer residence.
The percentage of people reporting the presence of physical barriers was: stairs inside the home, 30.20%; stairs inside the building, 55.17%; and stairs to access the building, 25.05%. The presence of facilitators to climb the stairs inside the home, stairs inside the building, and stairs to access the building was reported by 15.45%, 42.90 %, and 18.28% of the sample, respectively. Only 3.06% of the respondents were planning to adapt their house to remove physical barriers.
Regarding facilities in the building, the respondents reported having an elevator (38.71%), private car park (19.31%), and green spaces (18.96%). The following community facilities were less than a five-minute walk away for most respondents: bars, cafes, and restaurants (for 72.46% of the respondents); convenience stores (70.49%); green spaces (57.58%); and public transportation (56.70%).
Three factor analyses were performed to measure, respectively, the respondents' perceptions of their housing, neighborhood, and neighbors. Seven items related to the physical quality of the housing environment were grouped in one factor, explaining 63.39% of the variance. Seven items about neighborhood concerns formed one factor (45.44% of the variance). Five items about neighbors were grouped into two factors, explaining 68.40% of the variance. Descriptives and Cronbach's α of these measures are shown in Table 3.
In terms of residential mobility, 98.36% had not planned on moving residence in the coming years, and 11.31% of the respondents said they had changed residence after the age of 60; of these, 75.41% said this had improved their QoL.
Relationship between measures
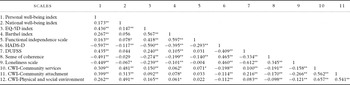
Table 5 shows the correlation matrix between the validated scales included in the survey. Global QoL, as measured by PWI, was mainly correlated with depression and sense of coherence. In addition, an increased health-related QoL, as measured by EQ-5D, was negatively related to depression, and positively associated with functional ability, among others.
Spearman's rank correlation coefficient between validated scales included in CadeViMa-Spain survey.

*p< 0.05; **p<0.01.
HADS-D = Hospital Anxiety and Depression Scale–Depression subscale; DUFSS = Duke-UNC Functional and Social Support; CWI = Community Wellbeing Index.
Discussion
To increase our knowledge of QoL of community-dwelling older adults, taking into consideration the multidimensional and complex nature of the QoL construct, the CadeViMa-Spain included a wide list of measures, incorporating validated scales, and covering objective and subjective indicators in a nationally representative survey.
There are several studies focusing on social and health aspects of older adults in Spain that include QoL scales (Azpiazu Garrido et al., Reference Azpiazu Garrido, Cruz Jentoft, Villagrasa Ferrer, Abanades Herranz, Garcia Marin and Alvarez De Mon Rego2003; Perez-San-Gregorio et al., Reference Perez-San-Gregorio, Martin-Rodriguez, Perez-Bernal and Maldonado2010). Longitudinal studies on aging have also been carried out (Zunzunegui et al., Reference Zunzunegui, Nunez, Durban, Garcia de Yebenes and Otero2006). A few surveys that have been conducted have focused on overall QoL of older populations in Spain (Fernandez-Ballesteros et al., Reference Fernandez-Ballesteros, Zamarron and Marcia2006; Fernandez-Mayoralas et al., Reference Fernandez-Mayoralas2007; Rojo-Perez et al., Reference Rojo-Perez, Fernandez-Mayoralas, Rodriguez-Rodriguez, Prieto-Flores and Rojo-Abuin2007a). However, this survey explores the QoL of older adults in a very comprehensive way.
In addition, there are other specific QoL questionnaires. The Brief Questionnaire of QoL (CUBRECAVI) allows a quick scan of the most important components of QoL in aging (Fernandez-Ballesteros et al., Reference Fernandez-Ballesteros, Zamarron and Marcia2006) and is based on a multidimensional concept of QoL. It inquires about the subject's own preferences regarding the most valued components of QoL, and assesses global QoL. The Fumat scale of QoL takes into account the multidimensionality of the concept, has been shown to be appropriate for older adults (Gomez et al., Reference Gomez, Verdugo, Arias and Navas2008), was designed for people who use social services; and it has been presented as an objective instrument to be completed by social services professionals (proxies).
The CadeViMa-Spain survey has several strengths. It was specifically designed for community-dwelling older adults and was based on the research team's experience in population studies of QoL in this age group. A strong point is the great variety of measurements included, making it possible to assess QoL holistically and in a reliable way. The reliability of measures was above 0.70, except for SOC and perception of their neighbors (gossipy/noisy), which might be due to the small number of items included.
In general, descriptive results indicate that the respondents declared high levels of satisfaction with global QoL and with the different aspects assessed. Our sample reported, on average, a good self-perceived health status. A previous study of the general population in Spain reported that 44.5% of the adults aged over 64 years perceived their health as good or very good (Instituto de Mayores y Servicios Sociales, 2009). That same study reported that 31.9% needed help to perform activities of daily living. This figure is relatively close to the one found in our study (22.6%), considering that our sample includes people aged 60 years and older. Likewise, the most reported medical conditions coincided in both studies: arthritis (Instituto de Mayores y Servicios Sociales, 2009) or bone problems (present study); followed by arterial hypertension. Other findings were consistent with previous studies. “Health” was mentioned as the factor contributing most importantly to overall QoL in a sample of older adults living in the Madrid region (Fernandez-Mayoralas et al., Reference Fernandez-Mayoralas2007). The mean value of the EQ-VAS in our sample falls within the range of mean values reported for several studies in Spain, 60.6–69.9 (Azpiazu Garrido et al., Reference Azpiazu Garrido, Cruz Jentoft, Villagrasa Ferrer, Abanades Herranz, Garcia Marin and Alvarez De Mon Rego2003). Moreover, the sociodemographic characteristics of our sample were similar to those presented by the official Institute for Older Adults and Social Services (Instituto de Mayores y Servicios Sociales, 2009) and by the National Population and Housing Census (Rojo-Perez et al., Reference Rojo-Perez, Fernandez-Mayoralas, Rodriguez-Rodriguez, Rojo-Abuin, Mollenkopf and Walker2007b).
There are four limitations that need to be acknowledged. First, the cross-sectional design prevents us from making inferences about causality. Second, this survey includes only community-dwelling older adults who were able to complete self-assessment measures. Therefore, the results should not be generalized to older people with special life conditions, such as having cognitive impairments or living in nursing homes. Third, we did not use observational procedures of residential environmental conditions or a medical records review: all the information about both subjective aspects and objective conditions was reported by the surveyed participants. This is a commonly used and direct method for assessing QoL. In addition, agreement between self-report and medical record review has been found for some medical conditions in older people (Kriegsman et al., Reference Kriegsman, Penninx, Van Eijk, Boeke and Deeg1996). However, some authors have argued the need to use subjective and objective measures (Noll, Reference Noll, Hagerty, Vogek and Moller2002; Fernandez-Ballesteros and Santacreu-Ivars, Reference Fernandez-Ballesteros, Santacreu-Ivars, Stone and Blouin2010). Fourth, meeting the survey's objectives, which would call for multivariate analysis, fell beyond the scope of this paper. Instead, this paper focuses on presenting the methods and descriptives.
Extended analyses of the information obtained from this survey, based on the perspective of older people themselves, can contribute to improving knowledge about the factors influencing the QoL of older adults, how these are associated, and the probable variations between groups. The representativeness of the sample allows conclusions to be drawn about these aspects in community-dwelling older adults in Spain.
To conclude, this survey provides comprehensive and useful information to: (1) increase knowledge about the QoL in older adults, in order to better plan health and social services towards promoting active aging, and aging at home in Spain; (2) assess the psychometric properties of the included scales; (3) establish comparisons with other population groups, such as people living in residential care settings; (4) allow benchmarking with other countries; and (5) draw comparisons with the Longitudinal Study on Ageing in Spain (ELES), a research project that will consider the demographic background, psychosocial aspects, health, economy, and family and social environment (see http://proyectoeles.es/). The CadeViMa-Spain database is available to other researchers upon request to the first author.
Conflict of interest
None.
Description of authors' roles
Gloria Fernandez-Mayoralas coordinated the study, designed the survey and reviewed the paper for important conceptual content. Carolina Giraldez-Garcia performed the statistical analysis and wrote the paper. Maria João Forjaz was the co-principal coordinator of the study, designed the survey, assisted with analysis statistical and with writing the paper, and reviewed the paper for important conceptual content. Fermina Rojo-Perez designed the survey and reviewed the paper for important conceptual content. Pablo Martinez-Martin designed the survey and reviewed the paper for important conceptual content. Maria-Eugenia Prieto-Flores assisted with writing and reviewed the paper for important conceptual content.
Acknowledgments
This research was supported by the Spanish Ministry of Science and Innovation (National R&D&I Plan: ref. SEJ2006-15122-C02-00).
Members of the Spanish Research Group on Quality of Life and Ageing is made up as follows: (1) at the Spanish National Research Council by Gloria Fernandez-Mayoralas, Fermina Rojo-Perez, Karim Ahmed-Mohamed and Raul Lardies-Bosque; and (2) at the Carlos III Institute of Health by M. Joao Forjaz, Pablo Martinez-Martin, Maria-Eugenia Prieto-Flores, Belen Frades-Payo, Carmen Rodriguez-Blazquez, Concepcion Delgado-Sanz, and Alba Ayala.
The Carlos III Institute of Health team is a member of the Consortium for Biomedical Research in Neurodegenerative Diseases (Centro de Investigación Biomédica en Red sobre Enfermedades Neurodegenerativas – CIBERNED).