Introduction
Bipolar disorder (BD) and major depressive disorder (MDD) are highly heritable mood disorders that share a complex overlapping genetic architecture (McGuffin et al. Reference McGuffin, Rijsdijk, Andrew, Sham, Katz and Cardno2003; Liu et al. Reference Liu, Blackwood, Caesar, de Geus, Farmer, Ferreira, Ferrier, Fraser, Gordon-Smith, Green, Grozeva, Gurling, Hamshere, Heutink, Holmans, Hoogendijk, Hottenga, Jones, Jones, Kirov, Lin, McGuffin, Moskvina, Nolen, Perlis, Posthuma, Scolnick, Smit, Smit, Smoller, St Clair, van Dyck, Verhage, Willemsen, Young, Zandbelt, Boomsma, Craddock, O'Donovan, Owen, Penninx, Purcell, Sklar and Sullivan2011; Schulze et al. Reference Schulze, Akula, Breuer, Steele, Nalls, Singleton, Degenhardt, Nöthen, Cichon, Rietschel and McMahon2014). Close relatives of BD patients are also at greater risk of developing other major psychiatric conditions, in particular MDD (Shih et al. Reference Shih, Belmonte and Zandi2004). A substantial proportion of the heritability for mood disorders is explained by a polygenic component where many alleles of individually small effect sizes confer risk to BD and MDD in aggregate. Other factors, however, also contribute to risk, including stressful life events in childhood and personality traits such as higher neuroticism and lower extraversion (Kendler et al. Reference Kendler, Gatz, Gardner and Pedersen2006).
Both BD and MDD are disorders of emotion regulation and are characterized by episodic elevation and/or depression of mood. Difficulties with mood regulation in these disorders are likely to derive from disturbances in neural systems mediating emotion processing. Neuroimaging studies in patient groups indicate abnormalities in components of the cortico-limbic network, with particular emphasis on altered structure and function of the amygdala, hippocampus and cingulate cortex (Phillips et al. Reference Phillips, Drevets, Rauch and Lane2003; Hajek et al. Reference Hajek, Kopecek, Kozeny, Gunde, Alda and Höschl2009; Savitz & Drevets, Reference Savitz and Drevets2009; Bora et al. Reference Bora, Fornito, Pantelis and Yucel2012; Sacher et al. Reference Sacher, Neumann, Funfstuck, Soliman, Villringer and Schroeter2012). Models propose either a loss or reduction of higher-order cognitive control by prefrontal regions over the amygdala, or conversely a hyperactive limbic network overriding this cortical control (Phillips et al. Reference Phillips, Drevets, Rauch and Lane2003).
The majority of neuroimaging studies in mood disorder have, however, been conducted on patients with longstanding illness. A number of studies have, however, begun to examine structural neuroimaging features in familial high-risk populations, both in BD and MDD (Hajek et al. Reference Hajek, Kopecek, Kozeny, Gunde, Alda and Höschl2009; Baare et al. Reference Baare, Vinberg, Knudsen, Paulson, Langkilde, Jernigan and Kessing2010; Chen et al. Reference Chen, Hamilton and Gotlib2010; Amico et al. Reference Amico, Meisenzahl, Koutsouleris, Reiser, Moller and Frodl2011; Karchemskiy et al. Reference Karchemskiy, Garrett, Howe, Adleman, Simeonova, Alegria, Reiss and Chang2011; Bechdolf et al. Reference Bechdolf, Wood, Nelson, Velakoulis, Yucel, Takahashi, Yung, Berk, Wong, Pantelis and McGorry2012; Alemany et al. Reference Alemany, Mas, Goldberg, Falcon, Fatjo-Vilas, Arias, Bargalló, Nenadic, Gastó and Fañanás2013; Kelley et al. Reference Kelley, Chang, Garrett, Alegría, Thompson, Howe and Reiss2013; Eker et al. Reference Eker, Simsek, Yilmazer, Kitis, Cinar, Eker, Coburn and Gonul2014; Romanczuk-Seiferth et al. Reference Romanczuk-Seiferth, Pohland, Mohnke, Garbusow, Erk, Erk, Haddad, Grimm, Tost, Meyer-Lindenberg, Walter and Wüstenberg2014). However, a consensus of findings has yet to emerge, with some studies reporting increases in volume of cortico-limbic structures, some reporting decreases or no change. Some inconsistency may relate to the cross-sectional nature of the studies and issues relating to the timing of sampling in relation to overall risk trajectories, along with other methodological differences.
There is also a relative paucity of studies examining neuroprogressive change, its relationship with changing features of illness, and in particular during early phases of illness development. It is unclear therefore whether structural abnormalities reported in patient groups are confounded by secondary effects of long-term illness or medication. Similarly, the timing of the onset of these abnormalities and how trait-related features and neurobiology change over the early course of illness development remain uncertain. These are critical issues from a clinical perspective for informing predictive models of risk, and are the focus of the current study.
The Scottish Bipolar Family Study (BFS) is a prospective longitudinal imaging study examining young individuals (16–25 years) at high familial risk of mood disorder, along with a group of healthy controls with no family history, with the aim of addressing the above issues (Whalley et al. Reference Whalley, Sussmann, Chakirova, Mukerjee, Peel, McKirdy, Hall, Johnstone, Lawrie and McIntosh2011). In previous imaging studies on this sample at baseline, when all individuals were unaffected, we reported abnormal amygdala function during an executive processing task in the high-risk group v. controls (Whalley et al. Reference Whalley, Sussmann, Chakirova, Mukerjee, Peel, McKirdy, Hall, Johnstone, Lawrie and McIntosh2011), along with abnormal cortico-limbic white matter connections (Sprooten et al. Reference Sprooten, Sussmann, Clugston, Peel, McKirdy, Moorhead, Anderson, Shand, Giles, Bastin, Hall, Johnstone, Lawrie and McIntosh2011). Activation of the amygdala was also found to be related to cumulative genetic risk for BD using polygenic risk profiling (Whalley et al. Reference Whalley, Papmeyer, Sprooten, Romaniuk, Blackwood, Glahn, Hall, Lawrie, Sussmann and McIntosh2012). Other studies have also reported findings of altered cortico-limbic structure or function in unaffected relatives of mood disorder patients (Levesque et al. Reference Levesque, Beauregard, Ottenhof, Fortier, Tremblay, Brendgen, Pérusse, Dionne, Robaey, Vitaro, Boivin and Booij2011; Mannie et al. Reference Mannie, Filippini, Williams, Near, Mackay and Cowen2014; Miskowiak et al. Reference Miskowiak, Glerup, Vestbo, Harmer, Reinecke, Macoveanu, Siebner, Kessing and Vinberg2015). In terms of neurodevelopmental trajectory, therefore, these findings begin to suggest that cortico-limbic abnormalities are not restricted to established illness, nor are they related to confounding effects of medication, and indeed may be related to the overall burden of genetic risk variants. Whether these abnormalities can distinguish those at greatest risk for illness, how they change over the course of illness development, or how they relate to other non-genetic risk factors for illness, have yet to be fully determined.
Over the course of the BFS a number of individuals have developed a mood disorder, predominantly MDD [defined as meeting formal diagnostic criteria, Diagnostic and Statistical Manual of Mental Disorders, 4th edition (DSM-IV)]. How these limbic abnormalities develop over early phases of illness has, however, yet to be fully addressed (Whalley et al. Reference Whalley, Sussmann, Romaniuk, Stewart, Papmeyer, Sprooten, Hackett, Hall, Lawrie and McIntosh2013; Papmeyer et al. Reference Papmeyer, Giles, Sussmann, Kielty, Stewart, Lawrie, Whalley and McIntosh2015). The current study therefore reports longitudinal structural imaging findings using the most up-to-date clinical information on the BFS participants (from time 3; T3). We utilized voxel-based morphometry approaches to examine prospective longitudinal structural changes over time to inform markers of risk of mood disorder (MDD). Based on previous findings (Hajek et al. Reference Hajek, Kopecek, Kozeny, Gunde, Alda and Höschl2009; Bora et al. Reference Bora, Fornito, Pantelis and Yucel2012; Sacher et al. Reference Sacher, Neumann, Funfstuck, Soliman, Villringer and Schroeter2012), we hypothesized that there would be grey matter loss in the amygdala, hippocampus, anterior cingualate cortex and prefrontal grey matter in those at high familial risk who develop illness v. those who are at high familial risk but have remained well, and v. healthy controls. Along with longitudinal structural imaging changes we also sought to test whether progress to illness was associated with changes in other potential risk markers, namely personality traits of high neuroticism and low extraversion, changes in symptoms scores and baseline measures of childhood trauma (Heim & Nemeroff, Reference Heim and Nemeroff2001; Peyrot et al. Reference Peyrot, Milaneschi, Abdellaoui, Sullivan, Hottenga, Boomsma and Penninx2014). We also examine whether any changes in brain structure could potentially be indexed using these clinically ascertained measures.
Method
Initial baseline recruitment
Baseline recruitment has been described in full previously (Sprooten et al. Reference Sprooten, Sussmann, Clugston, Peel, McKirdy, Moorhead, Anderson, Shand, Giles, Bastin, Hall, Johnstone, Lawrie and McIntosh2011; Whalley et al. Reference Whalley, Sussmann, Chakirova, Mukerjee, Peel, McKirdy, Hall, Johnstone, Lawrie and McIntosh2011; Papmeyer et al. Reference Papmeyer, Giles, Sussmann, Kielty, Stewart, Lawrie, Whalley and McIntosh2015). Briefly, at the beginning of the study (time 1, T1), individuals with a diagnosis of bipolar I disorder were identified by psychiatrists across Scotland. Diagnosis was confirmed with the OPCRIT symptom checklist (McGuffin et al. Reference McGuffin, Farmer and Harvey1991) using data from clinical notes and the Structured Clinical Interview for DSM-IV (SCID; First et al. Reference First, Spitzer, Gibbon and Williams2002). Each affected subject was asked to identify members of close family aged 16–25 years. Following informed consent, unaffected individuals with at least one first-degree or two second-degree relatives with bipolar I disorder were invited to participate. For the majority of cases (about 90%) the high-risk individuals were first-degree relatives of the ill family member. Only three of the HR well individuals and one HR MDD had (two or more) second-degree relatives with BD. Unaffected, unrelated comparison subjects with no personal or family history of BD were identified from the social groups of the high-risk subjects and matched for age, gender and intelligence quotient (IQ) to the high-risk group. Comparison subjects were also screened using the SCID (First et al. Reference First, Spitzer, Gibbon and Williams2002). Exclusion criteria for both groups at initial recruitment included a personal history of major depression, mania or hypomania, psychosis, or any major neurological or psychiatric disorder, a history of substance dependence, learning disability, or any history of head injury that included loss of consciousness and any contraindications to magnetic resonance imaging (MRI). No group differences in lifetime substance misuse were observed previously in this sample (Whalley et al. Reference Whalley, Sussmann, Chakirova, Mukerjee, Peel, McKirdy, Hall, Johnstone, Lawrie and McIntosh2011). Written informed consent was obtained. The study was approved by the Multi-Centre Research Ethics Committee for Scotland.
Current study population
Participants were recruited for the current study as part of the BFS as described above. Participants, including controls, have been followed up on three occasions 2 years apart (Whalley et al. Reference Whalley, Sussmann, Romaniuk, Stewart, Kielty, Lawrie, Hall and McIntosh2015). Only the first two occasions [T1, time 2 (T2)] contained imaging assessments, the third assessment (T3) being primarily a follow-up clinical assessment. All participants, controls and high risk, were interviewed by one of two experienced psychiatrists (A.M.M., J.E.S.) using the SCID (First et al. Reference First, Spitzer, Gibbon and Williams2002) to confirm the lifetime absence of any Axis I disorders at T1, and at T2 to determine the presence of any mood disorder meeting diagnostic criteria over the intervening period. At T3 diagnostic status was determined either by face-to-face assessment, or through accessing clinical records at the National Health Service (NHS) as to whether a clinical diagnosis had been made or not (Whalley et al. Reference Whalley, Sussmann, Romaniuk, Stewart, Kielty, Lawrie, Hall and McIntosh2015). For a number of individuals (n = 9), it was not possible to determine the clinical status at T3, either the general practitioner (GP) did not provide details or the GP address was unknown. In the absence of further clinical information indicating that they had become unwell, and since they had remained well over the previous two assessments, these individuals were presumed to have remained well. This, however, necessitated an additional confirmatory analysis excluding these individuals, reported below. If other disorders were present along with depressive features (e.g. borderline personality disorder, n = 1; alcoholism, n = 1; or episodes of psychosis, n = 1) these individuals were excluded from the current analysis.
Manic and depressive symptoms were rated using the Young Mania Rating Scale (YMRS; Young et al. Reference Young, Biggs, Ziegler and Meyer1978) and the Hamilton Rating Scale for Depression (HAM-D; Hamilton, Reference Hamilton1960), and the presence of psychotic symptoms was assessed using the Positive and Negative Syndrome Scale (PANSS, Kay et al. Reference Kay, Fiszbein and Opler1987). Estimates of trait-liability to mood disorder (neuroticism and extraversion) were measured using the NEO Five Factor Inventory (NEO-FFI; McCrae & John, Reference McCrae and John1992). Childhood trauma was measured using the 18-item Childhood Trauma Questionnaire (CTQ; Bernstein & Fink, Reference Bernstein and Fink1988).
The current study concerns structural brain changes between T1 and T2 in relation to the development of MDD at any time throughout the study. The final sample consisted of 131 individuals categorized into three groups: (i) healthy controls who remained well (n = 48; note that seven control individuals developed MDD; however, due to small group size these individuals were not included in the current analysis); (ii) familial high-risk participants who remained well throughout the study (HR well, n = 53); and (iii) familial high-risk participants who developed a mood disorder (MDD) at any time throughout the period of study (21 by T2, a further nine by T3; HR MDD, n = 30; also of note is that two HR individuals had developed BD over the course of the study, similar to above these individuals were not included in the current analyses).
The mean interval between T1 and T2 was 2.12 (s.d. = 0.13), 2.24 (s.d. = 0.15) and 2.24 (s.d. = 0.19) years for the control, HR well and HR MDD groups, respectively. The mean interval between T2 and T3 was 2.73 (s.d. = 0.13), 2.67 (s.d. = 0.14) and 2.66 (s.d. = 0.18) years for the control, HR well and HR MDD groups, respectively. Five individuals from the HR MDD group were on antidepressant medication at T2. An additional subsequent confirmatory analysis was therefore performed excluding these individuals to explore the confounding effects of medication.
Image processing and analysis
All participants were scanned at the Edinburgh University Brain Research Imaging Centre (BRIC) on a GE 1.5T Signa scanner (GE Medical). The T1 sequence was a coronal gradient echo sequence with the magnetization preparation (MPRAGE) yielded 180 contiguous 1.2-mm coronal slices (matrix = 192 × 192; field of view = 24 cm; flip angle 8°).
After reconstruction from raw dicom format to nifti via dcm2nii, structural data were analysed with FSL–voxel-based morphometry (FSL-VBM) (Douaud et al. Reference Douaud, Smith, Jenkinson, Behrens, Johansen-Berg, Vickers, James, Voets, Watkins, Matthews and James2007) (http://fsl.fmrib.ox.ac.uk/fsl/fslwiki/FSLVBM), an optimized VBM protocol (Good et al. Reference Good, Johnsrude, Ashburner, Henson, Friston and Frackowiak2001; Smith et al. Reference Smith, Jenkinson, Woolrich, Beckmann, Behrens, Johansen-Berg, Bannister, De Luca, Drobnjak, Flitney, Niazy, Saunders, Vickers, Zhang, De Stefano, Brady and Matthews2004) carried out within the FSL environment (Smith et al. Reference Smith, Jenkinson, Woolrich, Beckmann, Behrens, Johansen-Berg, Bannister, De Luca, Drobnjak, Flitney, Niazy, Saunders, Vickers, Zhang, De Stefano, Brady and Matthews2004). Briefly, all structural images, one for each participant and time point, were brain-extracted and grey matter-segmented before being registered to the MNI 152 standard space using non-linear registration. The resulting images were then averaged and flipped along the x-axis to create a left–right symmetric, study-specific grey matter template. Next, all native grey matter images were non-linearly registered to this study-specific template and ‘modulated’ to correct for local expansion (or contraction) due to the non-linear component of the spatial transformation. The modulated grey matter images were then smoothed with an isotropic Gaussian kernel with a sigma of 3 mm. The choice of smoothing kernel was selected in order to maximize the ability to detect differences in the medial temporal lobe regions as described in our prior hypotheses. The smoothed, normalized grey matter images were compared longitudinally between the three groups: controls, HR well and HR MDD. This was done using a voxel-wise general linear model (GLM) with a repeated-measures design including all three groups over both time points. The model was applied using permutation-based non-parametric testing in the FSL package randomise. The analysis plan was to examine differences in longitudinal change over time between the three groups (controls, HR well and HR MDD).
Results in grey matter were considered significant for p < 0.05, after correction for multiple comparisons using the threshold-free cluster enhancement (TFCE) approach (Smith & Nichols, Reference Smith and Nichols2009) in the FSL randomize package which avoids using an arbitrary threshold for the initial cluster formation. Based on our a priori hypothesis, small volume corrections were applied for the bilateral amygdala, hippocampus and anterior cingulate cortex created using the Harvard–Oxford sub-cortical structural atlas (Desikan et al. Reference Desikan, Ségonne, Fischl, Quinn, Dickerson, Blacker, Buckner, Dale, Maguire, Hyman, Albert and Killiany2006). Prefrontal abnormalities were examined at the whole-brain level. All coordinates are quoted in Montreal Neurological Institute (MNI) convention (http://www.mni.mcgill.ca) and images are overlaid onto a standard brain in MNI space using FSLView software package. Demographic and clinical data were analysed using one-way analyses of variance, χ2 tests or Kruskal–Wallis tests where appropriate using SPSS (USA).
Relationship between grey matter change and individual risk markers
We subsequently examined the association between imaging changes over time and measures of childhood trauma, trait-liability and mood state. Imaging data were extracted using the significant clusters of difference (mean of the cluster) between groups and subsequently related to total CTQ scores at baseline, measures of depressive symptoms (from HAM-D scores), and measures of trait-liability (neuroticism and extraversion) using both baseline and change in scores over time. This was performed in SPSS using correlation analysis on the whole sample whilst controlling for group status.
Results
Demographic data
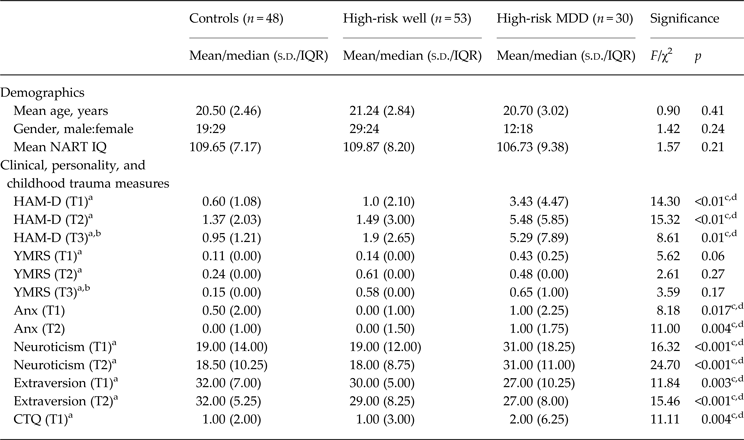
Demographics, clinical details and behavioural measures are presented in Table 1. Groups did not differ with respect to age, gender or IQ as measured by the National Adult Reading Test (NART; Nelson, Reference Nelson1982).
Demographics, and clinical, behavioural and temperament measures

MDD, Major depressive disorder; s.d., standard deviation; IQR, interquartile range; NART, National Adult Reading Test; IQ, intelligence quotient; HAM-D, Hamilton Rating Scale for Depression; T1, time 1; T2, time 2; T3, time 3; YMRS, Young Mania Rating Scale; Anx, anxiety; CTQ, Childhood Trauma Questionnaire.
a Kruskal–Wallis tests, median and IQR presented for skewed variables.
b From those individuals who attended face-to-face assessment.
c,d Pair-wise comparisons indicated significant group differences between controls and high-risk MDD and between high-risk well and high-risk MDD; see text.
For the HR-MDD individuals (n = 30), at T2, nine individuals from this group were well (becoming ill later) and 21 individuals were diagnosed as MDD (all assessed using the SCID). Of the latter, 12 individuals were classed as single episode and nine were classed as recurrent. Three individuals scored >15 on the HAM-D. The highest score for the YMRS was a score of 5 in one individual; the remaining individuals scored 0–2. For the PANSS positive scores, two individuals scored 9; the remainder scored 7–8 (7 being equivalent to null).
At T3, 10 individuals were classed as well, one individual was deceased and the remainder were classed as MDD. Of the latter group, seven diagnoses were determined through GP contact and for whom we could not determine further detailed subtype diagnoses. Of those 14 who were MDD assessed using the SCID, two were single episode and 12 were classed as recurrent. Three individuals scored >15 on the HAM-D. The highest score on the YMRS was a score of 4 in one individual; the remaining subjects scored 0–2. For the PANSS positive, one individual scored 14, one scored 12, and the remainder scored 7–8.
Between-group differences in brain structure
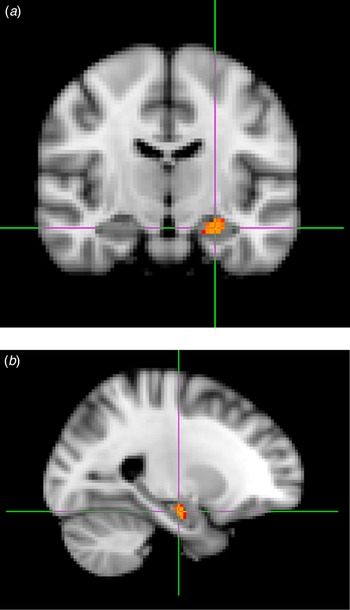
Comparisons of groups at the whole-brain level did not reveal any significant longitudinal grey matter changes over time between the groups in the prefrontal cortex or in any other region. Region of interest analysis in the anterior cingulate cortex also did not reveal any significant group differences. However, significant differences were reported in the right amygdala using the a priori region of interest approach [cluster extent = 488 mm3, peak MNI coordinates = (57, 56, 27), p corr < 0.017; see Fig. 1]. This cluster also overlapped with the hippocampal region of interest; however, since the bulk of this cluster and the peak was centered in the amygdala we refer to the result as such.
Longitudinal structural change within the amygdala as assessed by voxel-based morphometry. Decreases over time in high-risk individuals who develop major depressive disorder over the course of the study v. those that remain well, and healthy controls over a 2-year inter-scan period: (a) coronal section; (b) sagittal section.

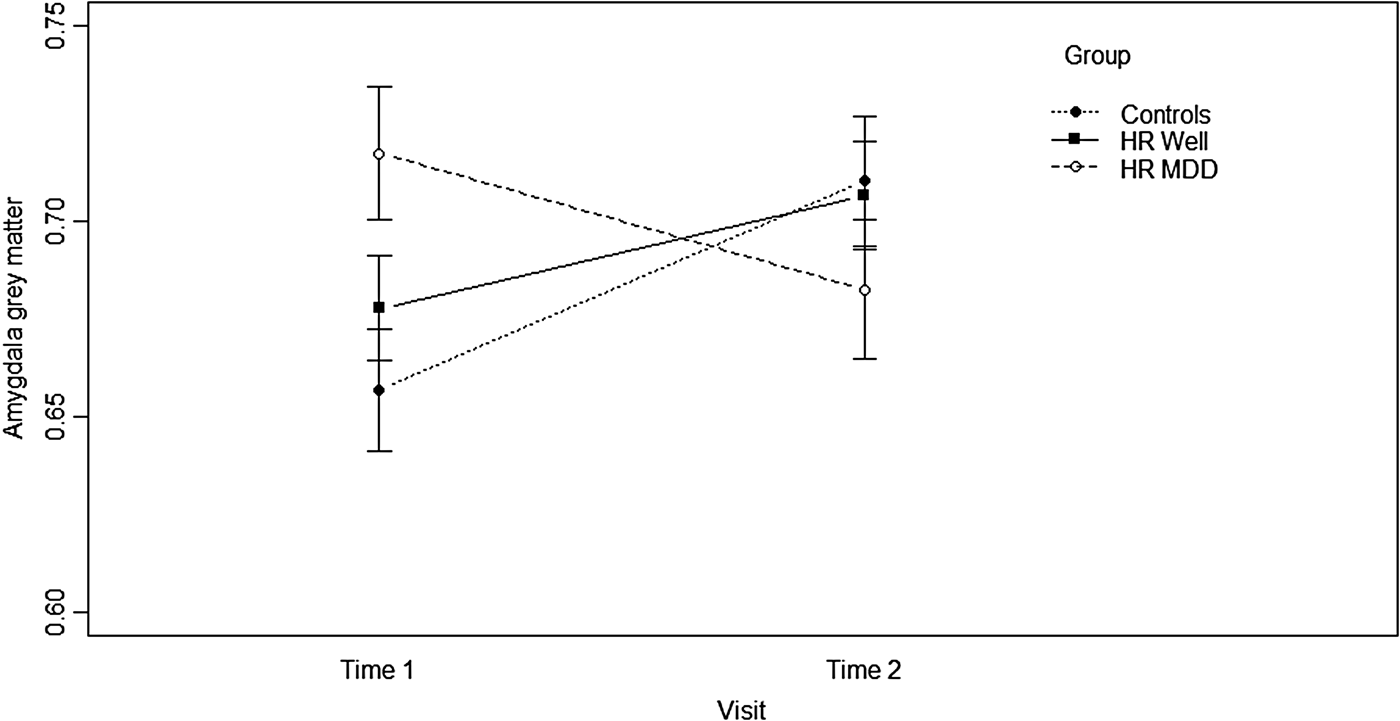
Formal pair-wise comparison of the extracted amygdala data (mean of the cluster) indicated significant group × time interactions between the controls and HR MDD (p = 0.001, F = 12.954), between the HR well and HR MDD (p = 0.005, F = 8.197), but not between the controls and HR well groups. Graphs of extracted amygdala grey matter for the cluster of difference revealed that there was a small increase in both the control and HR well groups between T1 and T2; by contrast, the HR MDD group demonstrated a reduction in grey matter over the two time points (Fig. 2).
Group × time interaction. Graphical view of raw data extracted from a cluster of longitudinal change over time between groups. HR Well, High-risk well; HR MDD, high-risk major depressive disorder. Values are means, with standard deviations represented by vertical bars.

Removing the five individuals who were on medication at T2 did not alter the findings of grey matter differences in the amygdala over time between groups (p = 0.003, F = 6.18), nor did excluding the nine participants in the HR well group who were presumed well due to unavailable follow-up clinical data at T3 (p = 0.002, F = 6.66). Similarly, removing the individuals who became ill at T3 did not alter the findings (p = 0.002, F = 6.45).
Examining findings cross-sectionally at T1 and T2 separately indicated no significant differences at the whole-brain level between the groups, nor for the anterior cingulate region of interest. There were, however, significant group differences for the amygdala at T1 but not at T2 based on extracted data (T1: F = 3.363, p = 0.038; T2: F = 0.709, p = 0.494). Pair-wise t test comparisons indicated significant differences between controls and HR MDD at T1 only (controls v. HR MDD T1: F = 2.542, p = 0.013; T2: F = 0.101, p = 0.274; HR well v. HR MDD T1: F = 1.810, p = 0.074; T2: F = 1.055, p = 0.294; controls v. HR well, T1: F = 1.024, p = 0.310, T2: F = 0.172, p = 0.864).
Between-group differences in longitudinal symptom severity and trait-liability measures
There were no significant differences between the groups in terms of longitudinal change in symptom severity scores or personality measures between T1 and T2 (HAM-D χ2 = 2.971, p = 0.226; neuroticism χ2 = 0.476, p = 0.788; extraversion χ2 = 2.879, p = 0.237).
As expected, however, there were significant differences between groups for cross-sectional measures of depression indexed by the HAM-D, with the HR MDD group scoring highest across all time points (T1, p < 0.01; T2, p < 0.01; and T3, p = 0.01). Further, pair-wise t tests show that significant differences existed between controls and HR MDD (T1, p < 0.001; T2, p < 0.001 and T3, p = 0.02) and between HR well and HR MDD (T1, p = 0.001; T2, p < 0.001; and T3, p = 0.04). There were no significant differences between groups in terms of mania scores determined from the YMRS for any assessment points. The HR MDD group also demonstrated significantly increased levels of sub-diagnostic anxiety as measured by the Temperament Evaluation of the Memphis, Pisa, Paris, and San Diego Autoquestionnaire (TEMPS-A) at each time point, and these were significantly higher than controls and HR well individuals; see Table 1.
There were also significant differences between the three groups for baseline measures of neuroticism (p < 0.001), extraversion (p = 0.003) and childhood trauma (CTQ total, p = 0.004); see Table 1. Specifically, the HR MDD group showed the highest level of neuroticism and CTQ, and lowest levels of extraversion. For neuroticism, extraversion and CTQ, pair-wise comparisons indicated significant differences between the controls and HR MDD groups (p < 0.001, Z = 3.563; p = 0.001, Z = 3.293; p = 0.001, Z = 3.340, respectively), between the HR well and HR MDD groups (p < 0.001, Z = 3.714; p = 0.016, Z = 2.407; p = 0.039, Z = 2.861, respectively), but not between the controls and HR well individuals.
Relationship between imaging findings and symptom severity and trait-liability measures
We examined the relationship between the VBM measures of amygdala grey matter change over time and measures of depression from the HAM-D (baseline, T2, and change in score between T1 and T2), anxiety (from the TEMPS-A baseline, T2 and change in score between T1 and T2) neuroticism, extraversion (baseline, T2 and change in score between T1 and T2), and CTQ (baseline only). There were no significant associations in the whole sample controlling for group status, nor within groups separately.
Discussion
In the current study we demonstrated longitudinal structural decreases over time in the amygdala in a group of individuals who were at high familial risk of developing a mood disorder and who became ill over the course of the study, v. high-risk individuals who remained well, and healthy controls with no family history of mood disorder. The findings indicate that dynamic structural changes in the amygdala are associated with the development of MDD in this young sample. Measures of symptom severity, sub-diagnostic anxiety, neuroticism and extraversion, and CTQ significantly differentiated the groups at baseline prior to illness, and therefore may therefore constitute vulnerability markers of illness. However, changes in these non-imaging risk factors between assessments did not associate with illness development, nor did they relate significantly to the imaging findings. Taken together therefore these findings indicate that imaging measures may more closely follow the dynamic route to illness than clinically ascertained measures of risk.
Converging lines of evidence suggest that the amygdala plays an important role, along with wider prefrontal and limbic networks, in responding to emotional salience of stimuli. The amygdala is therefore a key structure in the formation and stability of affective states (LeDoux, Reference LeDoux2000). Previous imaging studies of the amygdala in MDD have most consistently demonstrated abnormally increased functional activation in response to negative or non-emotional stimuli in patient groups, also seen in unaffected relatives (Drevets, Reference Drevets2003; Drevets et al. Reference Drevets, Price and Furey2008; Whalley et al. Reference Whalley, Sussmann, Chakirova, Mukerjee, Peel, McKirdy, Hall, Johnstone, Lawrie and McIntosh2011; Swartz et al. Reference Swartz, Williamson and Hariri2014), along with impaired prefrontal–amygdala connectivity (Matthews et al. Reference Matthews, Strigo, Simmons, Yang and Paulus2008; Almeida et al. Reference Almeida, Versace, Mechelli, Hassel, Quevedo, Kupfer and Phillips2009). Such circuits are therefore considered key to the emotion-regulation difficulties experienced in the disorder (Phillips et al. Reference Phillips, Drevets, Rauch and Lane2003). Structural studies comparing cases and controls have, however, been generally less directionally consistent, or indeed report no differences (Frodl et al. Reference Frodl, Moller and Meisenzahl2008; Arnone et al. Reference Arnone, McIntosh, Ebmeier, Munafo and Anderson2012). There is growing evidence of increased volumes of the amygdala early on in the disease course, for example in first-episode (Frodl et al. Reference Frodl, Meisenzahl, Zetzsche, Bottlender, Born, Groll, Jäger, Leinsinger, Hahn and Möller2002, Reference Frodl, Meisenzahl, Zetzsche, Born, Jager, Groll, Bottlender, Leinsinger and Möller2003), and in high-risk cohorts (Boccardi et al. Reference Boccardi, Almici, Bresciani, Caroli, Bonetti, Monchieri, Gennarelli and Frisoni2010; Rao et al. Reference Rao, Chen, Bidesi, Shad, Thomas and Hammen2010; Saleh et al. Reference Saleh, Carballedo, Lisiecka, Fagan, Connolly, Boyle and Frodl2012; Romanczuk-Seiferth et al. Reference Romanczuk-Seiferth, Pohland, Mohnke, Garbusow, Erk, Erk, Haddad, Grimm, Tost, Meyer-Lindenberg, Walter and Wüstenberg2014), indicating potential differences in the trajectory of developmental processes. Although we did not report significant cross-sectional baseline differences in the amygdala in the current study, we do report dynamic structural changes within the right amygdala around the period of illness development which manifested as a decrease over time in those who developed MDD. In those who remained well, and in the healthy control group, there was an increase in grey matter over time in the amygdala which we therefore interpret as reflecting normal neurodevelopment in this region in this relatively young cohort of individuals who are still reaching levels of neurobiological maturity. This is notably highly consistent with a previous study reporting that adolescents during early phases of the mood disorder do not exhibit normal increases in amygdala volume that occur during healthy adolescent neurodevelopment (Bitter et al. Reference Bitter, Mills, Adler, Strakowski and DelBello2011).
This finding was only significant for the right amygdala. Previous studies examining amygdala structure in depression have provided equivocal results regarding hemispheric lateralization (Hamilton et al. Reference Hamilton, Siemer and Gotlib2008). Further, given the paucity of other longitudinal studies, we believe that currently any conclusions about laterality should be undertaken with caution. Regardless, the current study adds to a currently rather limited literature of longitudinal change in brain structure associated with the onset of mood disorder in young participants at increased risk (Whittle et al. Reference Whittle, Lichter, Dennison, Vijayakumar, Schwartz, Byrne, Simmons, Yücel, Pantelis, McGorry and Allen2015). The findings begin to indicate timelines for abnormal neurodevelopment during the early course of illness. Whether such structural changes are a cause or consequence of active disease processes, however, remains unclear. Also, whether such changes are able to inform important clinical distinctions can only be determined with further follow-up of the cohort. For example, whether it is possible to distinguish those who have a single episode of unipolar depression v. those who manifest a more severe recurrent course, or indeed who go on to develop BD or other mental health problems. Finally, how such abnormalities relate to wider prefrontal circuitry abnormalities reported in patients has also yet to be established.
One other main factor that has previously been associated with the risk of developing mood disorder is anxiety disorder, which has a particularly strong relevance in the current context given its reported association with the amygdala. We would like to stress, however, that at recruitment any individuals who met diagnostic criteria for an anxiety disorder were not included in the study. Further, we report no association either between the change in anxiety scores from the TEMPS-A and changes in the amygdala grey matter, or any significant associations cross-sectionally. We cautiously conclude therefore that these findings represent change associated with the development of MDD rather than to concurrent anxiety features
We also acknowledge several limitations of the current study. The longitudinal nature of such a study spanning 6+ years and the necessity for utilizing a consistent imaging strategy has meant that imaging protocols can begin to look dated in terms of slice thickness and field strength. However, we believe this is inherent to any long-term, longitudinal study and does not affect the valuable contribution of the data.
Also, although the presence of a family history of mental illness is one of the highest risk factors for depression, other factors also contribute to the overall pattern of risk. Among these are early stressful life events, and the personality traits of neuroticism (high) and extraversion (low) which are thought to relate to maladaptive cognitive and emotional processing (Heim & Nemeroff, Reference Heim and Nemeroff2001; MacMillan et al. Reference MacMillan, Fleming, Streiner, Lin, Boyle, Jamieson, Duku, Walsh, Wong and Beardslee2001; Kendler et al. Reference Kendler, Gatz, Gardner and Pedersen2006; Chan et al. Reference Chan, Goodwin and Harmer2007; Hovens et al. Reference Hovens, Wiersma, Giltay, van Oppen, Spinhoven, Penninx and Zitman2010). Notably, these measures at baseline differentiated those at high risk who became ill v. those who remained well over the course of 4 years, indicating the importance of these measures in informing wider models of risk prediction. Although we consider it an important finding that individuals who go on to develop MDD at follow-up have significantly increased levels of symptoms as measured by the HAM-D and increased neuroticism since they may indicate important predictors of subsequent illness, we also note that this could equally reflect the prodromal phase of a mood disorder. We stress, however, than no individuals met diagnostic criteria for a mood disorder at study entry. In the current study, however, none of these measures was directly related to the structural imaging findings, nor were changes in these scores associated with the developmental trajectory of illness onset. We interpret these finding therefore as suggesting that imaging measures are more sensitive to changes associated with the dynamic route to illness than these clinically ascertained measures of risk. We also note as an additional limitation that the lack of relationship between change in clinical and trait features of the disorder with imaging features could be attributable to lack of power (limited range of change in the scores), or to the fact that these measures were not specifically designed to measure change per se. In particular, personality features are considered to be stable traits across the lifespan. The lack of associations between these measures should therefore be viewed cautiously.
A particular strength of the current study was the use of a young, relatively large, well-characterized cohort followed up over 4+ years on whom we are continuing to collect data. By the very nature of the cohort the clinical picture is one of dynamic change. It is possible, if not likely, that for some individuals for whom an early diagnosis of MDD may ultimately herald a diagnosis of BD, as was the case for two individuals in the study (Hillegers et al. Reference Hillegers, Reichart, Wals, Verhulst, Ormel and Nolen2005). These findings should therefore be considered in this context. We also note that conversion rates (for MDD) are similar to those reported in other prospective longitudinal studies examining the clinical course of young relatives of bipolar individuals (Hillegers et al. Reference Hillegers, Reichart, Wals, Verhulst, Ormel and Nolen2005; Duffy et al. Reference Duffy, Alda, Hajek and Grof2009, Reference Duffy, Horrocks, Doucette, Keown-Stoneman, McCloskey and Grof2014). The study by Duffy et al. (2014), for example, reported a cumulative incidence of 32 out of 229 high-risk individuals, and eight out of a sample of 86 control participants who developed MDD, but only three individuals from the high-risk group developed BD (and no controls), consistent with the findings reported here. The continued clinical longitudinal follow-up of these high-risk samples will make important contributions to the understanding of early phases of affective disease pathways. One other criticism could be that since there is a decrease over time in the HR MDD group, and there are no significant differences between the groups cross-sectionally at T2, this could represent regression to the mean. Ongoing scanning assessment of the individuals will provide a clearer picture of whether there is continued progressive decline in the ill group. Finally, we also highlight the practical difficulties in performing such large-scale prospective longitudinal cohort imaging studies, particularly relating to cumulative attrition over the course of the study. For this reason it was necessary for us to determine diagnostic status for a small number of individuals based on GP correspondence at T3. We acknowledge that this as a limitation in that we consequently have fewer symptom-related and subtype details for these participants.
Overall our findings suggest that development of MDD in a cohort of individuals at high familial risk of BD is related to the decreasing amygdala grey matter around the time of illness onset. Other factors such as increased levels of childhood trauma, increased neuroticism and decreased extraversion appeared to distinguish groups at baseline; however, longitudinal change in these scores did not relate to the development of MDD, suggesting that imaging measures may capture additional information beyond clinically ascertained measures of risk and may be a useful marker of illness development.
Acknowledgements
We would like to thank all of the participants who took part in the study and the radiographers who acquired the MRI scans. This study was conducted at the Brain Research Imaging Centre (http://www.bric.ed.ac.uk) which is supported by SINAPSE (Scottish Imaging Network, a Platform for Scientific Excellence, http://www.sinapse.ac.uk). The research leading to these results has received funding from the European Community's Seventh Framework Programme (FP7/2007–2013) under grant agreement no. 602450. This paper reflects only the authors’ views and the European Union is not liable for any use that may be made of the information contained therein. This work was also supported by a Wellcome Trust Strategic Award (104036/Z/14/Z).
Declaration of Interest
T.N. is supported by the Dr Mortimer and Theresa Sackler Foundation. H.C.W. is supported by a College Fellowship from the University of Edinburgh and a John, Margaret, Alfred and Stewart Sim (JMAS Sim) fellowship from the Royal College of Physicians of Edinburgh. J.E.S. is supported by a Clinical Research Training Fellowship from the Wellcome Trust. J.H. was supported by a Scottish Funding Council Senior Clinical Fellowship (SCD/10) and is currently supported by a Medical Research Council Centre grant (G0800509). A.M.M. was supported by the Health Foundation through a Clinician Scientist Fellowship (reference 2268/4295), by the Brain and Behaviour Research Foundation through a NARSAD Independent Investigator Award and by a Scottish Funding Council Senior Clinical Fellowship. The investigators also acknowledge the financial support of NHS Research Scotland, through the Scottish Mental Health Research Network (http://www.smhrn.org.uk) which provided assistance with subject recruitment and cognitive assessments. All imaging aspects also received financial support from the Dr Mortimer and Theresa Sackler Foundation. H.C.W., L.R., J.H., S.M.L. and A.M.M. have received financial support from Pfizer (formerly Wyeth) in relation to imaging studies of people with schizophrenia and BD. S.M.L. and A.M.M. have done consultancy work for Roche Pharmaceuticals. S.M.L. has also received honoraria for lectures, chairing meetings, and consultancy work from Janssen in connection with brain imaging and therapeutic initiatives for psychosis. Other authors T.N., S.W.Y.C., M.P., A.M., T.S., S.K. and J.E.S. have no competing interests to declare.