Introduction
The management of herbicide-resistant weeds is challenging for U.S. soybean [Glycine max (L.) Merr.] farmers. New soybean varieties developed to be resistant to dicamba or 2,4-D provide alternative options for control of glyphosate-resistant weeds (Kruger et al. Reference Kruger, Davis, Weller and Johnson2010). For example, POST applications of dicamba in dicamba-resistant soybean have provided 88% to 100% control of glyphosate-resistant weeds, including horseweed (Erigeron canadensis L.), Palmer amaranth (Amaranthus palmeri S. Watson), common waterhemp [A. tuberculatus (Moq.) Sauer], and giant ragweed (Ambrosia trifida L.) (Byker et al. Reference Byker, Soltani, Robinson, Tardif, Lawton and Sikkema2013; Kruger et al. Reference Kruger, Davis, Weller and Johnson2010; Norsworthy et al. Reference Norsworthy, Griffith, Scott, Smith and Oliver2008; Spaunhorst et al. Reference Spaunhorst, Siefert-Higgins and Bradley2014). In 2,4-D–resistant soybean, the use of 2,4-D alone or in combination with glufosinate has also provided greater than 93% control of glyphosate-resistant populations of both horseweed and Palmer amaranth (Craigmyle et al. Reference Craigmyle, Ellis and Bradley2013; Norsworthy et al. Reference Norsworthy, Griffith, Scott, Smith and Oliver2008).
Dicamba and 2,4-D are classified as plant growth regulator or synthetic auxin herbicides and are in the Group 4 herbicide site-of-action group (Mallory-Smith and Retzinger Reference Mallory-Smith and Retzinger2003). Historically, these herbicides have been used for selective control of broadleaf (dicots) plants in monocot crops, including turf, small grains, corn, and pastures (Shaner Reference Shaner2014). In fact, almost all broadleaf plants show some response to applications of these herbicides. Selectivity between dicots and monocots with these herbicides is a function of both plant metabolism and target-site sensitivity (Grossman Reference Grossman2003; Sterling and Hall Reference Sterling, Hall and Roe1997). In dicamba-resistant soybean, the insertion of the dicamba monooxygenase gene catalyzes dicamba metabolism to nontoxic forms, allowing for the safe use of soil-applied and POST dicamba (Behrens et al. Reference Behrens, Mutlu, Chakraborty, Dumitru, Jiang, LaVallee and Weeks2007). In 2,4-D–resistant soybean, the aryloxyalkanoate dioxygenase enzyme AAD-12 was inserted to increase the degradation of 2,4-D into the nonherbicidal metabolite dichlorophenol (Wright et al. Reference Wright, Shan, Walsh, Lira, Cui, Song, Zhuang, Arnold, Lin, Yau, Russel, Cicchillo, Peterson, Simpson, Zhou, Ponsamuel and Zhang2010). Prior to the insertion of these resistance genes, soybean was extremely sensitive to dicamba and 2,4-D and could be injured if exposed unintentionally (Andersen et al. Reference Andersen, Clay, Wrage and Matthees2004; Wax et al Reference Wax, Knuth and Slife1969).
Sensitive plants can be exposed unintentionally to dicamba and 2,4-D by various means, including off-target movement by vapor drift, particle drift, and spray system contamination (Behrens and Lueschen Reference Behrens and Lueschen1979; Boerboom Reference Boerboom2004; Cundiff et al. Reference Cundiff, Reynolds and Mueller2017; Dexter Reference Dexter1993). Vapor drift occurs when molecules of an herbicide’s active ingredient are converted from a liquid to a gas and are moved to an unintended location by air currents (Peterson et al. Reference Peterson, McMaster, Riechers and Skelton2016). The vaporization potential of the herbicide is a function of the herbicide’s physical properties and the environmental conditions at the time of and after application (Behrens and Lueschen Reference Behrens and Lueschen1979; Burgoyne and Hites Reference Burgoyne and Hites1993). Dicamba and 2,4-D are subject to vapor drift when salt formulations dissociate into the acid forms, thus increasing the vapor pressures of these herbicides (Behrens and Lueschen Reference Behrens and Lueschen1979; Hillger et al. Reference Hillger, Qin, Simpson and Havens2012).
Particle drift is another way sensitive plants can be exposed to low doses of dicamba and 2,4-D. Particle drift is the physical movement of the spray solution by wind. Factors that affect particle drift include application speed, droplet size, nozzle type, boom height, and wind speed (Alves et al. Reference Alves, Kruger, da Cunha, Vieira, Henry, Obradovic and Grujic2017; Maybank et al. Reference Maybank, Yoshida and Grover1978; Nordby and Skuterud Reference Nordby and Skuterud1974; Thistle Reference Thistle2004; Wolf et al. Reference Wolf, Grover and Wallace1993). Steps can be taken to help reduce particle drift, such as nozzle selection that increases droplet size. However, Alves et al. (Reference Alves, Kruger, da Cunha, Vieira, Henry, Obradovic and Grujic2017) found that even when drift reduction nozzles were used, 0.6% of the dicamba applied drifted up to 12 m with a wind speed of 4.9 m s−1.
Sensitive plants can also be exposed to low doses of dicamba and 2,4-D through spray system contamination. Improper sprayer clean out or herbicide residues remaining in spray tanks, hoses, or nozzles, even after proper clean out, can lead to unintended injury on sensitive crops during the next herbicide application. Boerboom (Reference Boerboom2004) documented that as much as 0.63% of the original use rate of dicamba (560 g ae ha−1) was detected in discharge water from the boom even after the spray system had been flushed with an ammonia and water solution. These findings were also supported by Osborne et al. (Reference Osborne, Xu, Swanson, Walker and Farmer2015), who found that in the water from the third rinse of a spray tank, rates of dicamba and 2,4-D of 0.16% and 1%, respectively, were still detected. These findings confirm the possibility of low rates of dicamba and 2,4-D being deposited on sensitive crops during the next application.
Several research studies have been conducted examining the effects of dicamba and 2,4-D exposure on sensitive crops. Soybean has been the focus of the majority of these trials, because soybean is extremely sensitive and grown on a large number of hectares in the United States. Previous research has shown that soybean is more sensitive to dicamba than to 2,4-D (Andersen et al. Reference Andersen, Clay, Wrage and Matthees2004; Wax et al. Reference Wax, Knuth and Slife1969). From a meta-analysis of 11 studies, Kniss (Reference Kniss2018) determined that rates as low as 0.03 g ae ha−1 of dicamba can injure soybean. However, yield losses of 5% did not occur until a concentration of 0.9 g ae ha−1 or more of dicamba was applied at the flowering stage of soybean (R1 to R2). Soybean injury from 2,4-D can also occur at relatively low rates, with 11.2 g ae ha−1 causing 5% plant injury (Andersen et al. Reference Andersen, Clay, Wrage and Matthees2004). However, even with plant injury up to 30%, yield losses did not always occur (Wax et al. Reference Wax, Knuth and Slife1969; Weidenhamer et al. Reference Weidenhamer, Triplett and Sobotka1989). Although soybean is an economically important crop to the United States and Michigan, there are several of other sensitive broadleaf crops grown in areas that are at risk of unintended dicamba or 2,4-D exposure, such as dry edible bean.
Dry bean are a short-seasoned legume that typically matures in 85 to 100 d (Kelly and Cichy Reference Kelly, Cichy, Siddiq and Uebersax2013). In the United States, 14 states produce 13 different market classes of dry bean (USDA-NASS 2018). Currently, Michigan leads the nation in production of three of these classes: black, cranberry, and small red bean (USDA-NASS 2018). Although Michigan is not the top producer of navy bean, this class is the second largest class grown in Michigan. On average, Michigan harvests 106,000 ha of dry bean, with an average yield of 2,300 kg ha−1 and a farm-gate value of $140 million (USDA-NASS 2018). Michigan dry bean is typically planted starting the first week of June and then throughout the month (Kelly and Cichy Reference Kelly, Cichy, Siddiq and Uebersax2013). This later planting date historically kept dry bean at a lower risk of exposure to dicamba and 2,4-D applications when these herbicides were used in corn and small grains, because applications were often made before dry bean emerged. However, with the use of POST applications of dicamba and 2,4-D to soybean later in the season, dry bean is at an increased risk of exposure.
Limited research has been conducted examining the effects of dicamba and 2,4-D exposure on dry edible bean. Lyon and Wilson (Reference Lyon and Wilson1986) reported great northern bean were more sensitive to dicamba than to 2,4-D and that dicamba at 112.5 g ae ha−1 reduced yield up to 96%. They also reported that exposure to dicamba and 2,4-D delayed bean maturity and reduced test weight and germination of harvested seed. More recently, Hatterman-Valenti et al. (Reference Hatterman-Valenti, Endres, Jenks, Ostlie, Reinhardt, Robinson, Stenger and Zollinger2017) reported that dicamba exposure at flowering (R1) at a rate of 18 g ae ha−1 injured navy and pinto bean up to 53%, delayed maturity, and reduced yield 56% to 100%.
With the recent commercialization of soybean varieties resistant to dicamba and 2,4-D, we expect to see increased use of these herbicides in several dry-bean growing regions. This change will put dry bean at an elevated risk for exposure from dicamba and 2,4-D. Previous research indicated that low doses of these herbicides have the potential to affect dry bean yield and quality (Lyon and Wilson Reference Lyon and Wilson1986; Hatterman-Valenti et al. Reference Hatterman-Valenti, Endres, Jenks, Ostlie, Reinhardt, Robinson, Stenger and Zollinger2017). However, there are still several questions that remain to be answered regarding modern dry bean varieties and market classes. Therefore, the objectives of this research presented here were to understand how multiple factors, including dry bean market class, herbicide rate, and application timing, influence dry bean response to dicamba and 2,4-D.
Materials and Methods
Field experiments were conducted in 2017 and 2018 at the Michigan State University Agronomy Farm in East Lansing, Michigan (42.710°N, 84.471°W) and at the Michigan State University Saginaw Valley Research and Extension Center near Richville, Michigan (43.399°N, 83.697°W). The soil types at East Lansing were a Colwood-Brookston loam (fine-loamy, mixed, mesic typic Haplaquoll) with pH of 7.0 and 2.7% organic matter in 2017, and a pH of 6.0 and 3.4% organic matter in 2018. Soils at the Richville location were a Tappan-Londo clay loam (fine-loamy, mixed, active, calcareous, mesic typic Epiaquoll) with pH of 7.0 and 2.7% organic matter in 2017, and a pH of 7.7 and 2.5% organic matter in 2018. Dry bean was planted in conventionally tilled soils. Soil preparation consisted of either fall chisel or moldboard plowing followed by two passes of a soil finisher in the spring before planting. Fertilizer applications were standard for dry bean production in Michigan. In East Lansing, 19-19-19 (N-P-K) at 112 kg ha−1 was applied with the planter 5 cm down and 5 cm over from the seed. At Richville, 336 kg ha−1 of 17-8-15 (N-P-K) fertilizer containing 1.5% manganese and 1.5% zinc was broadcast applied prior to spring tillage.
Two Type II (upright indeterminate vine) varieties, ‘Zenith’ black bean (Michigan Crop Improvement Association, Okemos, MI) and ‘Merlin’ navy bean (ProVita Seeds, Pigeon, MI) were planted in 76 cm rows at 269,000 seeds ha−1 at all locations. Black and navy bean were selected because they are the top two market classes grown in Michigan (USDA-NASS 2018). Dry bean was planted on June 6, 2017, and June 5, 2018, in East Lansing, and on June 8, 2017, and June 19, 2018, in Richville. Plots were four rows wide by 9.1 m long.
The diglycolamine salt of dicamba (XtendiMax®; Bayer Crop Science, Research Triangle Park, NC) and the choline salt of 2,4-D (Enlist One®; Corteva Agriscience, Wilmington, DE) were applied at 0.1%, 1.0%, and 10% of their standard rates of 560 and 1120 g ae ha−1 used in dicamba-resistant and 2,4-D–resistant soybean, respectively. Each herbicide treatment was applied at two different stages of growth, V2 (two-trifoliate) and V8 (prebloom) dry bean. Herbicides were applied using a tractor-mounted, compressed-air sprayer calibrated to deliver 177 L ha−1 at 206 kPa using AIXR 11003 nozzles (TeeJet Technologies, Wheaton, IL).
Experiments were arranged in a split-plot design with three (East Lansing in 2018) or four replications. The main plot factor was application timing and subplot factors within in the main plots were arranged in a two-way factorial between dry bean class and herbicide treatment. All field experiments were maintained weed free through mechanical cultivation and supplemented by hand weeding.
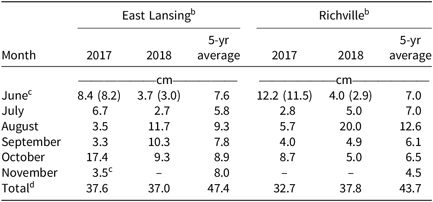
Precipitation data were obtained throughout the growing season from the Michigan Automated Weather Network (http://www.agweather.geo.msu.edu/mawn/; Michigan State University, East Lansing, MI). The Michigan Automated Weather Network maintains weather stations within 1 km of the experiment locations in both East Lansing and Richville, MI (Table 1).
Monthly and 5-yr average precipitation at East Lansing and Richville, MI, in 2017 and 2018.a

a Michigan Automated Weather Network (http://www.agweather.geo.msu.edu/mawn/).
b Precipitation data in parenthesis is from the time of planting.
c The harvest month does not include rainfall after harvest.
d Total precipitation is a total of rainfall from planting until harvest.
Dry bean injury was evaluated 7, 14, and 28 d after treatment (DAT) on a scale from 0% to 100%, with 0% equivalent to no plant response and 100% representing complete plant death. Light interception by the dry bean canopy was measured 55 d after planting (DAP) using a SunScan Canopy Analysis System (Dynamax Inc., Houston, TX), consisting of a 1 m by 13 mm wand containing 64 light sensors, connected to a hand-held computer. The wand was placed perpendicular to the center two rows above and below the plant canopy. Three measurements were taken per plot sequentially. Light-interception measurements were used to determine canopy development by subtracting the amount of light intercepted below the canopy from the amount of light measured above the canopy, then dividing that by the amount of light above the canopy and multiplying by 100. Measurements were taken around solar noon in full or nearly full sun. Dry bean maturity was evaluated weekly for 6 wk before harvest. A 0% to 100% scale was used, with a 0% indicating all green tissue and 100% indicating complete plant maturity (no green tissue).
Dry bean plots were mechanically harvested after natural plant senescence. When possible, plots were direct harvested using a small-plot research combine (Massey-Ferguson 8XP; AGCO, Duluth, GA) with a 1.5-m header. Treatments that had severe delays in maturity were hand harvested and dry bean seed was separated from pods, stems, and leaves using a stationary thrasher (Almaco LPR; Almaco, Nevada, IA). Excess rainfall near harvest at East Lansing in 2018 led to dry bean regrowth requiring the use of a chemical desiccant prior to harvest. Dry bean was desiccated with saflufenacil (Sharpen®; BASF Corporation, Research Triangle Park, NC) at 50 g ai ha−1 plus 1% vol/vol methylated seed oil 14 d before harvest. Dry bean yield was adjusted to 18% moisture.
Samples of harvested dry bean seed were taken from each plot during harvest. Seed samples were sorted for mechanical damage and weight per 100 seeds was recorded for undamaged seeds. Seed germination was tested only for black bean by placing 25 undamaged seeds per sample in a germination chamber for 5 d at 20 C. At the conclusion of the 5 d, the number of germinated seeds was counted, divided by the total, and multiplied by 100 to calculate percent germination.
Statistical Analysis
Nonlinear regression using the drc package in R (R, version 3.0; https://cran.r-project.org/web/packages/drc/index.html) (Knezevic et al. Reference Knezevic, Streibig and Ritz2007) was used to predict the dicamba and 2,4-D rates needed to cause 20% dry bean injury (I20), and yield reductions of 5%, 10%, and 15% (YR5-15). Model fit was confirmed using the ModelFit function in R. Estimates of I20 and YR5-15 values were compared using the EDcomp function in R, with P ≤ 0.05 considered statistically significant. Data were combined over the fixed effects of site-year (individual years and locations), dry bean class, or application timing, if interactions with herbicide rates were not significant.
The nonlinear models used were the three-parameter log-logistic model [Equation 1] and the three-parameter Weibull model [Equation 2]. The log-logistic model was used for I20 values; y represents dry bean injury, x is herbicide rate, c is the lower limit, b is the slope of the line around e, and e is the I20. The Weibull model was used to estimate yield reductions, where y represents dry bean yield as a percentage of the control, b is the relative slope of the curve, d is the upper limit, e is the YR5-15, and x is the herbicide rate.
 $${\rm{y = c }} + {{100 - {\rm{c}}} \over {1 + \exp [{\rm{b}}(\log ({\rm{x}}) - \log ({\rm{e}}))]}}$$
 $$\hskip-14pt{\rm{y = d}}({\rm{exp}}\{ - {\rm{ exp}}[{\rm{b}}({\rm{log}}({\rm{x}} - {\rm{e}})]\} )$$
Canopy development, seed weight, and seed germination were analyzed using PROC MIXED in SAS® version 9.4 (SAS institute, Cary, NC). The statistical model consisted of site-year, herbicide treatment, application timing, and dry bean class as fixed effects to test for site-year interactions. When these interactions were not significant, site-year was dropped as a fixed effect, and site-year, replication nested within site-year, and the interaction between application timing and replication nested within site-year were considered random effects. Treatment means were separated using Fisher protected LSD at α < 0.05 level of significance.
Nonlinear regression using the log-logistic model [Equation 1] was used to predict the number of days from planting to 50% dry bean maturity (MR50) for each experimental unit (replication). Equation parameters included: y, dry bean maturity; x, days after planting; c, the lower limit; b, the slope of the line around e, and e, the MR50. Estimated MR50 values were analyzed using PROC MIXED in SAS with the previously described model, and means were separated using Fisher protected LSD at α < 0.05 level of significance.
Results and Discussion
Dry Bean Injury
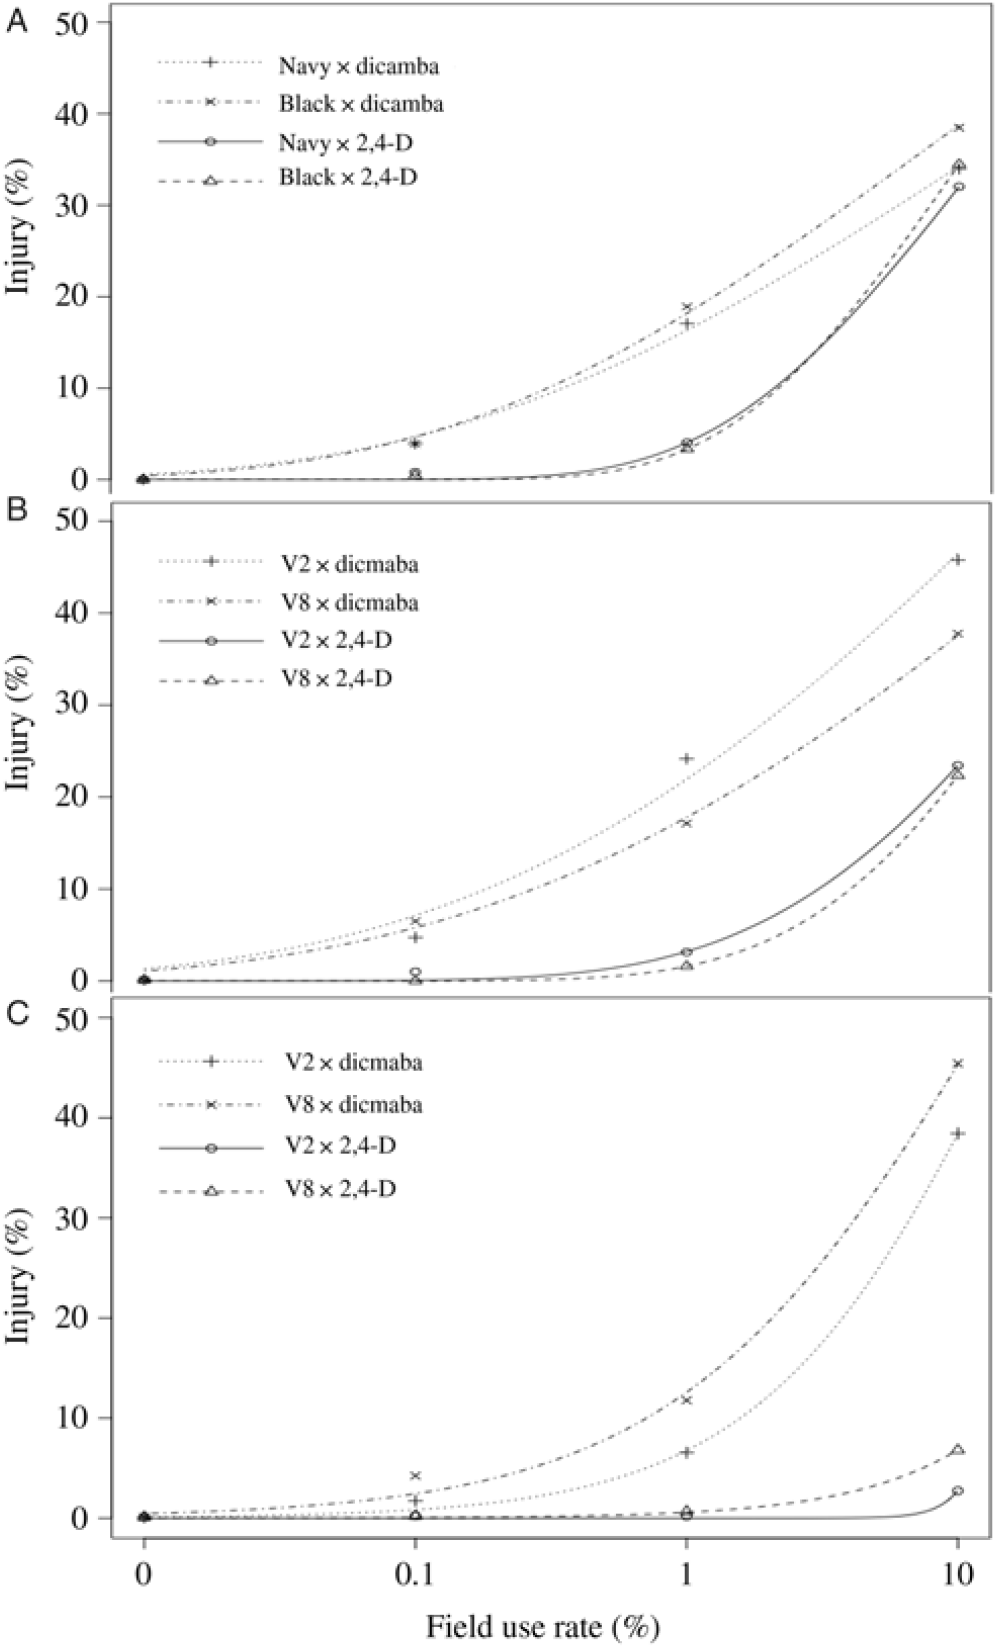
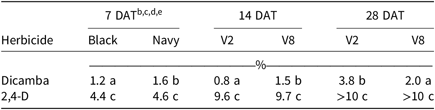
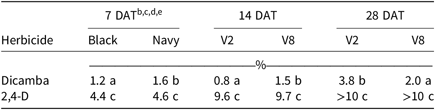
Dry bean injury from dicamba and 2,4-D was rate dependent and varied by dry bean class or application time, depending on the time of evaluation (Figure 1A–1C). At 7 DAT, there was an herbicide treatment by dry bean class interaction (P = 0.01). Black bean was slightly more sensitive to dicamba than navy bean and both classes of dry bean were more tolerant to 2,4-D compared with dicamba (Table 2). Injury from the 0.1% rate (0.56 g ae ha−1) of dicamba and the 1% rate (11.2 g ae ha−1) of 2,4-D was low (3% to 4%) (Figure 1A), and symptoms consisted of leaf crinkling and cupping. At higher rates, dry bean injury was as high as 39% and additional symptoms included stunting and outward growth of leaves and stems that resulted in a more flattened appearance of the entire plants.
Herbicide injury to dry bean at (A) 7, (B) 14, and (C) 28 d after treatment from multiple rates of dicamba and 2,4-D applied at V2 and V8 in Richville and East Lansing, MI. Rates were based on standard rates of 0.56 and 1.1 kg ha−1 for dicamba and 2,4-D, respectively. Data were combined over site-years and presented by the significant interaction between main effects. Interactions include herbicide treatment by (A) dry bean class (P = 0.01) and (B, C) herbicide treatment by application timing (P < 0.0001)

The estimated effective dose of dicamba and 2,4-D to cause 20% injury 7, 14, and 28 d after treatment when applied to V2 and V8 black and navy bean.a
a Data were combined over site-years and presented by the significant interactions between main effects.
b Estimates of estimated effective dose of dicamba and 2,4-D to cause 20% injury were generated and compared using the DRC package and EDcomp function in R (see Figure 1).
c Effective use rates are presented as a percentage of the field use rate of dicamba (560 g ae ha−1) and 2,4-D choline (1,120 g ae ha−1).
d Values followed by the same letter within evaluation timing are not significantly different (α ≤ 0.05).
e Abbreviation: DAT, days after treatment.
Differences in injury between dry bean classes were not apparent by 14 DAT. However, there was a herbicide treatment by application timing interaction for dry bean injury at 14 and 28 DAT (P < 0.0001). Dry bean was more sensitive to dicamba at the V2 compared with the V8 application timing, 14 DAT (Table 2). Injury from dicamba continued to progress and was as high as 46% and 38% from the 10% rate for the V2 and V8 application timings, respectively (Figure 1B). Additional injury symptoms included stem twisting or epinasty and were consistent with symptoms described by Lyon and Wilson (Reference Lyon and Wilson1986) and Hatterman-Valenti et al. (Reference Hatterman-Valenti, Endres, Jenks, Ostlie, Reinhardt, Robinson, Stenger and Zollinger2017). However, by 28 DAT, injury was highest from dicamba applications at V8 compared with V2-stage dry bean. The I20 values were 0.8% and 1.5% of the dicamba field use rate for the V2 and V8 application timings, respectively, 14 DAT and were 3.8% and 2.0%, respectively, 28 DAT (Table 2).
The higher injury ratings observed from dicamba applications to V8 dry bean 28 DAT may have been due to slower growth as dry bean transitioned from vegetative to reproductive stages (Fageria and Santos Reference Fageria and Santos2008). Although the I20 values for dicamba increased from 14 to 28 DAT, there were little to no signs of recovery from dicamba injury at the 10% rate (56 g ae ha−1) (Figure 1C). At the I20 rate, dry bean plants exhibited death of axial growing points as well as callous formation on stems. Hatterman-Valenti et al. (Reference Hatterman-Valenti, Endres, Jenks, Ostlie, Reinhardt, Robinson, Stenger and Zollinger2017) also noted these symptoms 20 DAT when pinto and navy bean were treated at R1 with 44 g ae ha−1 of dicamba.
Unlike injury from dicamba, when dry bean was exposed to 2,4-D at rates ranging from 0.1% to 10% (i.e., 1.12 to 112 g ae ha−1), there were no differences in injury between dry bean class or application timing (Table 2). I20 values for 2,4-D injury to dry bean averaged 4.5%, 9.7,% and greater than 10% of the field use rate at 7, 14, and 28 DAT, respectively. The higher I20 values at the later evaluation timings demonstrate dry bean’s ability to recover from 2,4-D injury over time. This has also been demonstrated with 2,4-D injury to soybean. Robinson et al. (Reference Robinson, Simpson and Johnson2013) reported that I20 values for 2,4-D injury to soybean increased from 6.8% to 9.7% at 14 and 28 DAT, respectively.
Canopy Development
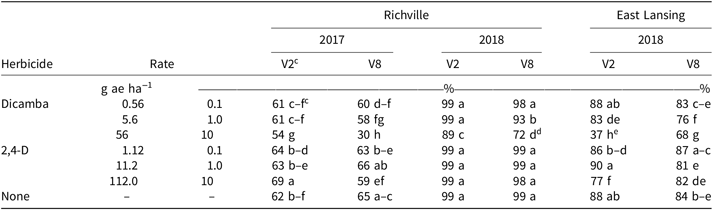
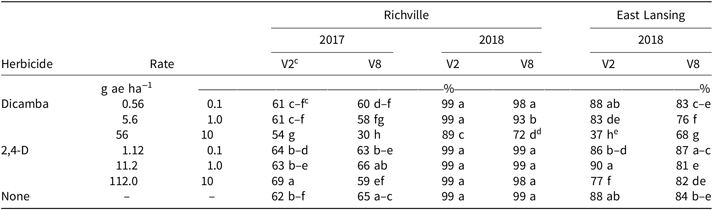
Overall, dry-bean canopy development was assessed on the basis of light interception, and this varied between site-years. Dry bean canopy was evaluated 55 DAP and those plots not treated with a herbicide intercepted 64%, 99%, and 86% of the sunlight for Richville in 2017, Richville in 2018, and East Lansing in 2018, respectively (Table 3). Canopy development was not measured in East Lansing in 2017. The differences in canopy development between site-years is most likely a reflection of precipitation within the 30 days prior to the canopy measurement. At Richville in 2018, where light interception was nearly complete (99%), 13.7 cm of rainfall occurred in the 30 days before measurement (Table 1). Rainfall during this period was 2.8 and 4 cm for Richville in 2017 and East Lansing in 2018, respectively.
Canopy development (based on light interception) of dry bean 55 days after planting at Richville, MI, in 2017 and 2018, and East Lansing, MI, in 2018, when V2 and V8 dry bean were exposed to dicamba and 2,4-D.a, b
a Data are presented as the herbicide treatment by application timing interaction and were combined over dry bean class, unless otherwise noted.
b Canopy development was measured 55 d after planting, which was 27 and 20 d after treatment for the V2 and V8 application timings, respectively.
c Means followed by the same letter within a site-year are not significantly different (α ≤ 0.05).
d There was a significant interaction including dry bean class for the 10% rate of dicamba at the V8 timing. Light interception was greater for black bean (76%) than navy bean (68%).
e There was a significant interaction including dry bean class for the 10% rate of dicamba at the V2 timing. Light interception was greater for black bean (51%) than navy bean (24%).
Dicamba reduced canopy development in all three site-years. The high rate of dicamba (56 g ae ha−1) had the greatest impact, reducing light interception 8% to 51% compared with the untreated control (Table 3). In most cases, canopy development was reduced more from dicamba applications at V8 compared with V2 application timing. Differences in canopy development were also observed with the 1% rate of dicamba in two site-years. Dry bean exposed to dicamba from the V2 application timing had 7 d longer to recover from herbicide injury compared with the V8 application timing, because all measurements were taken 55 DAP. One exception was at East Lansing in 2018, where a greater reduction in canopy development occurred when the 10% rate of dicamba was applied to V2 dry bean. The high rate of 2,4-D (112 g ae ha−1) only reduced canopy development for the V2 application timing at East Lansing in 2018 (Table 3). Canopy light interception was 11% lower compared with the untreated control.
In general, there were no differences in canopy development between dry bean classes. However, at two locations, black bean had greater canopy light interception than did navy bean when exposed to 10% rates of dicamba for two of the application timings (Table 3). In East Lansing in 2018, at the V2 application, there was a 27% difference in light interception between the dry bean classes (P < 0.0001). This resulted in 24% and 51% light interception for navy bean and black bean, respectively. The same interaction occurred at Richville in 2018 when the 10% rate of dicamba was applied at V8. Light interception for navy bean was 68% and black bean was 76% (P = 0.01).
Maximum canopy development in dry bean has advantages for weed control and yield. Canopy development is essential for capturing higher levels of photosynthetically active radiation (PAR), and this has been associated with increased yield potential (Blackshaw et al Reference Blackshaw, Molnar, Muendel, Saindon and Li2000). Several studies have shown that PAR can be maximized through the use of narrower row widths (Blackshaw et al. Reference Blackshaw, Molnar, Muendel, Saindon and Li2000; Holmes and Sprague Reference Holmes and Sprague2013). Blackshaw et al. (Reference Blackshaw, Molnar, Muendel, Saindon and Li2000) reported that dry bean captured 25% more PAR when planted in 23-cm compared with 69-cm rows. This increase in PAR led to an improvement in weed control and dry bean yield. In our study, we found that dicamba injury to dry bean reduced canopy development by twice that amount, 51%, which likely would affect dry bean yield and increase difficulties for weed control.
Dry Bean Maturity
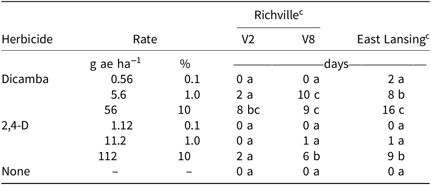
Dry bean maturity was similar between black and navy bean, regardless of herbicide treatment, application timing, or site-year. At Richville, maturity was influenced by the interaction of herbicide treatment and application timing (P < 0.0001). When dicamba was applied at the 10% rate, there was an 8- to 9-d delay to 50% maturity compared with the control (Table 4). Maturity was also delayed 10 d when the 1% rate of dicamba was applied to V8 dry bean. Applications of 2,4-D had less of an impact on dry bean maturity. Maturity to 50% was delayed by 6 d when the 10% rate of 2,4-D was applied to V8 dry bean. Lower rates of 2,4-D did not affect dry bean maturity (Table 4).
Delays in dry bean maturity to 50% at Richville and East Lansing, MI, in 2017 and 2018 when V2 and V8 dry bean were exposed to dicamba and 2,4-D.a, b

a Data were combined over dry bean class and application timings when interactions were not significant.
b Value estimates are for days delayed to 50% maturity compared with the untreated control.
c Means followed by the same letter within location are not significantly different α ≤ 0.05.
Dry bean maturity was not affected by application timing at East Lansing. In general, longer delays in maturity were documented at East Lansing than Richville. The longest delay in maturity was 16 d when dicamba was applied at the 10% rate (Table 4). Lower rates of dicamba also delayed maturity. The 1% rate of dicamba delayed dry bean maturity 8 d. Only the highest rate of 2,4-D delayed dry bean maturity (9 d) (Table 4).
At both locations, dry bean maturity was affected more by dicamba than 2,4-D. Our data support findings by Lyon and Wilson (Reference Lyon and Wilson1986) indicating dicamba caused longer delays in maturity than 2,4-D when applied at equal rates. Delays in maturity and complete crop loss have been reported in dry bean by Hatterman-Valenti et al. (Reference Hatterman-Valenti, Endres, Jenks, Ostlie, Reinhardt, Robinson, Stenger and Zollinger2017). Dicamba at a rate of 4.4 g ae ha−1 applied to R1 pinto bean resulted in abortion of initial flowers, and new flower formation did not develop until the end of the season, resulting in complete yield loss. Delays in navy bean maturity were also recorded from dicamba rates up to 44 g ae ha−1; however, bean could be harvested after chemical desiccation (Hatterman-Valenti et al. Reference Hatterman-Valenti, Endres, Jenks, Ostlie, Reinhardt, Robinson, Stenger and Zollinger2017).
Dry Bean Yield and Quality
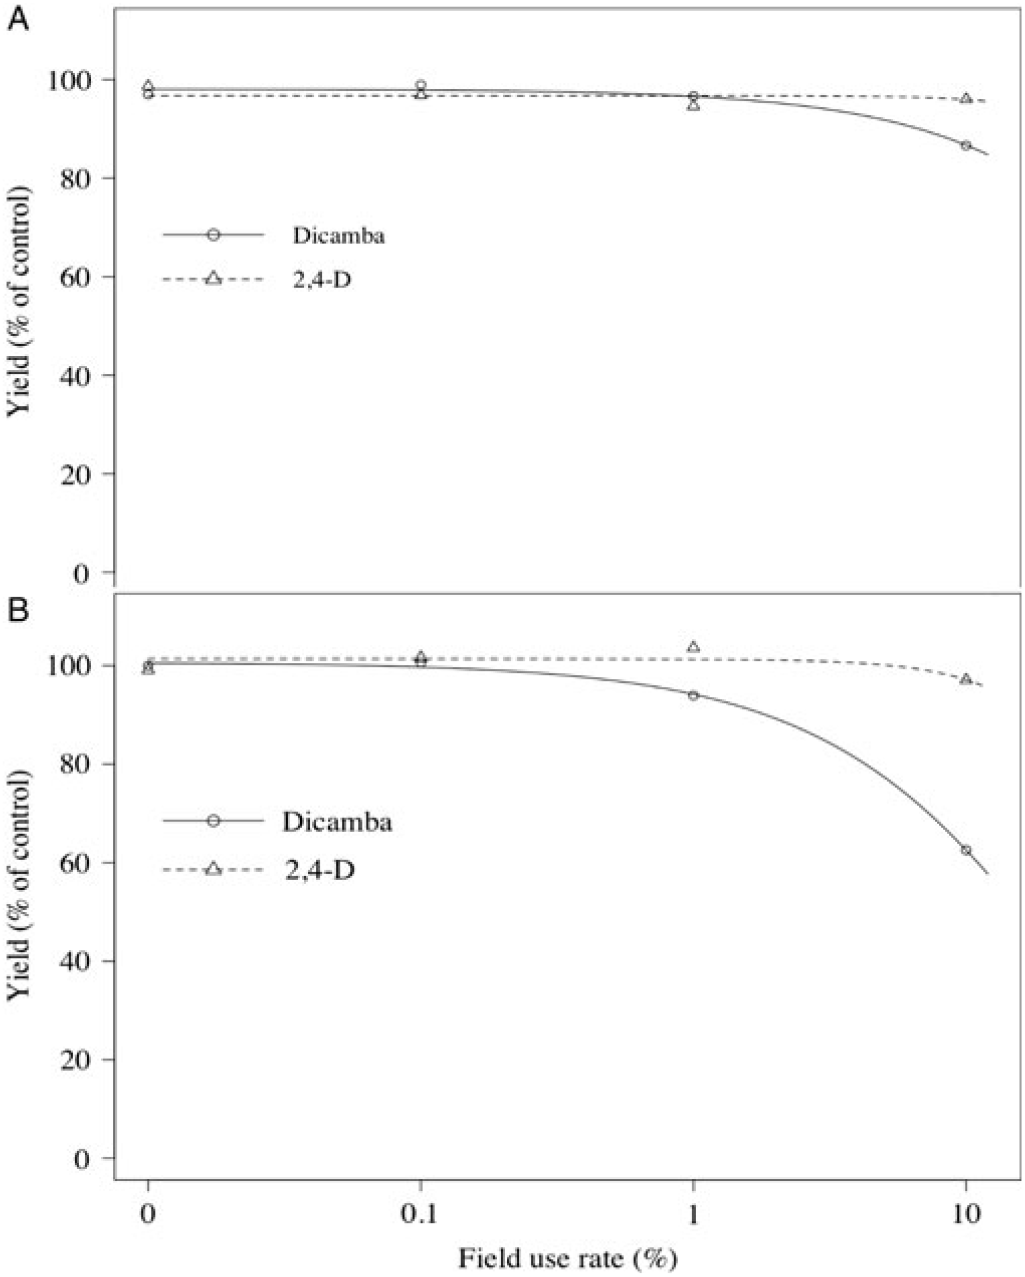
Few differences in dry bean yield existed between herbicide treatments (Figure 2). Yield was only reduced by the highest rate (10%) of dicamba and was 26% and 33% lower than the untreated control in 2017 and 2018, respectively. Yield was not affected by any rate of 2,4-D.
Dry bean yield as a percentage of the untreated control when exposed to multiple rates of dicamba and 2,4-D at V2 and V8 growth stage in (A) 2017 and (B) 2018. Rates based on standard rates of 560 and 1120 g ae ha−1 for dicamba and 2,4-D, respectively. Data were combined over dry bean class and Richville and East Lansing, MI, locations.

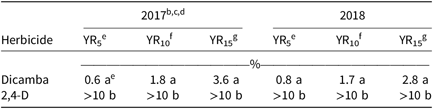
To help explain the impact of different dicamba and 2,4-D rates on dry bean yield, the effective dose required to reduce yields 5%, 10%, and 15% were calculated (Figure 2; Table 5). Regardless of dry bean class, application timing, location, or year, the effective dose to reduce dry bean yield up to 15% was always greater than the highest rate of 2,4-D tested (i.e., >112 g ae ha−1) (Table 5). Although previous dry bean studies did not report yield loss predictions from various rates of 2,4-D, Robinson et al. (Reference Robinson, Simpson and Johnson2013) estimated that 87 g ae ha−1 (8% of the field-use rate) would reduce soybean yield 5% when exposure occurred during the vegetative stage of growth. Unlike 2,4-D, effective doses of dicamba to reduce yield 5%, 10%, and 15% were in the rate range tested. Dicamba rates estimated to reduce dry bean yield 5%, 10%, and 15% were 0.6%, 1.8%, and 3.6% of a field use rate (3.3, 10.1, and 20.0 g ae ha−1, respectively), respectively, in 2017 (Table 5). Although dry bean yields generally were higher in 2018, dicamba rate estimates for yield reductions were similar between the two years. Estimated dicamba rates were 0.75%, 1.7%, and 2.8% (4.2, 9.5, 15.6 g ae ha−1, respectively) for 5%, 10,% and 15% yield reductions. To our knowledge, no dry bean studies have reported dicamba rate estimates for yield reductions. However, Kniss (Reference Kniss2018) conducted a meta-analysis of published research on soybean yield losses from dicamba. Reported yield loss from dicamba exposure in soybean at the vegetative stage was variable and estimated rates to affect yield 5% ranged from 1.6 to 97 g ae ha−1 (0.28% to 17% of the field-use rate).
Estimates of dicamba and 2,4-D doses needed to reduce dry bean yield 5%, 10%, and 15%.a

a Data were combined over locations, dry bean classes, and application timings.
b Estimates are presented as a % of the field use rate of dicamba at 560 g ae ha−1 and 2,4-D choline at 1,120 g ae ha−1.
c Estimates of YR5-15 were generated and compared using the DRC package and EDcomp function in R (Figure 2).
d Means within the same column followed by the same letter are not significantly different (α ≤ 0.05).
e YR5, 5% yield reduction.
f YR10, 10% yield reduction.
g YR15, 15% yield reduction.
The higher level of sensitivity dry bean has to dicamba than 2,4-D supports research reported by Lyon and Wilson (Reference Lyon and Wilson1986). When dicamba and 2,4-D were sprayed at V2, with rates up to 112 g ae ha−1 for both herbicides, only that highest rate of dicamba reduced yield by 70%. However, dry bean was more sensitive to dicamba and 2,4-D when exposed in the reproductive growth stages (Lyon and Wilson Reference Lyon and Wilson1986). This was also confirmed by Hatterman-Valenti et al. (Reference Hatterman-Valenti, Endres, Jenks, Ostlie, Reinhardt, Robinson, Stenger and Zollinger2017), who reported yield losses in navy bean were 56% from 17.9 g ae ha−1 applied at R1.
Seed Weight and Germination
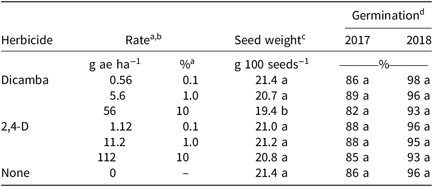
Interactions with years, locations, or application timings did not exist for dry-bean seed weight. Only the main effects of herbicide treatment and dry bean class were significant. Dicamba at the 10% rate was the only herbicide treatment that affected dry-bean seed weight (Table 6). This was also the only treatment that reduced dry bean yield. Seed weight of dry bean exposed to the 10% rate of dicamba was reduced 10% compared with the untreated control.
Main effect of herbicide treatment on seed weight and black bean germination after harvest when exposed to multiple rates of dicamba and 2,4-D at V2 and V8 growth stages in Richville and East Lansing, MI.

a Rates based on standard rates of 560 and 1120 g ae ha−1 for dicamba and 2,4-D, respectively.
b Means within the same column followed by the same letter are not significantly different α ≤ 0.05.
c Data were combined over site-years and dry bean class.
d Data were combined over site-years.
Germination was tested only for the black bean harvested from this research. Neither application timing nor herbicide treatment affected black bean germination in either year, even though overall germination rates were higher from seed harvested in 2018 compared with 2017 (Table 6). Other researchers have found that dicamba applied to dry bean at V2 can reduce harvested seed germination (Lyon and Wilson Reference Lyon and Wilson1986). However, this was only observed when dicamba was applied at 112.5 g ae ha−1, which was twice the amount of dicamba we tested. Lyon and Wilson (Reference Lyon and Wilson1986) also found that when dicamba applications were made to dry bean after flowering (R1), larger reductions in seed viability were observed. Our findings were more similar to those of Auch and Arnold (Reference Auch and Arnold1978), who reported soybean seed germination was not affected when dicamba, at rates up to 56 g ae ha−1, was applied in the vegetative stage of growth.
Overall, both classes of dry bean responded similarly to dicamba and 2,4-D in terms of injury, canopy development, maturity, and yield. The timing of application often did not affect dry bean response when applied during vegetative growth stages. Previous research, however, indicated dry bean is more sensitive to dicamba and 2,4-D once reproductive growth begins (Lyon and Wilson Reference Lyon and Wilson1986). When applied at equal percentages of their field-use rate and compared across all response variables, dry bean was more sensitive to dicamba than to 2,4-D. Dicamba at rates as low as 0.6% (3.36 g ae ha−1) reduced dry bean yield. This rate is similar to what has been reported as possible dicamba residue levels found in a sprayer, even after following recommended sprayer clean-out procedures (Boerboom Reference Boerboom2004). This is a concern for dry-bean producers because direct yield loss is possible even when clean-out procedures are followed. In the event that a sprayer is not cleaned out properly, dry bean could be exposed to even higher rates of dicamba and, thus, result in higher yield loss. Although no rate of 2,4-D tested caused direct yield loss, significant delays in maturity did occur. Indirect yield losses could result from harvest difficulties influenced by delayed maturity and erratic precipitation patterns during the harvest season. Furthermore, dry bean currently does not have established maximum residue limits for dicamba or 2,4-D residues that may be present in the harvested seed after exposure. Research needs to examine the potential for residues of these herbicides in harvested dry bean seed.
Acknowledgements
The authors thank Gary Powell, Brian Stiles, Paul Horny, and Dennis Fleischmann for their technical assistance in the completion of this research. This research received no specific grant from any funding agency, or commercial or not-for-profit sectors. No conflicts of interest have been declared.