Introduction
A deeper understanding of habitat–fauna associations in coastal environments improves ecosystem-based fisheries management (Pikitch et al., Reference Pikitch, Santora, Babcock, Bakun, Bonfil, Conover, Dayton, Doukakis, Fluharty, Heneman, Houde, Link, Livingston, Mangel, McAllister, Pope and Sainsbury2004; Francis et al., Reference Francis, Hixon, Clarke, Murawski and Ralston2007). Kelp species are distributed across over one-third of the world's coastlines (Wernberg et al., Reference Wernberg, Krumhansl, Filbee-Dexter, Pedersen and Sheppard2019; Jayathilake & Costello, Reference Jayathilake and Costello2020), forming extensive and highly productive forests in many regions (Smale et al., Reference Smale, Burrows, Moore, O' Connor and Hawkins2013; Krumhansl et al., Reference Krumhansl, Okamoto, Rassweiler, Novak, Bolton, Cavanaugh, Connell, Johnson, Konar, Ling, Micheli, Norderhaug, Pérez-Matus, Sousa-Pinto, Reed, Salomon, Shears, Wernberg, Anderson, Barrett, Buschmann, Carr, Caselle, Derrien-Courtel, Edgar, Edwards, Estes, Goodwin, Kenner, Kushner, Moy, Nunn, Steneck, Vásquez, Watson, Witman and Byrnes2016). By providing biogenic habitat and altering environmental conditions, they promote local biodiversity and underpin ecosystem structure and functioning (Steneck et al., Reference Steneck, Graham, Bourque, Corbett, Erlandson, Estes and Tegner2002; Teagle et al., Reference Teagle, Hawkins, Moore and Smale2017). Moreover, kelp forests offer vital foraging and nursery habitat for a wide range of ecologically or socioeconomically important fauna, including shellfish, finfish, marine mammals and sea birds (Steneck et al., Reference Steneck, Graham, Bourque, Corbett, Erlandson, Estes and Tegner2002; Smale et al., Reference Smale, Burrows, Moore, O' Connor and Hawkins2013; Bennett et al., Reference Bennett, Wernberg, Connell, Hobday, Johnson and Poloczanska2016). In doing so, they form critical habitats for inshore fisheries and are included within ecosystem-level management approaches in some regions (e.g. Lozano-Montes et al., Reference Lozano-Montes, Loneragan, Babcock and Jackson2011; Couceiro et al., Reference Couceiro, Robuchon, Destombe and Valero2012; Caselle et al., Reference Caselle, Rassweiler, Hamilton and Warner2015). However, compared with other coastal habitat types (e.g. corals, seagrasses, mangroves), the wider importance of kelp forests as habitat for fauna is poorly known (Lefcheck et al., Reference Lefcheck, Hughes, Johnson, Pfirrmann, Rasher, Smyth, Williams, Beck and Orth2019).
Studies linking kelp forests and fisheries species overwhelmingly focus on finfish (Bertocci et al., Reference Bertocci, Araújo, Oliveira and Sousa-Pinto2015), with just 10% focusing on crustaceans, despite the high economic value of crab and lobster fisheries in many regions. Moreover, just 8% of studies explicitly linking kelp and fisheries species have been conducted in Europe (Bertocci et al., Reference Bertocci, Araújo, Oliveira and Sousa-Pinto2015), reflecting a wider paucity in kelp forest ecology in the region compared with, for example, Australia and North America (Smale et al., Reference Smale, Burrows, Moore, O' Connor and Hawkins2013). For habitat-fauna associations more generally, observational and manipulative studies have shown that a range of commercial fisheries species utilize kelp forests for shelter, nursery grounds or foraging areas (Holbrook et al., Reference Holbrook, Carr, Schmitt and Coyer1990; Bologna & Steneck, Reference Bologna and Steneck1993; Norderhaug et al., Reference Norderhaug, Christie, Fosså and Fredriksen2005; Furness & Unsworth, Reference Furness and Unsworth2020).
In the NE Atlantic, Laminaria hyperborea (Gunnerus) Foslie 1884 dominates rocky subtidal reefs along wave-exposed coastlines, stretching from the Arctic southwards to the Iberian Peninsula (Smale et al., Reference Smale, Burrows, Moore, O' Connor and Hawkins2013; Assis et al., Reference Assis, Lucas, Bárbara and Serrão2016; Smale & Moore, Reference Smale and Moore2017). Despite the widespread distribution and ecological importance of these kelp forests, information on the structure of associated faunal populations and assemblages remains relatively limited. The comparative lack of robust ecological data from these habitats (compared with intertidal shores or seagrass meadows, for example) partly stems from the logistical issues associated with sampling wave-exposed shallow rocky reefs and the costs and challenges associated with scientific or commercial scuba diving (Smale et al., Reference Smale, Burrows, Moore, O' Connor and Hawkins2013). Moreover, while fisheries-related data (e.g. tonnage or value of landings) are useful, they are generally aggregated across coarse spatial scales that include a range of habitat types and are heavily influenced by fishing effort and location. Therefore, fisheries-independent data collected across multiple spatial scales is needed to generate robust baselines and to evaluate the importance of kelp forests as nursery and foraging habitat for commercially important fauna.
Here we used three sampling methods, Underwater Visual Census (UVC), Baited Remote Underwater Video Surveys (BRUVs) and deployment of prawn pots (hereafter potting), to examine kelp habitat use by commercially important crustacean species in the UK. We conducted surveys at 12 sites that spanned 9° of latitude and a 2.5°C gradient in ocean temperature (Smale et al., Reference Smale, Burrows, Evans, King, Sayer, Yunnie and Moore2016, Reference Smale, Pessarrodona, King, Burrows, Yunnie, Vance and Moore2020b; Smale & Moore, Reference Smale and Moore2017). The overall objectives of the study were to (i) evaluate spatial variability in the presence and density of crustaceans in UK kelp forests, (ii) assess the usefulness of different sampling techniques for these key crustacean species, and (iii) generate a robust baseline of crustacean population density and size structure at kelp forest sites against which to detect future changes.
Materials and methods
Study region
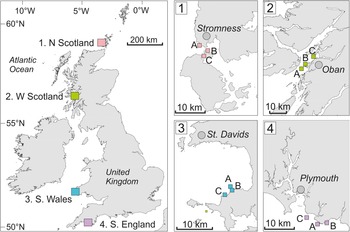
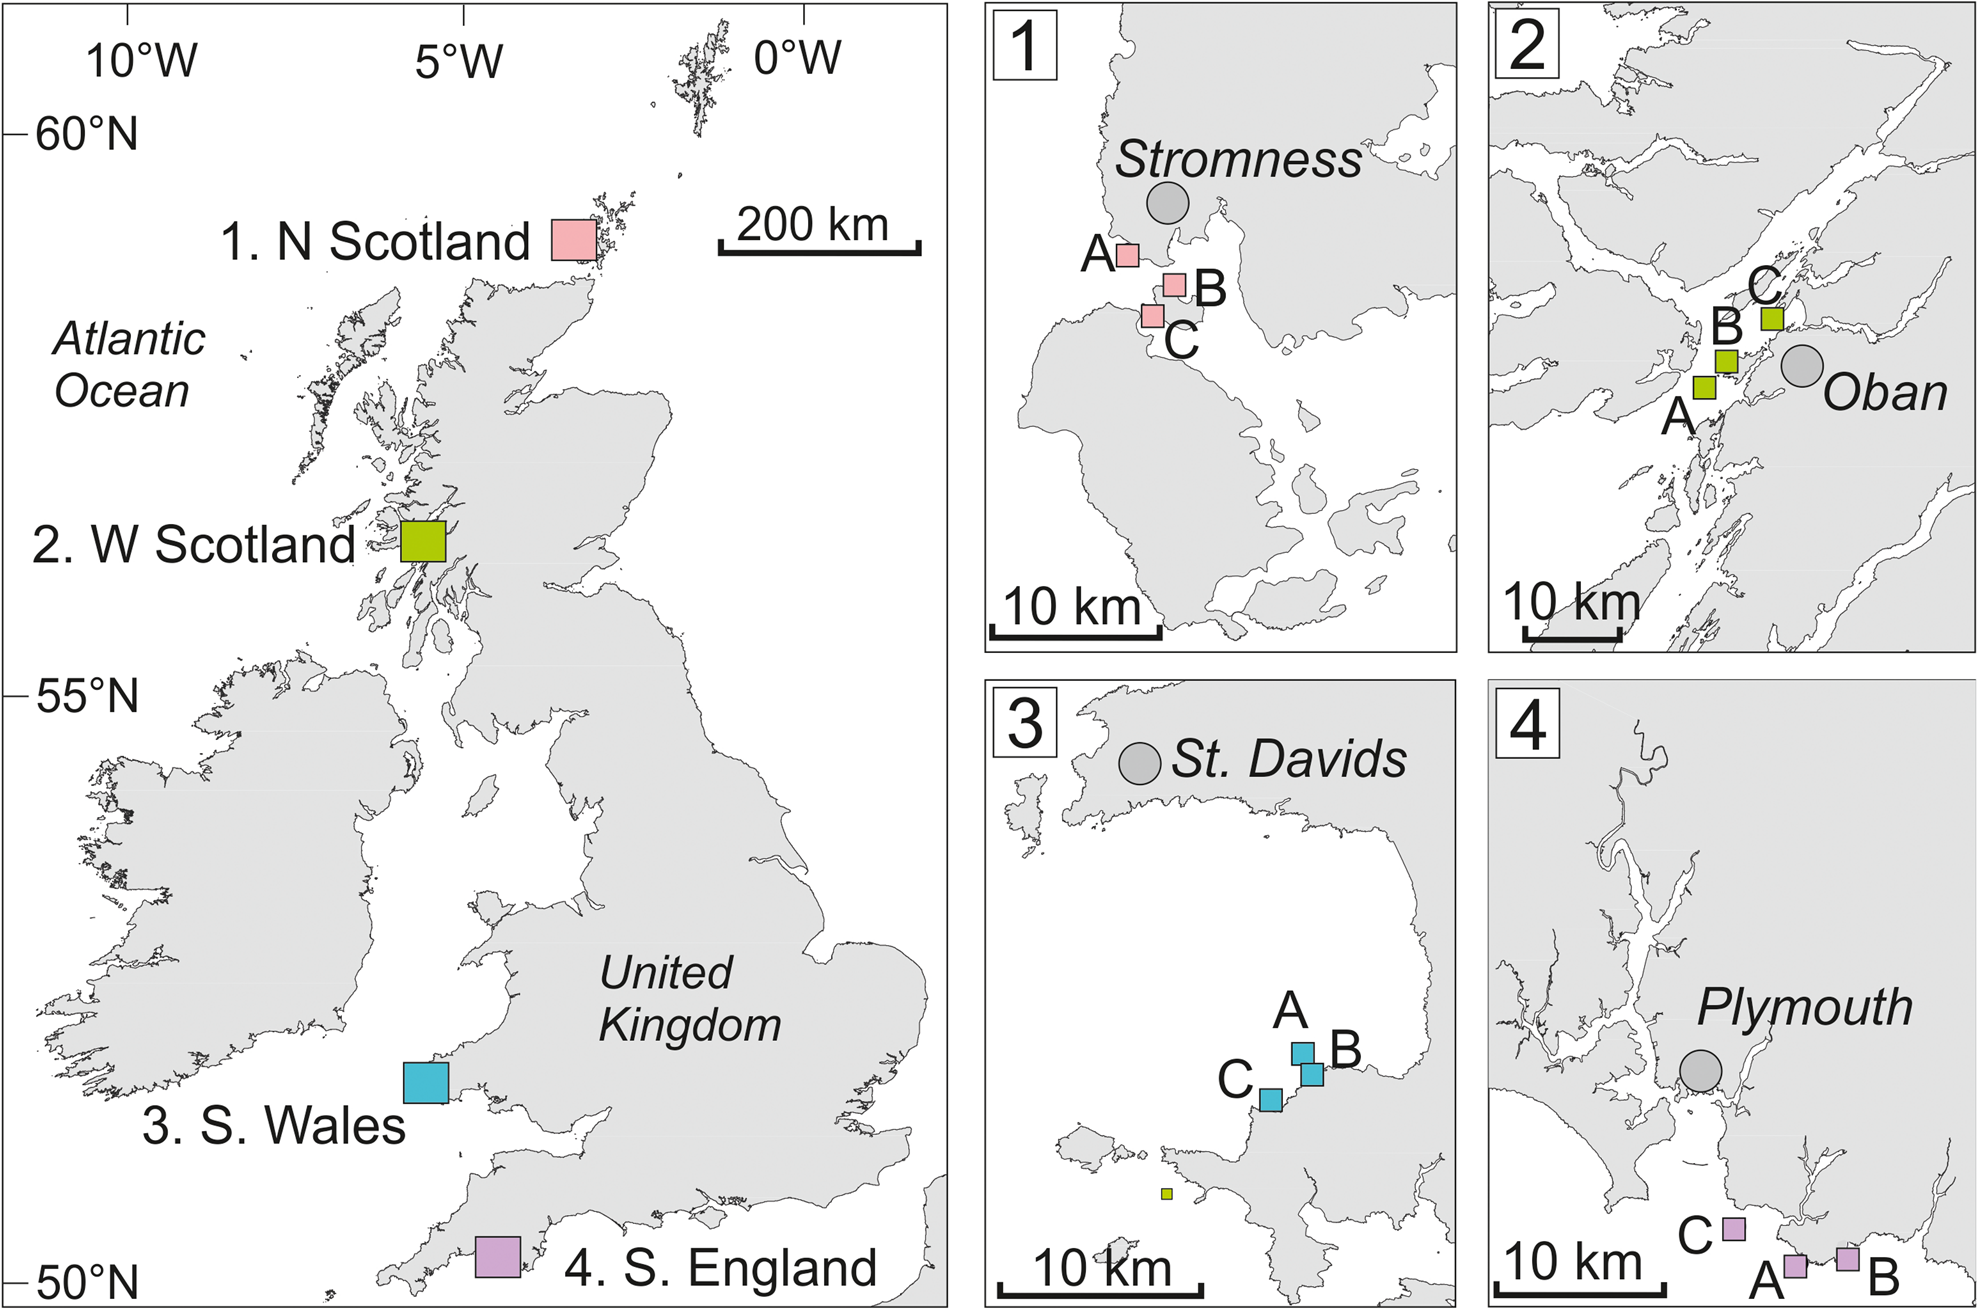
We examined the presence and abundance of commercially important crustaceans at 12 shallow subtidal reef sites in the UK (Figure 1). Three sites were nested within each of four established study regions in the UK; regions were between 180 and 500 km apart and spanned a latitudinal gradient of ~9°. Within regions, sites (1–13 km apart) were selected to be representative of the wider region (in terms of coastal geomorphology) and not obviously influenced by localized anthropogenic activities (e.g. sewage outfalls, fish farms). In the UK, L. hyperborea coexists or is outcompeted by other kelp species (e.g. Saccharina latissima) in sheltered conditions. Therefore, moderately to fully exposed sites on ‘open coast’ (as opposed to sheltered bays or sea lochs) were selected to ensure selection of largely monospecific L. hyperborea forests. Even so, sites within each region were generally fully wave-exposed (site A) to partially protected (site C). Full details on wave exposure (and other environmental factors) are provided in Smale et al. (Reference Smale, Epstein, Hughes, Mogg and Moore2020a), but (log)wave fetch ranged from 3.0–4.1 km across sites (as determined by Burrows, Reference Burrows2012). Nutrients were not measured but the study area within the NE Atlantic is not characterized by major upwelling regimes, and previous snapshot sampling at our study sites and longer time series within the regions shows that nutrient concentrations are comparable across this gradient with no difference in key nutrient concentrations between our study sites (Pessarrodona et al., Reference Pessarrodona, Moore, Sayer and Smale2018; Smale et al., Reference Smale, Pessarrodona, King, Burrows, Yunnie, Vance and Moore2020b). Previous work at these study sites has shown that they are characterized by extensive kelp canopies dominated by L. hyperborea (Smale et al., Reference Smale, Burrows, Evans, King, Sayer, Yunnie and Moore2016; Smale & Moore, Reference Smale and Moore2017), which extend from the subtidal fringe to depths of ~20 m (Smith et al., Reference Smith, Moore, King and Smale2021a), and support rich and abundant assemblages of associated invertebrates and macroalgae (Teagle et al., Reference Teagle, Moore, Jenkins and Smale2018; Bué et al., Reference Bué, Smale, Natanni, Marshall and Moore2020; Smale et al., Reference Smale, Epstein, Hughes, Mogg and Moore2020a; King et al., Reference King, Moore, Wilding, Jenkins and Smale2021).
Main map (on left) shows positions of four study regions north Scotland (1), west Scotland (2), south Wales (3) and south England (4). Inset maps indicate the locations of the three study sites (A, B, C) within each region. Note that UVC was conducted at all three sites per region, whereas BRUV and pot deployments was conducted at only two sites per region (sites A and B).
Survey techniques
Commercially targeted crustaceans within kelp forest habitats were surveyed with three independent techniques: (i) diver-conducted underwater visual census (UVCs); (ii) deployment of benthic baited remote underwater videos (BRUVs); and (iii) deployment of baited prawn pots. This three-pronged approached allowed us to obtain a robust snapshot of crustacean populations utilizing kelp forests. All surveys and deployments were conducted at depths of 3–7 m (below chart datum) within kelp habitat. The expected list of commercially important crustacean species based on existing information and markets included Cancer pagurus (brown/edible crab), Necora puber (velvet swimming crab), Maja brachydactyla (spider crab), Homarus gammarus (European lobster) and Palaemon serratus (common prawn).
The UVCs were conducted along 25 × 2 m belt transects; divers recorded all visible target crustaceans, taking care to survey optimal microhabitats (e.g. crevices, overhangs, kelp stipes, etc). Three replicate transects were conducted at each site, orientated haphazardly to ensure they were conducted over kelp/reef habitat and to maximize spatial coverage. UVCs were conducted during daytime in summer (August/September) 2020 at all three sites within each region.
Benthic BRUVs were comprised of a concrete base, single camera (SJCAM 4000 action), a bait holder (positioned in front of the camera at a distance of 0.5 m), and a line and buoy to the surface. Prior to deployment, BRUVs were baited with a crushed mackerel (Scomber scombrus) to promote dispersal of the bait plume. A set of three replicate BRUV systems was deployed during daytime at each site, separated by at least 20 m. Video systems recorded for a duration of 60 min, which was deemed acceptable as the majority of species usually occur within the first 40–60 min of deployment (Unsworth et al., Reference Unsworth, Peters, McCloskey and Hinder2014). BRUV surveys were conducted in late summer (August –September) in both 2016 and 2017. However, due to adverse weather conditions, BRUVs were not deployed in south-west Wales in 2017. BRUVs were deployed at only two sites within each region (sites A and B). During analyses target species were identified and the section of footage with the highest abundances was noted, from which conservative measure of relative abundance MaxN was recorded for each species. MaxN is obtained by counting the maximum number of each species visible in a single frame (Cappo et al., Reference Cappo, Harvey, Malcolm and Speare2003; Langlois et al., Reference Langlois, Harvey, Fitzpatrick, Meeuwig, Shedrawi and Watson2010). Here, BRUVs across the two years (where available) were combined to examine spatial variability patterns.
Triplicate pots (baited with mackerel) were deployed at each site for ~24 h, after which time all fauna were identified, enumerated, measured (carapace width/length) and returned. Pots, which were standard commercial prawn pots (aperture diameter of 140 mm and mesh size 14 mm), were deployed in summer (August/September) 2020 at only two sites within each region (sites A and B).
Results
Commercially important crustacean species were recorded at every kelp forest site (Table 1). Necora puber (velvet swimming crab) was ubiquitous, whereas Cancer pagurus (brown crab), Maja brachydactyla (spider crab) and Homarus gammarus (European lobster) were recorded at five sites and Palaemon serratus (common prawn) observed at three sites (Table 1). The efficacy of the three different sampling approaches differed somewhat between target species (Table 1). While C. pagurus, N. puber and H. gammarus were detected by all three methods, M. brachydactyla was not recorded in pots and P. serratus was not observed by BRUVs. Across all sites and methods (using MaxN from BRUVs), a total of 327 individuals were recorded, of which 51% were N. puber and 24% C. pagurus.
Crustacean species listed by sites at which they were recorded and by method of detection (U = UVC, B = BRUV, P = potting)

Note that at site C in each region only UVC was conducted.
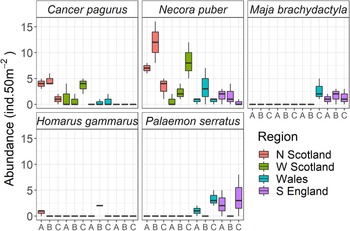
Data obtained from UVCs indicated that crustacean abundances were highly variable between species, regions and sites (Figure 2). Necora puber was the most abundant and commonly recorded species, with average densities ranging from <1 ind. 50 m−2 (S England site C) to ~12 ind. 50 m−2 (N Scotland site B). Cancer pagurus tended to be more abundant at sites in Scotland, whereas M. brachydactyla and P. serratus were only recorded in southern sites in Wales and England (Figure 2). Homarus gammarus was infrequently observed across the sites (Figure 2).
Box and whisker plots to show median (line), upper and lower quartiles (box), maximum and minimum (line) of crustacean densities at each site, as determined by UVC. A total of three 25 × 2 m belt transects were completed at each site.

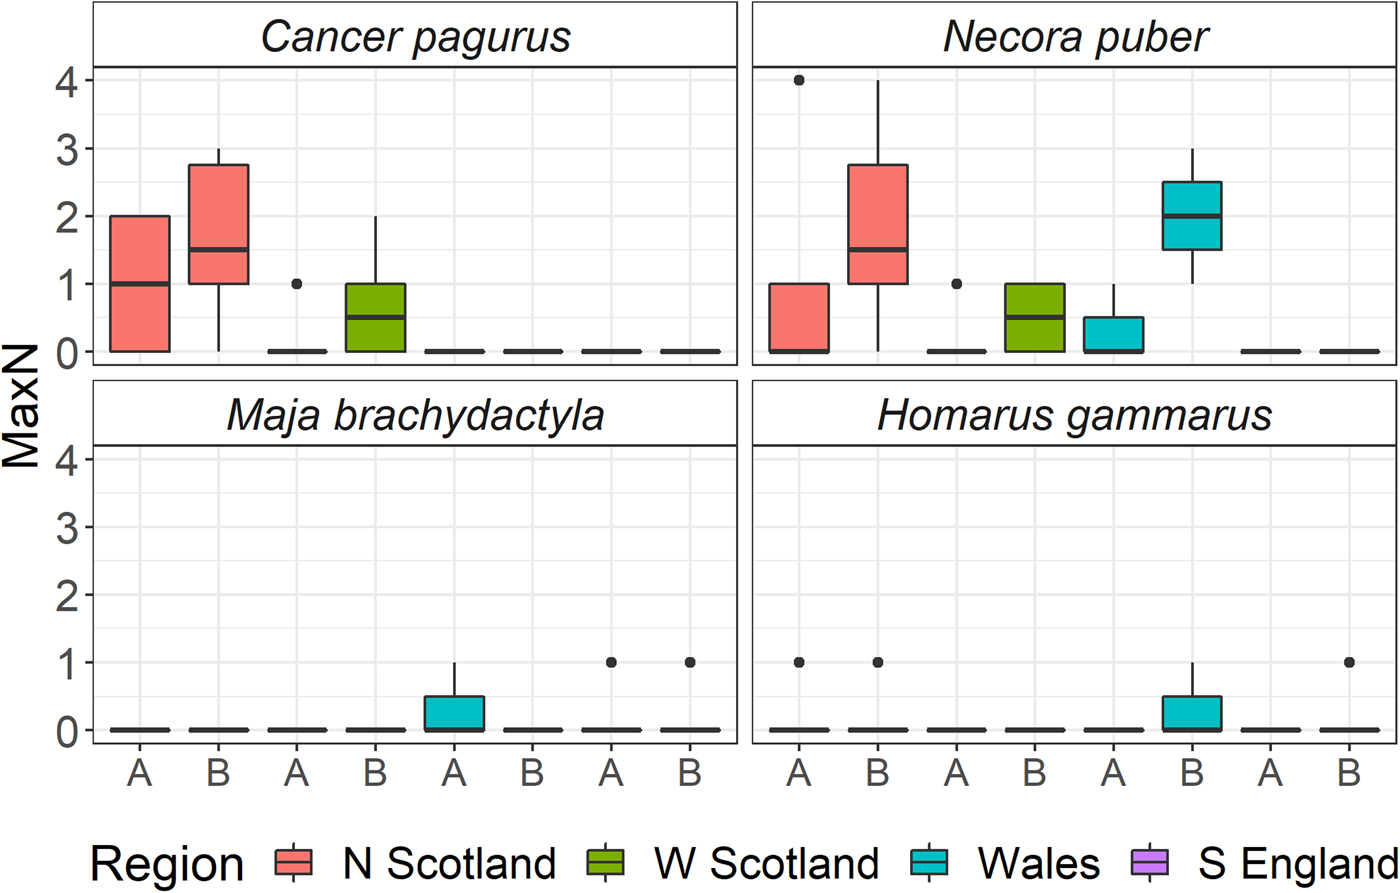
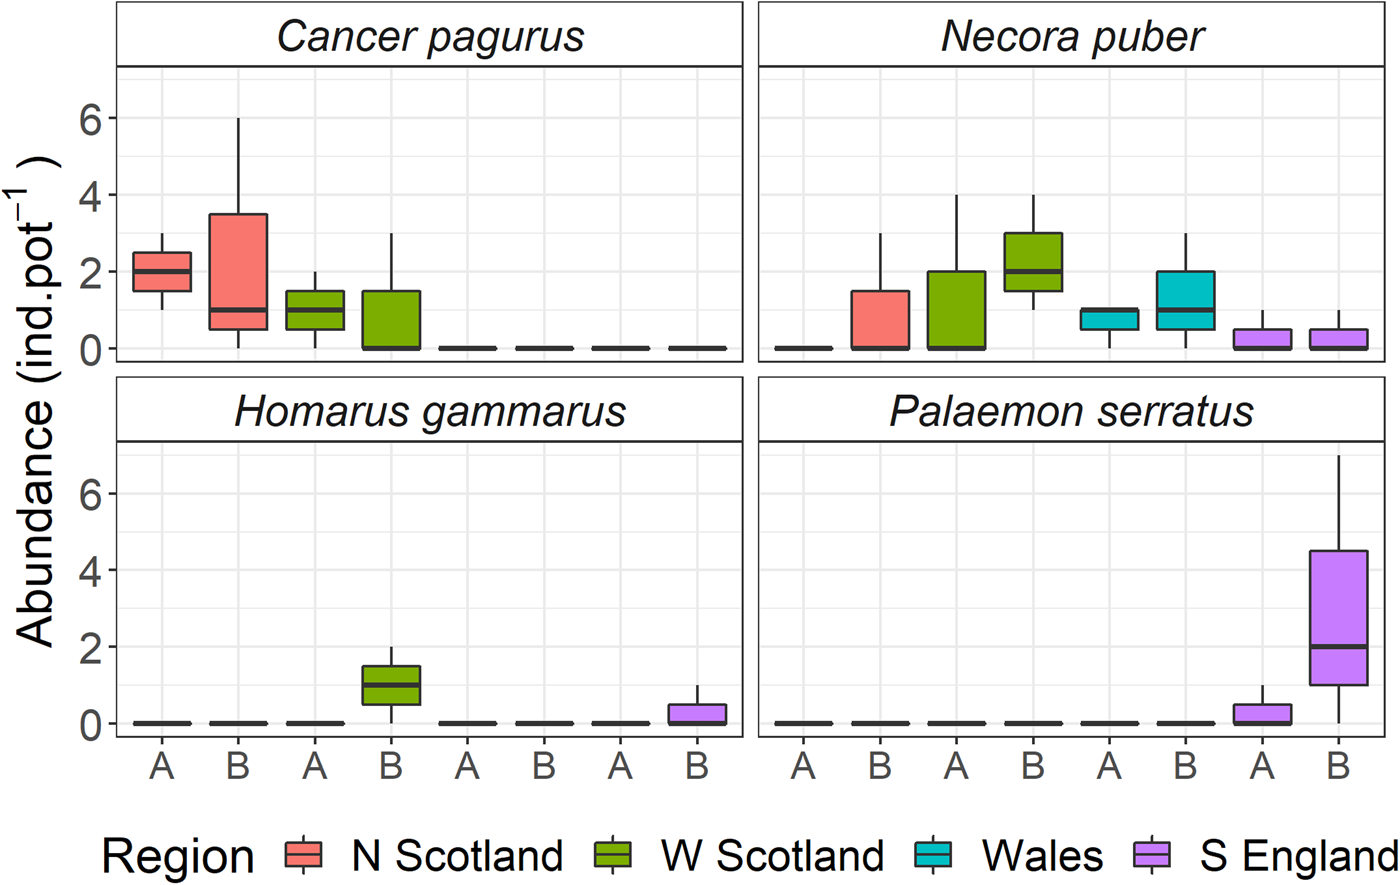
Abundance patterns obtained from BRUVs and pots were similar and corroborated UVCs, in that N. puber was in general the most abundant and commonly observed species, although C. pagurus was again relatively more abundant in the northern Scottish sites (Figures 3 and 4). Maja brachydactyla and H. gammarus were infrequently observed by BRUVs and rarely recorded in pots (Figures 3 and 4). P. serratus was only recorded in pots in southern England, where densities reached seven individuals per pot (Figure 4).
Box and whisker plots to show median (line), upper and lower quartiles (box), maximum and minimum (line), and outlier values (points) of crustacean densities at each site, as determined by BRUVs. A total of six BRUV deployments were conducted in N and W Scotland and S England (across both 2016 and 2017), whereas only three deployments were completed in S Wales (2016 only).

Box and whisker plots to show median (line), upper and lower quartiles (box), maximum and minimum (line), and outlier values (points) of crustacean densities at each site, as determined by potting (N = 3 per site).

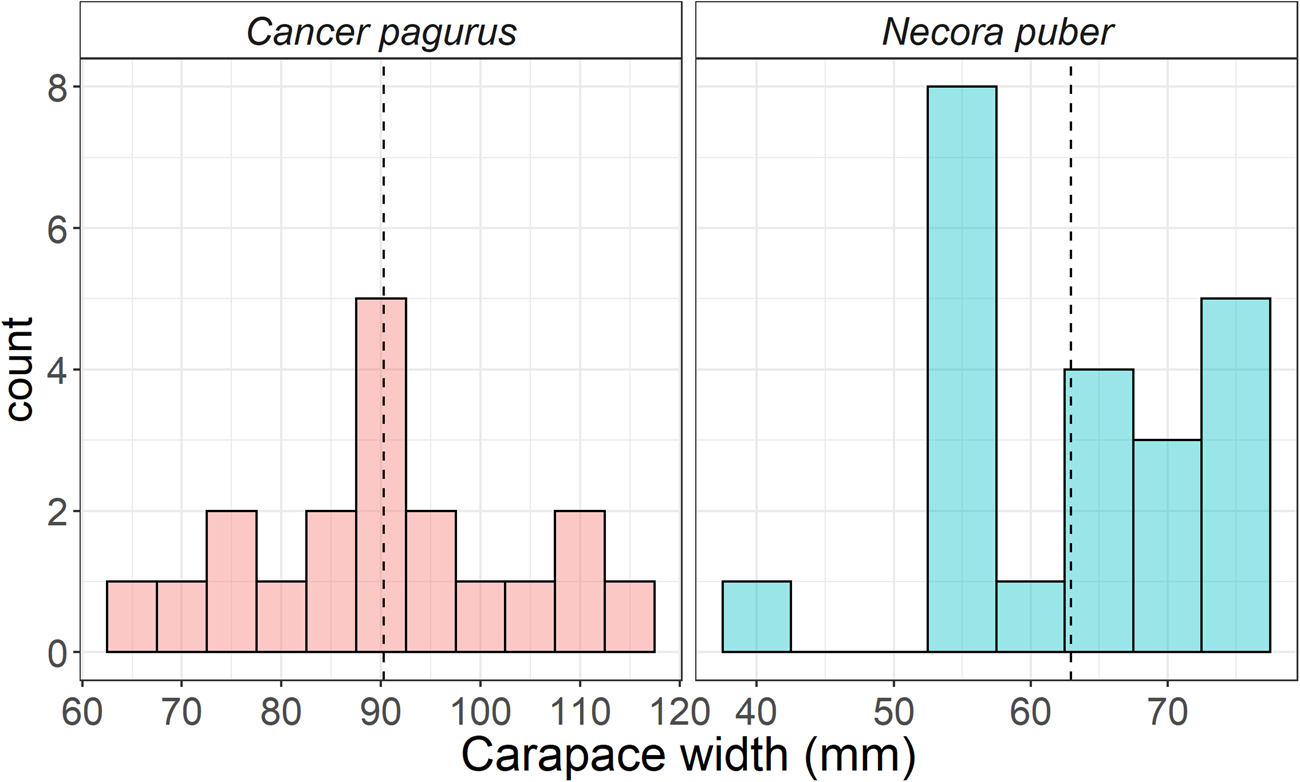
Across the study, the median carapace width of C. pagurus was 92 mm (Figure 5), with size frequency data indicating that individuals were smaller than the minimum landing size (MLS) for this species (140 mm in S Wales, 150 mm in N/W Scotland and S England, except for males in S England which is 160 mm). Similarly, the median carapace width of N. puber was 64 mm (Figure 5), which is lower than the MLS for adults (70 mm in N and W Scotland, 65 in S Wales and S England), indicating a prevalence of juvenile and sub-adults of this species. The median carapace length of the four H. gammarus individuals recorded in pots across the study was 95 mm (MLS is 90 mm in all regions).
Histogram of carapace width for all individuals sampled during potting surveys across the study for the two most common species. Dotted line indicates median carapace width.

Discussion
Commercially important crustacean species were recorded at every site, which strongly suggests that subtidal kelp forests dominated by Laminaria hyperborea offer valuable habitat for these species. The annual UK landings of these crustacean species is ~37,000 tonnes, with a total market value of ~£124 m (MMO, 2020), which means provision of favourable habitat represents an important ecosystem service offered by UK kelp forests. The crabs C. pagurus and N. puber, which together contribute around 85% of the ~37,000 tonnes of these species landed each year (MMO, 2020), were the most abundant and commonly recorded species across the study, again indicating the importance of kelp forest habitat for inshore regional fisheries.
The size distributions of the individuals sampled suggested these crustaceans were predominantly juveniles and sub-adults and therefore likely utilizing kelp forests as nursery grounds, perhaps before migrating offshore or to other habitats at a more mature life stage (Bennett & Brown, Reference Bennett and Brown2009; Mesquita et al., Reference Mesquita, Dobby, Pierce, Jones and Fernandes2020). Interestingly, the median carapace width of C. pagurus would suggest that the majority of individuals within these populations are not sexually mature (Haig et al., Reference Haig, Bakke, Bell, Bloor, Cohen, Coleman, Dignan, Kaiser, Pantin, Roach, Salomonsen and Tully2016), whereas the median carapace width of N. puber is indicative of a relatively older and more mature population (González-Gurriarán & Freire, Reference González-Gurriarán and Freire1994). However, a major caveat to this observation is that size structure was ascertained from individuals sampled in pots, which would have selected for smaller organisms due to the aperture size. Even so, qualitative observations of individuals sampled by both UVC and BRUVs provide further support to the finding that most individuals were juveniles or sub-adults. Clearly, kelp forests, as with other vegetated coastal habitats, serve as favourable nursery grounds by offering refuge from predators and a high quantity and diversity of food sources (Hines, Reference Hines1982; Bologna & Steneck, Reference Bologna and Steneck1993; Lefcheck et al., Reference Lefcheck, Hughes, Johnson, Pfirrmann, Rasher, Smyth, Williams, Beck and Orth2019). Subtidal reefs at these sites are generally complex and heterogeneous in structure (e.g. overhangs, boulders, crevices), and Laminaria hyperborea canopies are particularly dense (Pessarrodona et al., Reference Pessarrodona, Moore, Sayer and Smale2018; Smale et al., Reference Smale, Pessarrodona, King, Burrows, Yunnie, Vance and Moore2020b), which would offer numerous refugia from predators and, as such, favourable nursery habitat. Moreover, as kelp-associated assemblages of macroalgae and invertebrates are generally rich and abundant at these sites (Teagle et al., Reference Teagle, Hawkins, Moore and Smale2017; Bué et al., Reference Bué, Smale, Natanni, Marshall and Moore2020; Smale et al., Reference Smale, Epstein, Hughes, Mogg and Moore2020a; King et al., Reference King, Moore, Wilding, Jenkins and Smale2021), and the supply of detrital kelp and associated organisms is substantial (Smale et al., Reference Smale, Pessarrodona, King and Moore2021), food availability for crustacean populations is likely to be high. Our study aligns with previous studies conducted in other regions (Öndes et al., Reference Öndes, Emmerson, Kaiser, Murray and Kennington2017; Mesquita et al., Reference Mesquita, Dobby, Pierce, Jones and Fernandes2020), which also found a prevalence of smaller juvenile crabs in shallow coastal habitats, and suggests that the complex habitat formed by kelps provides shelter and resources.
The density of crustacean species varied considerably across all spatial scales, from region to site to replicate sampling unit. At the regional scale, C. pagurus was notably more abundant and commonly recorded in northern regions, whereas M. brachydactyla and P. serratus were only recorded in southern regions. Cancer pagurus is widely distributed along the coastline of north-west Europe and is abundant in south-west England and Wales, where it underpins significant regional fisheries (Brown & Bennett, Reference Brown and Bennett1980; Haig et al., Reference Haig, Bakke, Bell, Bloor, Cohen, Coleman, Dignan, Kaiser, Pantin, Roach, Salomonsen and Tully2016). As such, the reasons for the low density and occurrence of C. pagurus in southern kelp forests remain unclear and warrants further research, but could be related to differences in phenology and behaviour (Hunter et al., Reference Hunter, Eaton, Stewart, Lawler and Smith2013; Bakke et al., Reference Bakke, Larssen, Woll, Søvik, Gundersen, Hvingel and Nilssen2018), a higher prevalence of disease (Stentiford, Reference Stentiford2008) and/or higher historical and current fishing intensity (Eigaard et al., Reference Eigaard, Bastardie, Hintzen, Buhl-Mortensen, Buhl-Mortensen, Catarino, Dinesen, Egekvist, Fock, Geitner, Gerritsen, González, Jonsson, Kavadas, Laffargue, Lundy, Gonzalez-Mirelis, Nielsen, Papadopoulou, Posen, Pulcinella, Russo, Sala, Silva, Smith, Vanelslander and Rijnsdorp2016) in southern compared with northern sites. Increased sampling effort, in terms of replication and spatiotemporal coverage (see below), is needed to further explore this pattern. In contrast, M. brachydactyla and P. serratus exhibit warm-temperate distributions, being found towards their poleward range edge in northern UK (Abelló et al., Reference Abelló, Guerao, Salmerón and García Raso2014; Haig et al., Reference Haig, Ryan, Williams and Kaiser2014). As such, they are notably more common in the warmer waters around south-west England and Wales, where commercial fisheries are located, which would explain the higher abundance in these regions and the absences in northern regions. At smaller spatial scales (i.e. between-site and between-replicate), variability may be driven by recruitment and early mortality rates (Eggleston & Armstrong, Reference Eggleston and Armstrong1995; Daly & Konar, Reference Daly and Konar2008; Pardo et al., Reference Pardo, Cardyn and Garcés-Vargas2012), habitat structure (Martin & Oliver, Reference Martin and Oliver2000), and differences in variables such as wave exposure, competition and food availability (Smallegange et al., Reference Smallegange, van Noordwijk, van der Meer and van der Veer2009; Silva et al., Reference Silva, Hawkins, Boaventura, Brewster and Thompson2010; Hoskin et al., Reference Hoskin, Coleman, von Carlshausen and Davis2011).
The three survey techniques generated largely similar spatial patterns, particularly for the two most abundant species, but differed in their capacity to detect some of the target species. For example, M. brachydactyla was detected at four sites with UVCs and three sites with BRUVs, but was not detected at any site by potting. Similarly, P. serratus was observed at five sites with UVCs and two sites with potting, but was not detected with BRUVs. Clearly, different methodologies have differing sensitivities for certain species, based on their size, morphology and behaviour, as has been shown for finfish (Colton & Swearer, Reference Colton and Swearer2010; Lowry et al., Reference Lowry, Folpp, Gregson and Suthers2012) and other fauna (Spencer et al., Reference Spencer, Stoner, Ryer and Munk2005). As such, any survey effort or monitoring programme should incorporate a range of sampling techniques to reliably quantify crustacean assemblages.
Our survey was conducted over a large spatial scale but did not examine temporal variability and should therefore be considered a ‘snapshot’ of crustacean populations at these kelp forest sites. Repeated sampling across seasons and years is needed to assess the structure of crustacean populations and assemblages, and to reliably evaluate the importance of kelp forests as nursery and foraging grounds for these species. Crustacean populations are highly variable over time for a variety of reasons, including seasonal migrations (Bennett & Brown, Reference Bennett and Brown2009; Fahy & Carroll, Reference Fahy and Carroll2009), moulting and reproductive behaviour (Stone & O'Clair, Reference Stone and O'Clair2002; Hines et al., Reference Hines, Wolcott, González-Gurriarán, González-Escalante and Freire2009), and mass recruitment and mortality events (Mullen et al., Reference Mullen, Russell, Tucker, Maratea, Koerting, Hinckley, De Guise, Frasca, French, Burrage and Perkins2004; Galloway et al., Reference Galloway, Shanks, Groth, Marion and Thurber2017). For example, M. brachydactyla individuals undertake long-distance migrations into deeper waters on reaching sexual maturity (Corgos et al., Reference Corgos, Vermiso and Freire2006), whilst mass recruitment and mortality events of crabs and lobsters have been associated with extreme environmental conditions (e.g. marine heatwaves, see Smith et al., Reference Smith, Burrows, Hobday, Gupta, Moore, Thomsen, Wernberg and Smale2021b), both of which contribute to pronounced temporal variability in crustacean population density and size structure. Moreover, decapod crustaceans often exhibit nocturnal or crepuscular peaks in foraging activity (Ennis, Reference Ennis1984; Davenport et al., Reference Davenport, Jessopp, Harman, Micaroni and McAllen2021) and would have been underrepresented in our daytime sampling. Other aspects of the sampling approach, such as choice of bait and sampling gear, could have biased the findings towards certain taxa and size classes and, as such, the current study should form the basis of further work.
In summary, commercially important crustaceans were commonly observed in UK kelp forests distributed across 9° of latitude, with these habitats likely serving as favourable nursery and foraging grounds for juvenile and sub-adult individuals of multiple species. In addition to their considerable socioeconomic importance for regional fisheries, these crustacean species likely play an important ecological role within these ecosystems, particularly in terms of trophic linkages and foodweb dynamics. Further monitoring should incorporate a greater range of environmental conditions (i.e. across depth and wave exposure), a wider variety of habitat types (i.e. kelp forest vs seagrass meadow vs unvegetated) and sampling gear (i.e. fisheries-relevant), and greater temporal resolution (i.e. different times of day and year). Such an approach is needed to provide robust baselines against which to detect future changes (driven by ocean warming and fishing pressure, for example) and to inform management and conservation actions.
Acknowledgements
We thank all participants of ‘Team Kelp (UK)’ field expeditions (2014–2020), and Sula Divers and Tritonia dive teams for technical support.
Author contributions
DS and PM conceived the study, led fieldwork and secured funding. MB and NK contributed to fieldwork, analysed samples and data. DS led manuscript development with contributions and significant intellectual input from all authors.
Financial support
DS is supported by a UKRI Future Leaders Fellowship (MR/S032827/1). PM is supported by a NERC-Newton Fund grant NE/S011692/2.