INTRODUCTION
Intertidal ecosystems are especially vulnerable to oil pollution since oil commonly accumulates in littoral areas leading to physical smothering and chemical poisoning (Raffaelli & Hawkins, Reference Raffaelli, Hawkins, Raffaelli and Hawkins1996). Disturbance and recovery of communities after accidental spills can vary considerably depending on the spill magnitude and nature of the oil spilled (Antrim et al., Reference Antrim, Thom, Gardiner, Cullinan, Shreffler and Bienert1995), the use of dispersants or mechanical cleaning (Crothers, Reference Crothers1983), the timing and intensity of the spill relative to the timing and intensity of reproduction and subsequent recruitment (Forde, Reference Forde2002), species sensitivity (Crowe et al., Reference Crowe, Thompson, Bray and Hawkins2000) and habitat sensitivity (Jackson et al., Reference Jackson, Cubit, Keller, Batista, Burns, Caffey, Caldwell, Garrity, Getter, González, Guzman, Kaufmann, Knap, Levings, Marshall, Steger, Thompson and Weil1989). Despite these differences, the noxious effects of oil spills on intertidal animal populations are similar and well chronicled in environmental disasters such as the ‘Torrey Canyon’ (Southward & Southward, Reference Southward and Southward1978), ‘Nella Dan’ (Simpson et al., Reference Simpson, Smith and Pople1995), ‘Exxon Valdez’ (Peterson et al., Reference Peterson, Rice, Short, Esler, Bodkin, Ballachey and Irons2003), ‘Braer’ (Newey & Seed, Reference Newey and Seed1995), ‘Sea Empress’ (Crump et al., Reference Crump, Morley and Williams1998), and ‘Erika’ (Le Hir & Hily, Reference Le Hir and Hily2002) oil spills. Research coincides with initial biological effects: removal of key intertidal grazing species (limpets, littorinid snails and/or sea urchins) followed by a generalized growth of opportunistic algae. In contrast, absence or minimal impact is also documented in littoral ecosystems, such as after the ‘Antonio Gramsci’ (Bonsdorff, Reference Bonsdorff1981) and the ‘Tebar V’ (Lopes et al., Reference Lopes, Milanelli, Prosperi, Zanardi and Truzzi1997) oil spills.
In November 2002, the ‘Prestige’ oil tanker carrying more than 77,000 tons of heavy fuel oil sank off the Galician coast, north-west of Spain. Following the wreckage, the tanker initially released 10,000 tons of oil, but the initial catastrophe worsened after the sinking as the wrecked ship gradually released the remaining fuel resulting in a series of oil waves for 10 months (González et al., Reference González, Uriarte, Pozo and Collins2006). Due to the prevailing winds and ocean currents, the oil reached extensive areas of the Bay of Biscay as well as Portuguese coasts affecting mainly the shoreline, where much of the spilled fuel was deposited (González et al., Reference González, Uriarte, Pozo and Collins2006; Acuña et al., Reference Acuña, Puente, Anadón, Fernández, Vera, Rico Ordás, Arrontes and Juanes2008). The arrival of oil to the Biscay coast was continuous with two main oil waves reaching the coast in January and September 2003, that generated an extensive, but not intense, fuel deposition in the intertidal zone (ORBANKOSTA, 2004).
Some previous investigations have focused on rocky intertidal assemblages after the ‘Prestige’ oil spill. In the most impacted area on the Galician coast, Vazquez et al. (Reference Vazquez, Urgorri, Ramil, Parapar, Cristobo and Freire2005) established a negative relation between per cent of substratum covered by the oil and the abundance of limpets Patella spp. Linnaeus, the barnacle Chthamalus montagui Southward and the mussel Mytilus galloprovincialis Lamarck. Recently, a genetic study has found a reduction in genetic diversity of the snail Littorina saxatilis (Olivi) (Piñeira et al., Reference Piñeira, Quesada, Rolán-Alvarez and Caballero2008). Rocky intertidal vegetation has also been under investigation. By contrast, there is a lack of evidence of impact on macroalgal assemblages of the entire affected area (Lobón et al., Reference Lobón, Fernández, Arrontes, Rico, Acuña, Anadón and Monteoliva2008; Díez et al., Reference Díez, Secilla, Santolaria and Gorostiaga2009a).
Monitoring for changes in the marine assemblages is beset with several difficulties (McIntyre & Pearce, Reference McIntyre, Pearce, McIntyre and Pearce1980) and often the sampling design decisions have influenced the outcomes of those investigations (Peterson et al., Reference Peterson, McDonald, Green and Wallace2001). The absence of pre-impact data together with the deficient knowledge of natural ecological variation at spatial and temporal scales, are serious weaknesses in the assessment of any environmental impact (Terlizzi et al., Reference Terlizzi, Benedetti-Cecchi, Bevilacqua, Fraschetti, Guidetti and Anderson2005). Furthermore, recovery from acute incidents is inevitably a long-term process, whereas monitoring studies are often too short-lived, circumstances which make fair evaluation of ecological response rather unachievable (Hawkins et al., Reference Hawkins, Gibbs, Pope, Burt, Chesman, Bray, Proud, Spence, Southward and Langston2002).
The peculiarity of the ‘Prestige’ oil spill gave us a unique opportunity to investigate a continuous impact over time of oil deposition on rocky intertidals. Although our study is unfortunately lacking pre-spill data, the nested sampling design allowed us to test whether faunal assemblages exposed to different intensities of oil disturbance differ in terms of diversity, total cover, key species cover and trophic guilds. In addition, our research provides quantitative data on intertidal faunal communities that were so far unavailable for the region and fills the gap of knowledge on spatio-temporal variability of rocky assemblages of the central sector of the Bay of Biscay, locally known as the Basque coast.
MATERIALS AND METHODS
The sampling methods described here were designed for an ecological study focused on the assessment of the effects of the oil on the rocky intertidal benthic system (flora and fauna) on the Basque coast. The results of the phytobenthic component have recently been published (Díez et al., Reference Díez, Secilla, Santolaria and Gorostiaga2009a).
Study area
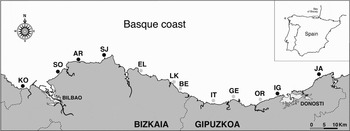
The Basque coast is located in the North Atlantic, Western Europe. It stretches for approximately 150 km along the south-eastern corner of the Bay of Biscay (41°53′N to 43°40′N and 01°40′W to 09°20′W) (Figure 1). Wave action is predominantly from the north-west. The coast is delimited by moderate to high cliffs (20–150 m) (Pascual et al., Reference Pascual, Cearreta, Rodriguez-Lázaro, Uriarte, Borja and Collins2004). Tides are semidiurnal and the maximum range during spring tides is 4.5 m. Mean water surface temperature ranges between 12°C in February and 22°C in August (Valencia et al., Reference Valencia, Franco, Borja, Fontán, Borja and Collins2004).
Study area showing the emplacement of the sampling locations. Kobaron (KO), Sopelana (SO), Arminza (AR), San Juan de Gaztelugatxe (SJ), Elantxobe (EL), Lekeitio (LK), Berriatua (BE), Itziar (IT), Getaria (GE), Orio (OR), Igueldo (IG) and Jaizkibel (JA). Grey and black dots: slightly and moderately affected locations, respectively. The inset shows the initial leaking area of the ‘Prestige’ spill (indicated by a plus symbol) and the study area (delimited by a rectangle) on the northern coast of Spain.

Target habitat and community
The habitat and community for investigation were selected on the basis of providing a homogeneous biotope along the coast to compare and assess the putative impact of oil. The rocky intertidal zone was selected for study as the Basque coast is 70% rocky (Pascual et al., Reference Pascual, Cearreta, Rodriguez-Lázaro, Uriarte, Borja and Collins2004) and because oil affected mainly this habitat (González et al., Reference González, Uriarte, Pozo and Collins2006). Oil spills have indirect effects on the structure and function of marine communities (Johnston & Keough, Reference Johnston and Keough2002), so scientific interest was also focused on species that play a dominant role in structuring the community.
Two shore levels were studied in order to gather comprehensive information of possible altered biological processes occurring at the intertidal zone. We selected the midshore zone dominated by barnacles (tidal height: 3–4 m) as it extends homogeneously along the coast. Furthermore, grazing species such as limpets typically shelter on this habitat and they have been proven to experience great reductions after oil spills (e.g. Southward & Southward, Reference Southward and Southward1978) and they also play a key role in intertidal community dynamics (Branch, Reference Branch, Moore and Seed1985). In addition, the Corallina elongata J. Ellis and Sol. community dominating the low intertidal zone (tidal height: 0.7–1.2 m) was also studied. This algae species occurs throughout the Basque coast and provides habitat for a large number of invertebrates, including limpets. The validity of coralline turf in studies analysing spatial changes in diversity and structure of associated macrofaunal assemblages has been previously assessed (Bussell et al., Reference Bussell, Lucas and Seed2007; Liuzzi & López-Gappa, Reference Liuzzi and López Gappa2008).
At both tidal levels, only communities inhabiting gently to moderate sloping (0°–45°) stable substrates (continuous bedrock and great blocks) were considered for sampling. In this way, we can discard the undesirable effects of rocky surface inclination in the investigated assemblages.
Sampling design
Given the absence of data from an affected population prior to the pollution event, the experimental design needs to compare polluted and control populations (Underwood, Reference Underwood1981). However, no suitable controls were found on the investigated area, as the prolonged continuous arrival of oil affected the entire coast to some degree (ORBANKOSTA, 2003). Thus, we decided to divide the coast into different sectors with two different levels of pollution: (1) slightly affected locations with small oil patches 5–50 cm in diameter and 1–3 mm thick sparsely distributed along the supralittoral and higher intertidal zones; and (2) moderately affected locations with patches measuring several tens of square metres irregularly distributed along the supralittoral and higher intertidal zones. Several locations (separated by tens of kilometres) were classified in either group on the basis of the oil arrival inventory report (ORBANKOSTA, 2003) as well as by direct inspection during repeated visits to the locations before sampling. Locations that were extremely exposed to wave action were not selected and only places accessible on foot and only very exposed or exposed shores were considered. A subset of 6 locations was randomly chosen from among the low affected possible sectors: Elantxobe, Lekeitio, Berriatua, Itziar, Getaria and Orio. Similarly, another 6 locations were randomly selected from among the possible moderately affected ones: Kobaron, Sopelana, Arminza, San Juan de Gaztelugatxe, Igueldo and Jaizkibel (Figure 1).
At each location (1 km in length, or less), several areas providing potential communities under investigation were identified. Two areas (separated by tens of metres) were selected by choosing at random from among the set of previously identified ones. At each area (15 m in length and 2–4 m wide), 3 quadrats used as replicates were randomly sampled. Quadrats were selected by moving at random distances along a measuring tape spread out on the bedrock. The no coincident points with the target surfaces (i.e. gently to moderate continuous bedrock and great blocks) were excluded. The same locations were revisited during the study, while areas were randomly selected in each sampling. All random choices were accomplished using tables of random digits. Temporal variability was studied at fixed intervals. During the whole study period, samplings were carried out twice a year at 2 opposite season conditions: spring (mainly in March and April) and the autumn (mainly in October and November).
There are some specific circumstances that partly explain the delay to the start of the study, which began almost one year after the first slicks reached the Basque coast. After the ‘Prestige’ sank, several oil waves over a ten-month period constantly worsened the reported scenario. Thus, as a result of the changing situation, we faced considerable difficulties when trying to establish a proper sampling design with sectors along 150 km of coast at a determinate level of oil affection. Furthermore, data obtained in a first sampling survey carried out in the autumn of 2003, were invalidated as some undesirable design deficiencies were soon detected.
Field sampling
A non-destructive sampling strategy was used which consisted of visually assessed estimates of animal cover in % at specific level in 40 × 40 cm quadrats using the abundance-covering scale proposed by Pérès & Picard (Reference Pérès and Picard1964) as reference: + (<1%), 1 (2.5–5%), 2 (5–25%), 3 (25–50%), 4 (50–75%) and 5 (75–100%). The mean species cover was calculated for each replicate using the categorical mean of each of the ranges. As a result of the field sampling, a total of 432 observations were obtained: 3 years, 2 seasons, 2 oiling levels, 6 locations, 2 sites and 3 quadrats.
Species not identified in the field were preserved in formalin or alcohol according to recommended procedures. Taxonomic identification was mostly carried out at species level, but in some cases such as difficult groups, we provided identification at family level or even higher taxonomic categories. The intertidal barnacles Chthamalus montagui and Chthamalus stellatus (Poli) co-occur along the Basque coast. As these species were not easy to distinguish in some locations, particularly at juvenile stages, we grouped both as Chthamalus spp. Ranzani for the statistical analyses. Similarly, the midshore limpets Patella intermedia Murray, Patella vulgata Linnaeus and Patella rustica Linnaeus were all grouped as Patella spp. complex.
Response variables studied
We used 3 common metrics of diversity: species richness (i.e. the number of species within a community) (S), Shannon's diversity (H′) and Pielou's evenness (J′). These univariate measures of diversity provide useful information about the loss or addition of species, the abundance of the species that are present and the skew in the distribution of abundance among the different species. As the number of species in the mid-intertidal community was limited and spatio-temporal differences detected corresponded to an extremely short range of variation, diversity measures were not taken into account for the statistical analyses in our research.
Other variables explored were the total faunal cover, the cover of key species, cover of the most abundant species and the structure of the community as a whole. In addition, species were aggregated into functional groups in order to examine for changes in the community trophic guilds. The trophic approach provides indirect information on the physical variables of the environment, as variations in the relative abundance of each strategy might respond to changes in the environmental conditions (natural or anthropogenic) (Roth & Wilson, Reference Roth and Wilson1998).
Statistical analyses
Data of the two tidal levels studied were treated separately. Spatio-temporal patterns of species richness (S), Shannon's diversity (H′), Pielou's evenness (J′), total cover, cover of key species, and cover of particularly abundant taxa were examined by a 5-way nested analysis of variance (ANOVA) using GMAV5 software (Institute of Marine Ecology, University of Sydney, Australia). The factors considered were: year (3 levels, fixed), season (2 levels: fixed and orthogonal), oiling level (2 levels, fixed and orthogonal to season), location (6 levels: random and nested in oiling level) and area (2 levels, random and nested in the interaction location × oiling level). Prior to analysis, Cochran's C-test was employed to assess homogeneity of variances. When appropriate, Student–Newman–Keuls (SNK) tests were used for a posteriori multiple comparisons of the means.
Permutational multivariate analysis of variance (PERMANOVA) was used to identify significant temporal and spatial variation in assemblage structure and trophic traits. The analyses were carried out using the PERMANOVA+ for PRIMER software package developed by Anderson et al. (Reference Anderson, Gorley and Clarke2008). The model for the analyses (experimental details concerning factors and levels) were similar to those described for univariate analysis. In order to lessen the influence of the more abundant taxa, data were transformed beforehand in some cases. Mid-intertidal data were square root transformed for assemblage-structure analysis, while data were not transformed for trophic guilds analysis. At the low intertidal zone, data were 4th root transformed for the assemblage-structure analysis, while a square root transformation was considered more adequate for trophic guilds analysis. The procedure was based on Bray–Curtis dissimilarities which were used to calculate a distance matrix between pair of samples. Probability values were given using 999 random permutations of the residuals under a reduced model. In addition, the significant results of the permutational analyses were further investigated using the SIMPER routine. This procedure allowed us to establish which species or trophic strategy was mainly responsible for the significant differences in the factors selected by the permutational analyses.
Any evidence of significant temporal trend (from 2004 to 2006 or vice versa) was considered of importance as it could be related to the arrival of oil to the coast. If no temporal pattern was found, we only considered as significant those spatial differences constant throughout the three years, since spatial patterns can vary from time to time (Underwood & Petraits, Reference Underwood, Petraits, Rickerfs and Schluter1993).
Temporal and spatial variation of faunal assemblages were represented graphically also using the PRIMER +add on program (Anderson et al., Reference Anderson, Gorley and Clarke2008). In order to facilitate the visualization of possible patterns and trends, non-parametric multidimensional scaling ordinations (nMDS) were plotted using 72 mean measures obtained by averaging the following factors: year, season and location. Medium intertidal data were square root transformed, while low shore data were 4th root transformed.
RESULTS
Low intertidal zone
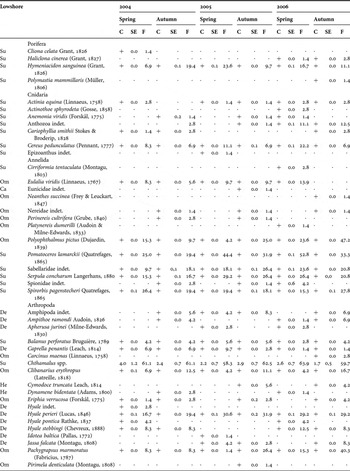
A total of 77 macrofaunal taxa were recorded, comprising 4 species of Porifera, 7 Cnidaria, 13 Annelida, 25 Arthropoda, 22 Mollusca, 3 Echinodermata and 3 Bryozoa. Few species reached mean values above 1% cover (Table 1). These were: the limpet Patella ulyssiponensis Gmelin, the cirripeds Chthamalus spp., the sea urchin Paracentrotus lividus (Lamarck) and the bivalve Mytilus galloprovincialis Lamarck. The most common species (found over a 30% of the total of replicates) were P. ulyssiponensis, Chthamalus spp., the gastropod Bittium reticulatum (Da Costa), M. galloprovincialis and the polychaete Pomatoceros lamarckii (Quatrefages).
Lowshore faunal species cover (C, in %) and frequency (F, in %) in the study area according to different seasons and years (N = 72). The symbol + indicates cover values less than 1%.

SE, standard error; Ca, carnivores; De, detritivores; He, herbivores; Om, omnivores; Su, suspensivores.
DIVERSITY MEASURES
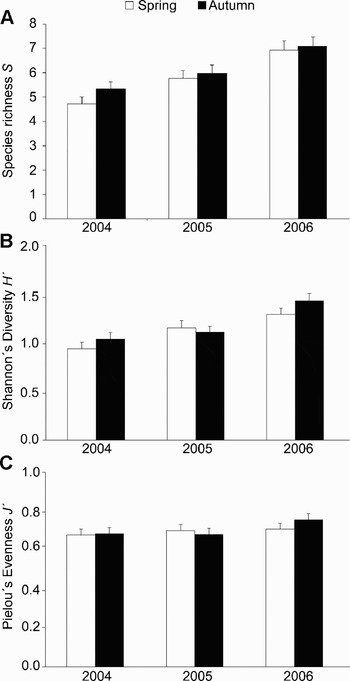
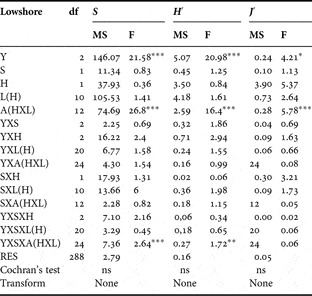
Species richness S, Shannon diversity H′ and Pielou's evenness J′ showed significant differences during the three years studied (Table 2). According to the SNK test comparisons, an increasing trend was detected from 2004 to 2006 (Figure 2). By contrast, significant differences between seasons, oiling level and locations were not detected. ANOVA showed strong spatial variability at the scale of tens of metres (areas) which was consistent with time as it was indicated by the absence of interaction year × area and season × area.
Species richness S (A), Shannon's diversity H′ (B) and Pielou's evenness J′(C) of lowshore faunal assemblages on the Basque coast at time of each sampling (from 2004 to 2006).

ANOVA results testing the effect of year (Y), season (S), oiling level (H), location (L) and area (A) on species richness S, Shannon's diversity H′ and Pielou's evenness J′ of lowshore faunal assemblages.

*P < 0.05; **P < 0.01; ***P < 0.001; ns, not significant.
TOTAL FAUNAL COVER
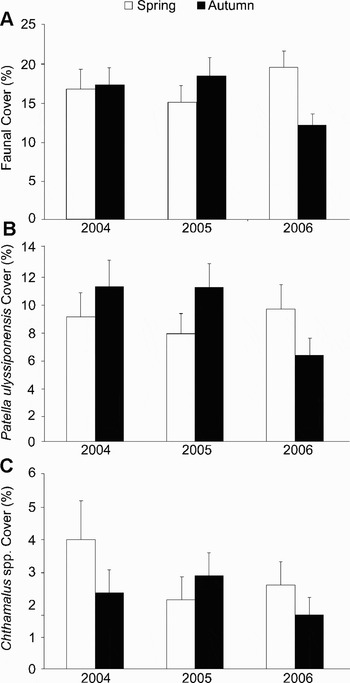
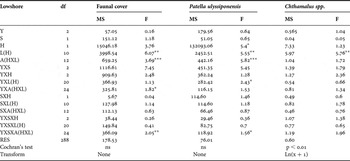
ANOVA did not detect significant differences in the faunal cover between years, seasons or oiling level (Table 3; Figure 3A). On the contrary, the abundance of the fauna was characterized by a strong spatial variability both at scale of kilometres (locations) and tens of metres (areas), although differences between areas were not consistent over years.
Faunal cover (A), Patella ulyssiponensis cover (B) and Chthamalus spp. cover (C) in % of lowshore faunal assemblages on the Basque coast at time of each sampling (from 2004 to 2006).

ANOVA results testing the effect of year (Y), season (S), oiling level (H), location (L) and area (A) on faunal cover, Patella ulyssiponensis cover and Chthamalus spp. cover in lowshore habitat.

*P < 0.05; **P < 0.01; ***P < 0.001; ns, not significant.
SPECIES ABUNDANCE
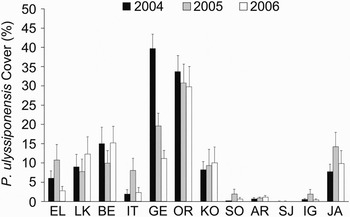
Neither annual nor seasonal differences were found in the abundance of the limpet Patella ulyssiponensis (Table 3; Figure 3B). Nevertheless, significant differences between the two oiling levels were detected which were consistent over the three years studied. As indicated by the SNK test, this gastropod reached lower cover values in the moderately affected sites, although no temporal trend was detected (Figure 4). The distribution of P. ulyssiponensis was characterized by both a strong variability at a scale of kilometres (locations) and tens of metres (areas). However, spatial differences between locations were not consistent over years.
Lowshore spatial changes in Patella ulyssiponensis cover (in %) at slightly and moderately affected locations on the Basque coast over time (from 2004 to 2006).

The distribution of the population of Chthamalus spp. in the low intertidal level was defined by considerable stability over time (Table 3; Figure 3C). Furthermore, their cover did not show significant variations between the two oiling levels. The cirripeds showed a homogeneous distribution at a scale of tens of metres (areas) that contrasts with the significant differences maintained over time at scale of kilometres (locations).
FAUNAL ASSEMBLAGES
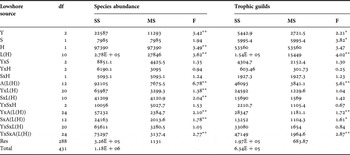
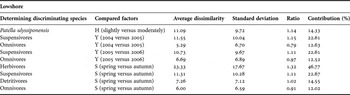
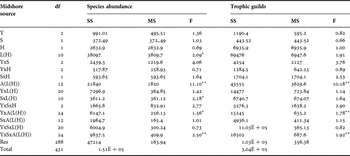
The results of the permutational analyses of variance performed on the complete species abundances data set (77 variables) showed a significant effect of all factors considered in the analysis with the exception of the factor season (Table 4). Differences between the two oiling levels were constant throughout the whole period studied, whereas differences between locations and areas were not consistent over time. During the three years of the study, slightly affected locations were distinguished from moderately affected locations for their higher abundance of the limpet Patella ulyssiponensis (Table 5). The permutational analyses also proved a significant effect of the factor year. However, the SIMPER routine does not show evident trends in the abundance of any species among the three years of the study.
PERMANOVA results showing the effect of year (Y), season (S), oiling level (H), location (L) and area (A) on lowshore faunal assemblages considering the whole species data set and the community trophic guilds.

*P < 0.05; **P < 0.01; ***P < 0.001.
Average dissimilarity between the significant discriminating factors detected by the permutational analyses in the lowshore habitat.

Y, year; S, season; H, oiling level.
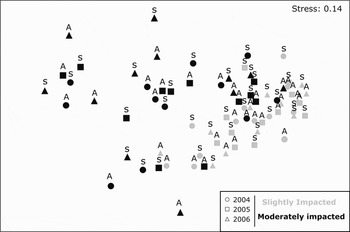
The MDS plot (Figure 5) does not show clear effects of time. However, a separation of assemblages is noted with less impacted locations being mainly placed in the right side of the diagram. The graph also illustrates a more scattered distribution for moderately than slightly affected locations.
Non-metric multidimensional scaling similarity plot computed for slightly and moderately affected lowshore assemblages on the Basque coast at time of each sampling (from 2004 to 2006). Spring (S); autumn (A).

TROPHIC GUILDS
The relative abundance of the trophic guilds of the community showed significant temporal differences between years and seasons although no differences were found between the two oiling levels (Table 4). Trophic guilds in the community were characterized by a strong variability at a scale of kilometres (locations) and tens of metres (areas). However, spatial differences between areas were not consistent over time. The contribution of trophic strategy to the significant factors obtained by the permutational analyses can be consulted in Table 5. Suspensivores and omnivores showed a slightly increasing trend over time. Seasonal trends are vaguely detected for practically all the trophic strategies. Suspensivores and detritivores are more abundant in spring, while herbivores and omnivores are more abundant in autumn. It should be noted that temporal and seasonal significant trophic differences corresponded to an extremely short range of variation in the relative abundance of each strategy, so, finally, we decided not to consider them as relevant.
Mid-intertidal zone
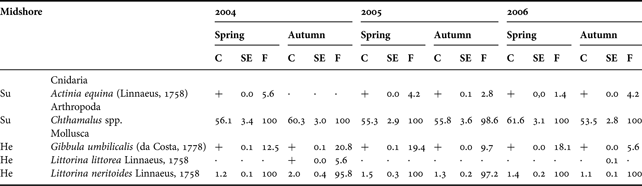
A total of 8 macrofaunal taxa were recorded, comprising 1 Cnidaria, 1 Arthropoda, 6 Mollusca (Table 6). The assemblage was dominated by the cirripeds Chthamalus spp. and the limpets Patella spp. (mainly Patella intermedia and Patella vulgata). The aforementioned species together with the gastropod Littorina neritoides Linnaeus were found in nearly all the samples.
Midshore faunal species cover (C, in %) and frequency (F, in %) in the study area according to different seasons and years (N = 72). The symbol + indicates cover values less than 1%.
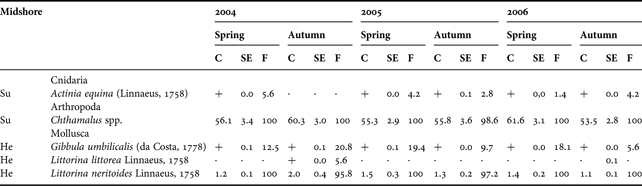
SE, standard error; He, herbivores; Su, suspensivores.
TOTAL FAUNAL COVER
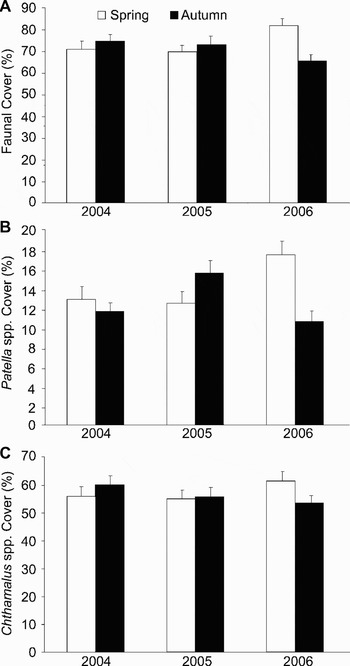
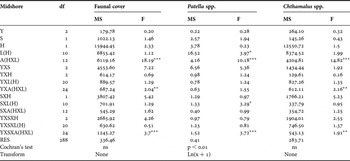
The abundance of the fauna did not show any significant changes through time and there were no differences between the two oiling levels (Table 7; Figure 6A). Strong spatial variability was detected at a scale of tens of metres (areas), but was not consistent over the years.
Faunal cover (A), Patella spp. cover (B) and Chthamalus spp. cover (C) in % of midshore faunal assemblages on the Basque coast at time of each sampling (from 2004 to 2006).

ANOVA results testing the effect of year (Y), season (S), oiling level (H), location (L) and area (A) on faunal cover, Patella spp. cover and Chthamalus spp. cover in midshore habitat.

*P < 0.05; **P < 0.01; ***P < 0.001; ns, not significant.
SPECIES ABUNDANCE
The species group of Patella remained stable over time; likewise its abundance presented no variations between the two oiling levels (Table 7; Figure 6B). The distribution of Patella spp. was characterized by a marked variability between locations and areas. However, differences at a scale of kilometres (locations) varied over time as indicated by the significant season × location interaction.
Similarly, the cover of the species group of Chthamalus spp. did not show temporal changes nor were any differences detected between slightly and moderately affected locations (Table 7; Figure 6C). The cirripeds maintained homogeneous abundances over time at a scale of kilometres (locations). Spatial differences were found at a scale of tens of metres (areas), which were not consistent over the years.
FAUNAL ASSEMBLAGES
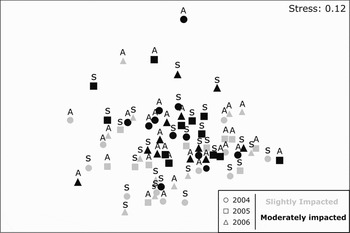
Permutational analyses of variance performed on the whole species data set (8 variables) did not show a significant temporal effect and differences between the two intensities of oil disturbance were not found either (Table 8). However, significant spatial variability was found between locations and areas. Differences between locations were not consistent over the seasons while differences between areas were not consistent over the years. The n-MDS ordination plot (Figure 7) shows locations without any temporal or spatial gradient between years, seasons and oiling levels.
Non-metric multidimensional scaling similarity plot computed for slightly and moderately affected midshore assemblages on the Basque coast at the time of each sampling (from 2004 to 2006). Spring (S); autumn (A).

PERMANOVA results showing the effect of year (Y), season (S), oiling level (H), location (L) and area (A) on midshore faunal assemblages considering the whole species data set and the community trophic guilds.

*P < 0.05; **P < 0.01; ***P < 0.001.
TROPHIC GUILDS
The relative abundance of the trophic guilds of the community inhabiting the mid-intertidal zone was characterized by a strong stability between years, seasons, oiling levels and locations (Table 8). Significant differences were only found between areas, which were not consistent over the years.
DISCUSSION
Previous experience has shown that impacts of oil in rocky intertidal communities lead to reductions in midshore Patella populations, which strongly influences the structure of the community (Hawkins & Southward, Reference Hawkins, Southward and Thayer1992; Moore, Reference Moore2006). By contrast, the results presented here show that oil deposition on rocky surfaces deriving from the ‘Prestige’ accident did not have an appreciable quantitative effect on the abundance of Patella along the mid-intertidal zone. Furthermore, the composition, abundance and trophic guilds of the community at this tidal level remained notoriously similar along the Basque coast.
On the contrary, the null hypothesis that community characteristics in the low intertidal zone were invariant to oil affection was rejected in two of the variables tested: (1) the abundance of the limpet Patella ulyssiponensis, with lower values at moderately affected locations; and (2) the structure of assemblages. Both results are concurrent since P. ulyssiponensis was the sole species of the assemblage that contributed to the significant oiling effect detected by permutational analyses. The differences in P. ulyssiponensis cover could be better understood if background information existed. In spite of these, the fact that differences in P. ulyssiponensis are maintained for 3 years after the spill leads us to consider that the reported differences probably existed prior to the oil arrival. Another significant result that could be related to the arrival of oil to the coast was the increasing diversity trend detected from 2004 to 2006 in low intertidal fauna. Similarly, this result was found after the ‘Prestige’ spill for macroalgal assemblages along the Basque coast (Diez et al., 2009a). Unfortunately, there were no pre-impact data on fauna for the Basque coast, but helpful information is available from macroalgal communities (Díez et al., Reference Díez, Santolaria, Secilla and Gorostiaga2009b). Their results indicated particularly low diversity values at the Corallina elongata assemblage in 2002, prior to the ‘Prestige’ accident. This information together with the fact that no differences have been found between slightly and moderately oiled locations in terms of faunal diversity, total faunal cover or trophic guilds, led us to deliberate that the increasing trend in diversity is most likely associated with natural variability on the shore.
Effects of pollution on biotic integrity are difficult to identify when there are overlaps between environmental gradients and pollutant effects (Rakocinski et al., Reference Rakocinski, Brown, Gaston, Heard, Walker and Summers1997). Clearly, the lack of previous data on affected sites and the absence of undisturbed sites (as the whole shore was affected by oil to some extent) were quite restrictive circumstances to our research. Nevertheless, we inferred conclusions about possible alterations of assemblages by contrasting our results with other spill events published in the scientific literature. Investigations of the noxious effects of oil spills on intertidal populations coincide with two major biological effects: the removal of key mid-intertidal grazing species, essentially limpets, and the consequent growth of opportunistic algae (e.g. Southward & Southward, Reference Southward and Southward1978; Crump et al., Reference Crump, Morley and Williams1998; Le Hir & Hily, Reference Le Hir and Hily2002). On the one hand, our results did not show quantitative impact from the ‘Prestige’ spill on the population of limpets at the mid-intertidal. On the other hand, macroalgal assemblages of the entire affected area did not evidence any indirect impact caused by alterations in the population of grazing species such as Patella ulyssiponensis (Díez et al., 2008a; Lobón et al., Reference Lobón, Fernández, Arrontes, Rico, Acuña, Anadón and Monteoliva2008). These facts led us to conclude that the significant changes detected in the low intertidal zone along the Basque coast are not deleterious and better related with natural fluctuations of these communities.
The absence of major impact of the ‘Prestige’ oil spill on the Basque rocky coast was raised previously by other authors (Lobón et al., Reference Lobón, Fernández, Arrontes, Rico, Acuña, Anadón and Monteoliva2008; Díez et al., Reference Díez, Secilla, Santolaria and Gorostiaga2009a). The use of the fishing fleet to collect the oil at sea prevented to some extent large fuel deposition on the rocky coast (González et al., Reference González, Uriarte, Pozo and Collins2006). Indeed, communities at both tidal levels studied were not smothered by oil (ORBANKOSTA, 2004). Furthermore, fuel was partially weathered by the time it arrived at the Basque coast (Gallego et al., Reference Gallego, González-Rojas, Peláez, Sánchez, García-Martínez, Ortiz, Torres and Llamas2006), probably producing less damaging effects in organisms (Antrim et al., Reference Antrim, Thom, Gardiner, Cullinan, Shreffler and Bienert1995). The limited use of aggressive cleanups was also decisive, as they sometimes cause more damage than the fuel itself (Southward & Southward, Reference Southward and Southward1978; Houghton et al., Reference Houghton, Less, Driskell, Linsdtrom and Mearns1996).
However, in the cases of apparently unaltered populations (or fully recovered ones), the existence of genetic damage that could affect their long-term capability of adaptation (Piñeira et al., Reference Piñeira, Quesada, Rolán-Alvarez and Caballero2008) should be noted. Bartolomé and co-workers (submitted for publication) found considerable levels of polycyclic aromatic hydrocarbons (PAH) accumulated in Patella vulgata tissues inhabiting the supralittoral fringe (above 4 m) of the Basque coast in several of the most affected locations. Unfortunately, no surveillance has been accomplished in the study area on the genetic impact of the oil accumulated in P. vulgata populations after the ‘Prestige’ disaster. No doubt, an integral assessment of the consequences of environmental pollution requires a complete understanding of all variables responsible for changes in the population dynamics in the affected area (Clark, Reference Clark1982). Concerning limpets, they play a key role in structuring the entire intertidal ecosystem (Branch, Reference Branch, Moore and Seed1985; Hawkins et al., Reference Hawkins, Hartnoll, Kain, Norton, John, Hawkins and Price1992). Consequently, further studies are necessary to evaluate the state of the marine environment on the Basque coast after the ‘Prestige’ oil spill with certainty.
With respect to spatio-temporal variation, a trend that emerges from this study is that heights on the shore involve important differences. Mid-intertidal communities exhibited a more consistent structure in space and time with a single variable showing spatially significant difference. On the contrary, lowshore habitat was heterogeneous in practically all the variables examined. Physical stress on the harsh mid-intertidal environment has been addressed in other studies as limiting variability of midshore communities (Archambault & Bourget, Reference Archambault and Bourget1996), while additional variation in the low intertidal zone may be attributed to the existence of a greater patchiness. Another issue resulting from the present study is that different spatial scale (kilometres and tens of metres) explains the variability of different community characteristics. Other authors (Fraschetti et al., Reference Fraschetti, Terlizzi and Benedetti-Cecchi2005) have addressed the issue of spatial variability in the rocky intertidal zone, although tests of space × time interactions are less common. Contrary to our results, many studies found significant scales of variation simultaneously at both spatial scales considered in the present study. We believe that to some extent, temporal replication in our design makes spatial patterns quite complicated to define over time.
Finally, we must summarize the lessons learned. The ‘Prestige’ incident highlighted many serious weaknesses in the marine pollution management system of the Basque coast. Those relating to scientists include serious limitations in assessing environmental damage, as a response of the lack of well-designed surveillance programmes prior to the incident. Although oil spills and pollution have nowadays raised public concern, marine environmental protection is a long-term responsibility, one that requires further research and budget effort (Chiau, Reference Chiau2005). In this sense, future challenges for managers and scientists should include the development of reliable long-term monitoring research to measure future impacts on the rocky shore in a more accurate way.
ACKNOWLEDGEMENTS
We are most grateful to all the members of the marine benthos research group from the University of the Basque Country, who were of invaluable help during the study. This work was supported by the Spanish Ministry of Science and Technology (projects vem2003-20082-CO6-PRESTEPSE) and by the Basque Government actions—IMPRES.