I. INTRODUCTION
Owing to their rich electrical and magnetic properties, the rare earth manganites have attracted great interests (Chandra Sekhar et al., Reference Chandra Sekhar, Lee, Choi, Lee and Park2005). Depending on the ionic size of rare-earth elements, RMnO3 crystallizes either in an orthorhombic or hexagonal phase. The hexagonal (h-) phase with a space group of P63cm is observed for R = Ho, Er, Tm, Yb, Lu, Y, and Sc with a relatively smaller ionic radius, while the orthorhombic phase with a space group of Pbnm is found for R = La, Pr, Nd, Sm, Eu, Gd, Tb, and Dy with a larger ionic radius (Singh et al., Reference Singh, Patnaik, Kaushik and Siruguri2010). Multiferroics in rare earth manganites have attracted increasing attention owing to coexistence of ferroelectric and magnetic behaviors (Katsufuji et al., Reference Katsufuji, Mori, Masaki, Moritomo, Yamamoto and Takagi2001, 2002; Van Aken et al., Reference Van Aken, Palstra, Filippetti and Spaldin2004; Cheong and Mostovoy, Reference Cheong and Mostovoy2007; Singh et al., Reference Singh, Patnaik, Kaushik and Siruguri2010). It has large potential applications in multifunctional devices, such as data storages, capacitors, transducers, and actuators. Hexagonal YMnO3 is one of the most intensively studied multiferroic, which exhibits ferroelectricity below 900 K (Lukaszewicz and Karut-Kalicinska, Reference Lukaszewicz and Karut-Kalicinska1974) as well as an anti-ferromagnetic (AFM) state below 70 K (Yakel et al., Reference Yakel, Koehler, Bertaut and Forrat1963; Smolenskii and Bokov, Reference Smolenskii and Bokov1964). YMnO3 comes through a phase transition from a high-symmetry paraelectric phase at high temperature to a spontaneously polarized ferroelectric phase at low temperature. The crystal structure of hexagonal YMnO3 transforms from the P63/mmc space group to P63cm accompanying ferroelectric transition 9 (Van Aken et al., Reference Van Aken, Palstra, Filippetti and Spaldin2004). The ferroelectric polarization comes from the tilting of MnO5 trigonal bipyramids and the buckling of R layers (Katsufuji et al., Reference Katsufuji, Masaki, Machida, Moritomo, Kato, Nishibori, Takata, Sakata, Ohyama, Kitazawa and Takagi2002). The bond lengths of Mn–O in the MnO5 bipyramids and the bond length of Y–OT (OT: the apical oxygen) remain unchanged. Therefore, one of the Y–OP (OP: the planar oxygen) bond lengths is reduced, while the other is enlarged, leading to a net electric polarization (Van Aken et al., Reference Van Aken, Palstra, Filippetti and Spaldin2004). Hexagonal YMnO3 is an A-type AFM material. The spin of Mn ions within the Mn–O plane forms a triangular network. It is a geometrically frustrated magnetic system because it is impossible to form all nearest-neighbor AFM couplings (Chen et al., Reference Chen, Zhang, Miao, Xu, Dong, Cao, Qiu, Zhao and Pengcheng2005). An interaction between non-magnetic R3+–Mn3+ can be ignored for Y3+ (4d0) being non-magnetic. Much attention has been paid to study the origin of the magnetic and electric effect, which is still an open question.
The substitution of A-site or B-site atom in YMnO3 can change the ferroelectric and magnetic ordering, and affect the interplay between magnetism and ferroelectricity (Nugroho et al., Reference Nugroho, Bellido, Adem, Nénert, Simon, Tjia, Mostovoy and Palstra2007). Much attention has been paid to study the effect of B-site substitution (Nugroho et al., Reference Nugroho, Bellido, Adem, Nénert, Simon, Tjia, Mostovoy and Palstra2007; Zhang et al., Reference Zhang, Zhu, Wu and Qing2011). The effect of A-site doping, with the magnetic framework of Mn atoms being not disturbed, on structure and transport properties needs further research. Dy3+ is a magnetic ion with a different orbital occupation (4f9) and a larger ionic radius compared with that of non-magnetic Y3+ (4d0). In the present study, we study the effect of substitution of Y with Dy on microstructure and magnetic properties of YMnO3.
II. EXPERIMENTAL
Polycrystalline samples of Y1−xDyxMnO3 (x = 0.1, 0.2, 0.3, 0.4, 0. 5, 0.6, 0.7, 0.8, 0.9, and 1.0) were synthesized by the solid-state reaction. The structure of each sample was characterized by X-ray diffraction (XRD), which was performed on a Rigaku Dmax-rB diffractometer at room temperature with a step scanning model. The scan range of 2θ was from 15 to 90o with a step size of 0.02o. The structural parameters were obtained from a standard Rietveld program of GSAS. Magnetization characteristics were measured using a superconducting quantum interference device magnetometer (SQUID) with a magnetic field of 200 Oe at room temperature.
III. RESULTS AND DISCUSSION
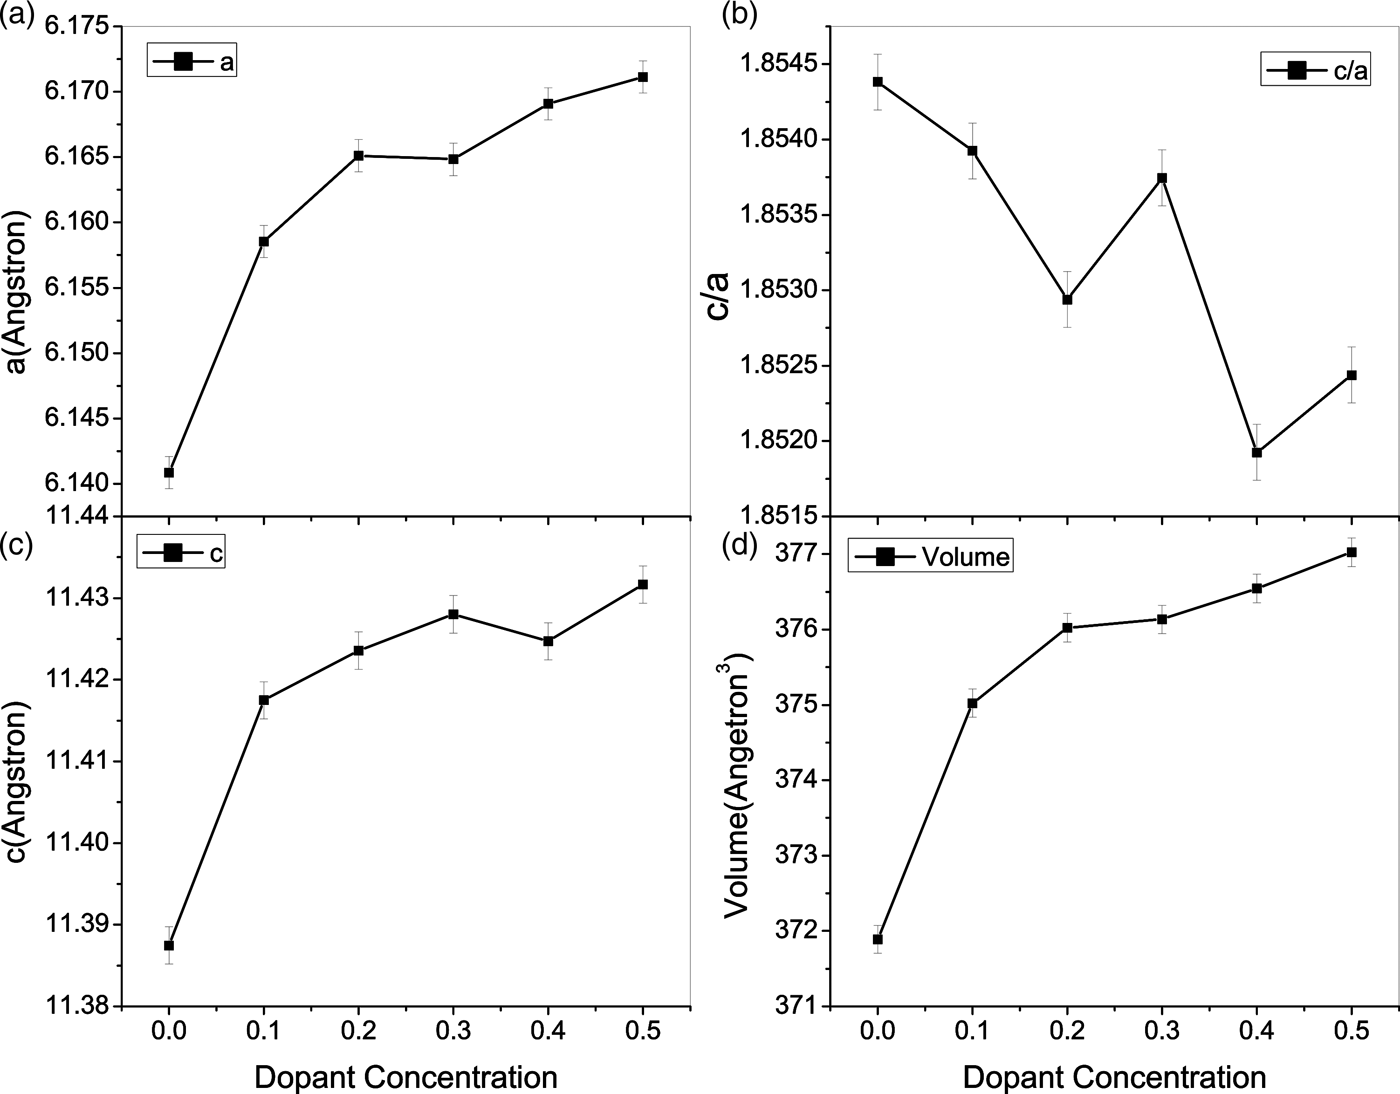
Figure 1 shows the XRD patterns of all samples with different dopant concentrations measured at room temperature. The XRD patterns of the samples with x ≤ 0.5 can be well characterized by a hexagonal YMnO3 structure with a space group of P63cm, which indicates that all samples are of a single hexagonal phase. For 0.6 ≤ x ≤ 0.8, mixed phases of orthorhombic and hexagonal phases are observed, and for x ≥ 0.9, orthorhombic symmetry stabilizes. The present study is focused on the dopant hexagonal Y1−xDyxMnO3 (x ≤ 0.5). The XRD patterns for samples (x ≤ 0.5) with a hexagonal symmetry were all refined using the standard Rietveld program. And the agreement factors of the refinement were all within 13%. Figure 2 shows the refined XRD patterns of all the samples. The dopant dependence of unit-cell parameters of a, c, the ratio of c/a, and the unit-cell volume were obtained from Rietveld refinements as shown in Figure 3. With the Dy dopant concentration x increasing, the in-plane unit-cell parameter a, the out of plane unit-cell parameter c, and the unit-cell volume increase, which is ascribed to the larger ionic radius of Dy3+. It is notable that the unit-cell parameter ratio c/a is reduced by Dy substitution, which may be ascribed to the orbital shape of f electrons for Dy3+ ion. The change of unit-cell parameters may be related to the distortion of MnO5 trigonal bipyramids and the buckling of R layers, which may change the ferroelectric polarization and magnetic ordering of Y1−xDyxMnO3.
X-ray diffraction patterns of Y1−xDyxMnO3 with different Dy3+ dopant concentrations measured at room temperature.

The observed (cross), calculated (line), and difference profiles at room temperature after Rietveld refinement using the P63cm space group for samples with doping content x = 0.0, 0.3, and 0.5. Bars represent the Bragg positions.
Variations of the in-plane (a) and out-of-plane unit-cell parameters, the ratio of c/a (c) and unit-cell volume (d) vs. Dy3+ dopant concentration in YMnO3.
Bond lengths of Y1–O3 and Y2–O4 as a function of the dopant concentration in Y1−xDyxMnO3.
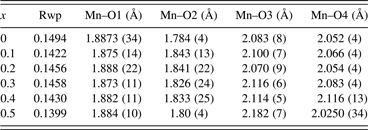
Table I lists the Mn–O bond lengths obtained from the refinement. The planar Mn–O bond lengths (Mn–O3 and Mn–O4) are significantly larger than the apical Mn–O1 and Mn–O2 bond lengths, which are consistent with the results in the literature (Nugroho et al., Reference Nugroho, Bellido, Adem, Nénert, Simon, Tjia, Mostovoy and Palstra2007). There is no obvious change of the bond lengths Mn–Op and Mn–OT with Dy dopant concentration as seen from the refined data listed in the Table. The MnO5 bipyramids remain centrosymmetric, and Mn3+ remains at the center of MnO5. These results show that the Mn atoms framework is not obviously disturbed by the Dy substitution at the Y-site. Therefore, it may be deduced that the magnetic interplay between Mn ions is not affected by substituting Y with Dy. However, structural distortion is not unavoidable because Dy3+ has slightly larger ionic radii, which will induce magnetization and ferroelectric polarization and change the magnetoelectric coupling (Park et al., Reference Park, Lee, Kang, Jang, Lee, Streltsov, Mazurenko, Valentyuk, Medvedeva, Kamiyama and Park2010).
Mn–O bond lengths in Y1−xDyxMnO3 obtained from X-ray diffraction refinement.
The important characterization of the ferroelectric distortion of YMnO3 is that one of the Y–OP bond lengths is reduced, while the other is enlarged. To further study the effect of Dy doping on the ferroelectric distortion, the bond lengths of Y1–O3 and Y2–O4 were obtained from the refinement results of XRD. The bond length of Y2–O4 is elongated from 2.38 to 2.81 Å, while that of Y1–O3 is shortened from 2.43 to 2.08 Å, with increasing the Dy dopant concentration as shown in Figure 4. As we all know, the ferroelectricity comes from the off-center displacement of Y-atom between the in-plane oxygen along the c-axis. The structural distortion and enhanced R–Mn coupling may strengthen the ferroelectric distortion with increasing the Dy doping content and strengthen the magnetoelectric coupling, which was reported in related systems (Magesh et al., Reference Magesh, Murugavel, Mangalam, Singh, Simon and Prellier2012).
The temperature-dependent dc magnetization curves of samples with the different doping concentration of Dy3+ ion under zero-field-cooling (ZFC) and field-cooling (FC) conditions are shown in Figure 5. The applied magnetic field is 200 Oe. As seen in Figure 5, the AFM transition is not visible in the magnetization curves, which is because of the huge paramagnetic susceptibility stemming from Dy3+ (Harikrishnan et al., Reference Harikrishnan, Rößler, Naveen Kumar, Bhat, Rößler, Wirth, Steglich and Elizabeth2009). At low temperature, because Dy3+ ions which adopt a Г2 structure with a ferrimagnetic alignment of moments below 10 K (Nandi et al., Reference Nandi, Kreyssig, Yan, Vannette, Lang, Tan, Kim, Prozorov, Lograsso, McQueeney and Goldman2008), the increasing magnetic moment may be mainly resulting from spin order of Dy3+. For pure YMnO3, because Y3+ is a non-magnetic ion, there is no interaction between Y3+ and Mn3+. When Y3+ is partly substituted by magnetic Dy3+ with a larger ionic radius, interaction between Dy3+ and Mn3+ is introduced, which will induce spin reorientation (SR) effect below T SR (Vajk et al., Reference Vajk, Kenzelmann, Lynn, Kim and Cheong2005; Magesh et al., Reference Magesh, Murugavel, Mangalam, Singh, Simon and Prellier2012). Meanwhile, interaction between inter-planar Mn3+–O–O–Mn3+ may be changed (Lonkai et al., Reference Lonkai, Tomuta, Hoffmann, Rschneider, Hohlwein and Ihringer2003), which need to be further checked. Therefore, the spin order of Dy3+ ions and Dy3+–Mn3+ coupling result in the increasing magnetic moment at low temperature with increasing Dy3+dopant concentration. No obvious bifurcation of ZFC and FC magnetization is observed at different doping concentrations of Dy, though obvious bifurcation is observed in DyMnO3 single crystal at a temperature below 10 K (Mansouri et al., Reference Mansouri, Jandl, Laverdìere, Fournier, Mukhin, Ivanov and Balbashov2013). Spin-glass effect is not observed in our samples from M_T curves, which is different from B-site doping YMnO3. These results may further show MnO5 trigonal bipyramids is not obviously affected by Dy substitution.
Temperature dependence of FC and ZFC of magnetization at H = 200 Oe for Dy3+-dopping YMnO3.
Temperature dependence of the inverse susceptibility is shown in Figure 6 for three doped samples of Y1−xDyxMnO3 (x = 0.0, 0.2, 0.4, and 0.6). There is no clear anomaly at the expected AFM transition temperatures for all the samples. By fitting the temperature dependence of inverse susceptibility 1/χ curves using the Curie–Weiss law χ = C/(T − θ CW) (Figure 6), the Curie–Weiss temperatures θ CW of samples with different Dy dopants were obtained. The Curie–Weiss temperatures are found to change from θ CW = −560 K for x = 0.0 to −56 K (x = 0.2), −35 K (x = 0.4). The negative value of θ CW indicates the presence of AFM exchange interactions. However, θ CW does not directly relate to the physics of the coupled magnetic sublattices as in other hexagonal RMnO3 systems (Harikrishnan et al., Reference Harikrishnan, Rößler, Naveen Kumar, Bhat, Rößler, Wirth, Steglich and Elizabeth2009). Based on the theoretical value of Curie–Weiss temperature θ CW = 2J 0S(S + 1)/3, the exchange constant J 0 is proportional to θ CW (Park et al., Reference Park, Lee, Kang, Jang, Lee, Streltsov, Mazurenko, Valentyuk, Medvedeva, Kamiyama and Park2010). The decreased J 0 is owing to combined interactions of Mn3+–O–Mn3+, Mn3+–O–O–Mn3+ and Dy3+–Mn3+ in the Dy3+ doping YMnO3 system. It is difficult to separate these different interactions in polycrystalline samples.
Temperature dependence of the inverse susceptibility for four samples of Y1−xDyxMnO3 (x = 0.0, 0.2, 0.4, and 0.6).
IV. CONCLUSION
Polycrystalline Y1−xDyxMnO3 samples with x ranging from 0 to 1 were synthesized by the solid-state reaction method. Structure studies show that Y1−xDyxMnO3 with low concentration (x ≤ 0.5) of Dy3+ retains a single hexagonal symmetry. The microstructure analysis shows that the MnO5 bipyramids are almost unchanged, and the Y atom is displaced from the center of the in-plane oxygen along the c-axis. The magnetic moment at low temperature increases with increasing the doping concentration of Dy3+, which is ascribed to the spin order of Dy3+, the increasing Dy3+–Mn3+ coupling and Mn3+–O–O–Mn3+ interaction induced by structural distortion. The regular SG state is not observed in A-site doping YMnO3 polycrystalline samples.
ACKNOWLEDGEMENTS
This work was supported by NNSFC (No. 11274153), NKPBRC (2010CB923404), and the National Key Projects for Basic Researches of China (B12020129).