1 Introduction
Selective polymer membranes are much used in gas separation (Koresh & Sofer Reference Koresh and Sofer1983), as gas sensors (Rego & Mendes Reference Rego and Mendes2004), for drug delivery (Pernaut & Reynolds Reference Pernaut and Reynolds2000) and as filters (Dhopeshwarkar et al. Reference Dhopeshwarkar, Crooks, Hlushkou and Tallarek2008). A popular material for these applications is polydimethylsiloxane (PDMS), which exhibits hydrophobicity and organophilicity. This property has contributed to the extensive usage of this material for the dehydration of alcohol solutions (Vankelecom et al. Reference Vankelecom, Dotremont, Morobe, Uytterhoeven and Vandecasteele1997). Moreover, PDMS is soft, biocompatible, permeable to gases or vapour and relatively inexpensive, and can also be used, for example, in micropumps (Jeong & Konishi Reference Jeong and Konishi2007), microvalves (Jo et al. Reference Jo, Van Lerberghe, Motsegood and Beebe2000) and microfluidics (Duffy et al. Reference Duffy, McDonald, Schueller and Whitesides1998), for pervaporation (Peng et al. Reference Peng, Jiang, Hu, Wang, Xu and Liu2006) and in nanofiltration (Stafie, Stamatialis & Wessling Reference Stafie, Stamatialis and Wessling2005).
In the aforementioned technological applications, it is important to know the transport characteristics based on the structure of the material, such as the permeability and the diffusion coefficient, because these properties determine the end use of the material. While these attributes can be measured (e.g. Tsuru et al. Reference Tsuru, Sudou, Kawahara, Yoshioka and Asaeda2000; Geens, Van der Bruggen & Vandecasteele Reference Geens, Van der Bruggen and Vandecasteele2004; Ebert et al. Reference Ebert, Koll, Dijkstra and Eggers2006), the experiments are often cumbersome and/or too costly to perform in an industrial setting. In such cases, theoretical models or computational approaches are effective tools to inform designers (e.g. Vankelecom et al. Reference Vankelecom, De Smet, Gevers, Livingston, Nair, Aerts, Kuypers and Jacobs2004; Makrodimitri & Economou Reference Makrodimitri and Economou2008; Chang et al. Reference Chang, Chung, Yang, Lue, Tung and Lin2012; Sanaei & Cummings Reference Sanaei and Cummings2017, Reference Sanaei and Cummings2018), and it is most common to assume that the properties, once measured, are constants independent of the details of the application.
To understand the transport properties of PDMS, a number of studies have been conducted using a combination of experiments, theory and simulations (e.g. Vankelecom et al.
Reference Vankelecom, De Smet, Gevers, Livingston, Nair, Aerts, Kuypers and Jacobs2004; Makrodimitri & Economou Reference Makrodimitri and Economou2008; Ismail et al.
Reference Ismail, Grest, Heine, Stevens and Tsige2009; Firpo et al.
Reference Firpo, Angeli, Repetto and Valbusa2015). It is, however, difficult to derive the transport properties and flux equation of a thin PDMS membrane, because it is unclear which mode of transport, diffusive or convective, dominates. If the PDMS is an ideal dense membrane, the mass transfer through the membrane is described as diffusive transport with the familiar solution–diffusion model. Bhanushali et al. (Reference Bhanushali, Kloos, Kurth and Bhattacharyya2001) provided a standard flux equation based on the solution–diffusion model as
 $J_{D}\approx A_{D}(\unicode[STIX]{x0394}p-\unicode[STIX]{x0394}\unicode[STIX]{x03C0})$
, where
 $J_{D}$
is the flux,
 $\unicode[STIX]{x0394}p$
and
 $\unicode[STIX]{x0394}\unicode[STIX]{x03C0}$
are the pressure drop and the osmotic pressure drop across the membrane, respectively, and
 $A_{D}$
is the pure solvent permeability coefficient consisting of diffusivity and solubility terms. This model shows good agreement for hydrophobic membranes in various alcohols and alkanes. Chang et al. (Reference Chang, Chung, Yang, Lue, Tung and Lin2012) adopted molecular dynamics simulations to analyse the membrane structure and transport processes. The diffusion coefficient calculated from simulations is in accord with experiments where the PDMS membrane is assumed to be a dense material with a pore diameter of approximately 0.8 nm.
On the other hand, a number of studies have reported that the transport characteristics of PDMS membranes can be rationalized by a convective flow model, which treats PDMS as a porous material. The typical description of convective flow through a porous membrane is Darcy’s law,
 $J_{conv}\sim d_{p}^{2}\unicode[STIX]{x1D719}\unicode[STIX]{x0394}p/L\unicode[STIX]{x1D702}$
, assuming that the internal pore structure is a cylindrical tube bundle or packed bed of spheres, where
 $J_{conv}$
,
 $\unicode[STIX]{x1D719}$
,
 $d_{p}$
,
 $L$
and
 $\unicode[STIX]{x1D702}$
are, respectively, the flux, porosity, pore size, membrane thickness and viscosity of fluid (see Priske et al.
Reference Priske, Lazar, Schnitzer and Baumgarten2016). Robinson et al. (Reference Robinson, Tarleton, Ebert, Millington and Nijmeijer2005) showed that the pore flow model could be applied to a broad range of swelling of PDMS membranes whereas the solution–diffusion model did not adequately describe the higher degrees of swelling. Darvishmanesh et al. (Reference Darvishmanesh, Buekenhoudt, Degrève and Van der Bruggen2009) presented a model combining the pore flow model and solution–diffusion model. The membrane is considered as a parallel connected matrix having the solution–diffusion mechanism of solvent transport and of pores where the solvent is convectively transported without change of concentration. Soltane, Roizard & Favre (Reference Soltane, Roizard and Favre2013) reported that the flux and pressure drop showed a linear relationship when the flux was measured by varying the pressure drop, which is consistent with the convective flow approach, whereas the flux data were also consistent with Fick’s law related to the solution–diffusion model, when it was measured while changing the solvent concentration. Therefore, Priske et al. (Reference Priske, Lazar, Schnitzer and Baumgarten2016) concluded that this phenomenon occurs because the pore size of PDMS is not small or large enough to be described only by the solution–diffusion model or only by the pore flow model, respectively, and thus the mass transfer through the PDMS membrane is a combination of the two transport mechanisms.
To understand liquid transport in PDMS, and other polymer membranes, diffusive and convective processes should be evaluated separately (Phillip et al. Reference Phillip, Amendt, O’Neill, Chen, Hillmyer and Cussler2009; Soltane et al. Reference Soltane, Roizard and Favre2013). Previous studies of PDMS permeability have focused on relatively thick membranes, which retain their shape when subjected to mechanical stress. However, such experiments are not representative of thin permeable PDMS membranes, where relatively large deformations of the membrane can occur.
Accordingly, in this paper, we investigate the permeability of a thin PDMS membrane in convective flow conditions. Our starting point is the general relation between flow rate
 $Q$
and applied pressure drop
 $\unicode[STIX]{x0394}p$
, also known as Darcy’s law:
 $$\begin{eqnarray}Q=\frac{A\unicode[STIX]{x1D705}}{d}\frac{\unicode[STIX]{x0394}p}{\unicode[STIX]{x1D702}}.\end{eqnarray}$$
Here,
 $\unicode[STIX]{x1D705}$
is the permeability of the membrane,
 $A=Lw$
is the cross-sectional area of the membrane of length
 $L$
, width
 $w$
and thickness
 $d$
, and
 $\unicode[STIX]{x1D702}$
is the viscosity of the liquid. Because thin PDMS membranes are flexible, the parameters in the first factor of (1.1), i.e. the area
 $A$
, thickness
 $d$
and pore-level permeability
 $\unicode[STIX]{x1D705}$
, are functions of the applied pressure drop
 $\unicode[STIX]{x0394}p$
. This potentially leads to a nonlinear relationship between the flow rate
 $Q$
and pressure drop
 $\unicode[STIX]{x0394}p$
, which we seek to elucidate.
The following sections describe our set-up (§ 2.1), deformation and flow experiments (§§ 2.2 and 2.3) and a model to describe the relation between permeability and membrane deformation (§ 3.1), which compares favourably to our data (§ 3.2). Finally, we conclude by summarizing our results (§ 4).
2 Experiments
Our experiments were designed to elucidate the relationship between liquid flow rate
 $Q$
and applied pressure drop
 $\unicode[STIX]{x0394}p$
across a soft porous membrane. We begin by describing the experimental set-up and the methods used to quantify flow and deformation.
2.1 Experimental set-up
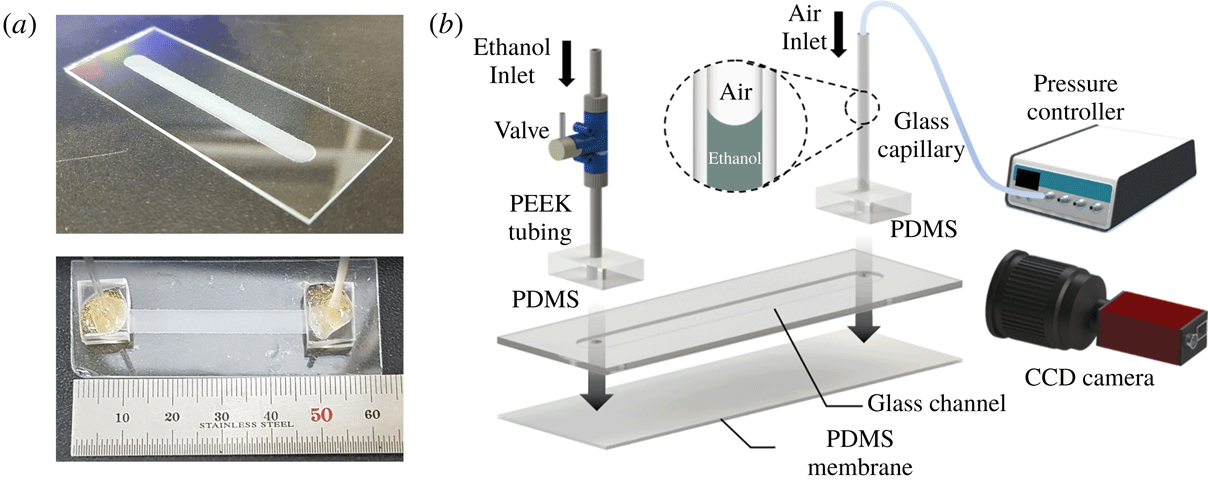
Experimental set-up. (a) Fabricated glass channel (top) and assembled membrane channel (bottom). The glass channel has width
 $w_{0}=5~\text{mm}$
and length
 $L=45~\text{mm}$
. (b) Schematic diagram of the experimental set-up and assembly of the chip. The thin PDMS membrane is bonded at the bottom of the glass chip. The interface of ethanol and air is located in the glass capillary and its position is recorded by a charge coupled device (CCD) camera as pressurized air is supplied by a controller. The change of position of the interface enables measurement of the flow rate across the membrane and of the permeability of the membrane.

The experimental device was fabricated by first milling a shallow rectangular channel into a glass slide. The channel was then covered by a thin PDMS membrane, thus forming a closed chamber. Vertical channels were drilled through the glass slide, so as to provide access to the chamber. The chamber was filled by a viscous liquid (ethanol), and the chamber was pressurized (figure 1). The deflection of the membrane (figure 2) and the flow rate were quantified as a function of the applied pressure drop.
The micro-milled channel and access ports were fabricated from a 1 mm thick glass slide with a milling machine utilizing a cylinder-shaped diamond grinding wheel. The fabricated channel was 5 mm wide (
 $w_{0}$
), 0.5 mm deep and 45 mm long (
 $L$
) (see figure 1
a). A
 $60{-}200~\unicode[STIX]{x03BC}\text{m}$
thick PDMS membrane was prepared by mixing the monomer and curing agent (Sylgard 184, Dow Corning, USA) in a 10 : 1 weight ratio. The PDMS mixture was placed in vacuum desiccator for 30 min for degassing. The membrane was produced by spin coating on a glass substrate for 30 s with selection of the rotation speed to achieve the target membrane thickness
 $d_{0}$
. The glass substrate was coated by silane ((tridecafluoro-1,1,2,2-tetrahydrooctyl)triethoxysilane, Gelest) in a vacuum desiccator prior to the spin coating in order to ease the handling of the thin and fragile PDMS films.
The PDMS membranes were separated from the substrate and bonded, using an oxygen plasma treatment, onto the aforementioned glass slide, thus forming a closed channel. The access ports were connected by rigid tubing (PEEK, Upchurch) to a valve and a glass capillary tube. Both tubes were held in place by thick PDMS blocks. The flow valve enabled us to fill and seal the chamber. The open end of the glass capillary tube was connected with a pressure-controlled pump (MFCSTM-EZ, Fluigent) that allowed us to regulate the pressure inside the channel. The pressure drops used in our experiments were in the range
 $1~\text{kPa}<\unicode[STIX]{x0394}p<15~\text{kPa}$
, significantly above the gravitational pressure head due to the vertical liquid columns (
 ${\sim}0.3{-}0.4~\text{kPa}$
). The device was immersed in an ethanol bath for 6 h prior to starting an experiment. During each experiment, the entire device remained immersed in the ethanol bath to prevent evaporation or air infiltration within the membrane and microchannel. To quantify the flow rate
 $Q$
across the membrane, a charge coupled device camera (Manta G-282, Allied Vision) recorded the movement of the air–liquid interface inside the glass capillary tube. The position of the meniscus as a function of time was obtained using ImageJ (US National Institutes of Health) and MATLAB software based on the analysis of sequential images. The volumetric flow rate
 $Q$
was calculated from the slope of the meniscus position versus time. The same recording set-up was used to quantify the deflection of the PDMS membrane. Images of the membrane deformed by air pressure were analysed with ImageJ.
Deformation and flow across a soft porous membrane. (a) Photographs of a PDMS membrane of thickness
 $d_{0}=100~\unicode[STIX]{x03BC}\text{m}$
in the flat equilibrium state (
 $\unicode[STIX]{x0394}p=0~\text{kPa}$
) and when subjected to a pressure drop
 $\unicode[STIX]{x0394}p=10~\text{kPa}$
. (b) Schematic of the PDMS membrane covering one side of a rectangular glass channel. The pressure drop
 $\unicode[STIX]{x0394}p$
drives the flow rate
 $Q$
across the membrane, and also elastically deforms the PDMS membrane. The amplitude of the deformation
 $u(x)$
is approximately quadratic (see details in the text). (c) Schematic of an undeformed PDMS membrane of initial width
 $w_{0}$
and thickness
 $d_{0}$
, and the deformed membrane of pressure-dependent stretched width
 $w(\unicode[STIX]{x0394}p)$
and thickness
 $d(\unicode[STIX]{x0394}p)$
. The length
 $L$
of the membrane remains constant in our experiments.

2.2 Results: membrane deflection
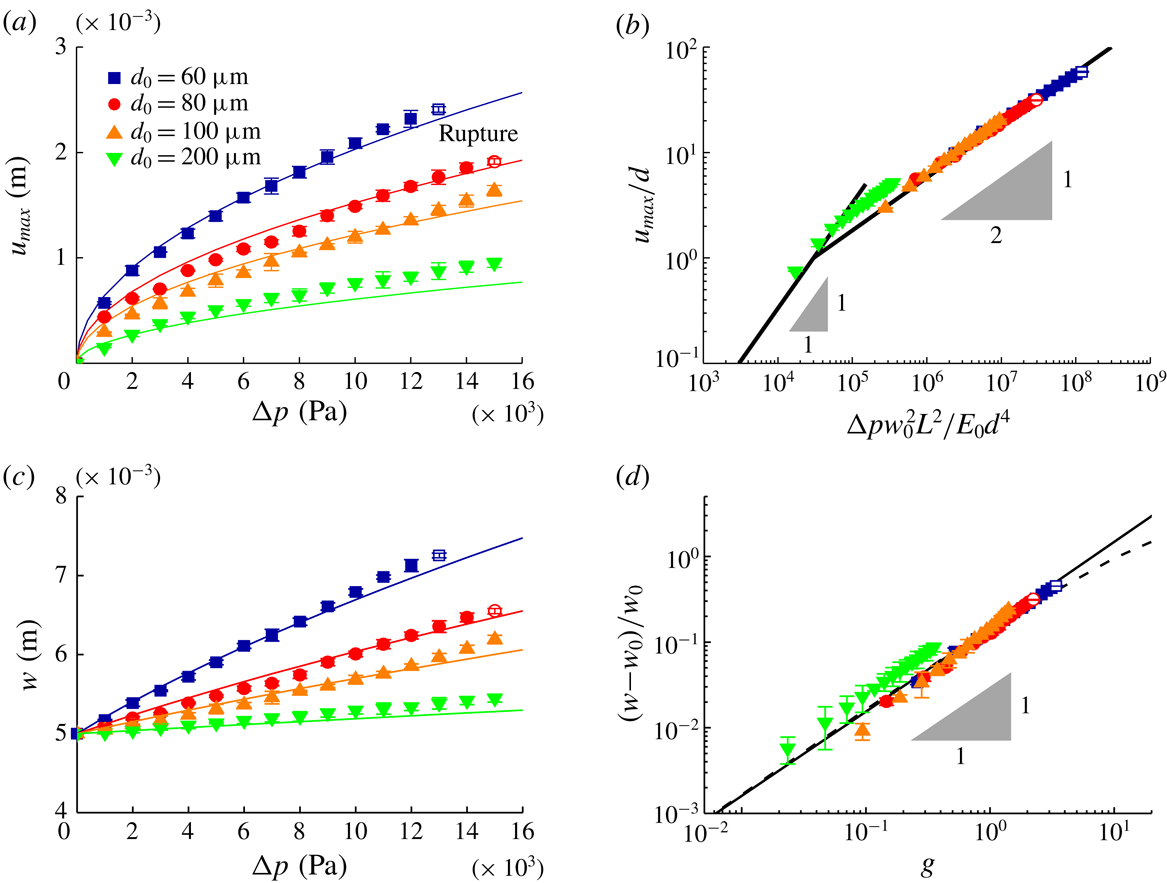
Experimental data. (a) Maximum displacement of the membrane
 $u_{max}$
as a function of the pressure drop
 $\unicode[STIX]{x0394}p$
. Solid lines show the function
 $u_{max}=\unicode[STIX]{x1D6FD}^{\prime }d(\unicode[STIX]{x0394}pw_{0}^{2}L^{2}/E_{0}d^{4})^{1/2}$
, where we fit
 $\unicode[STIX]{x1D6FD}^{\prime }=5.8\times 10^{-3}$
. (b) Rescaled maximum dimensionless displacement plotted as a function of dimensionless applied pressure drop, illustrating the data collapse (solid line). (c) Measured membrane width
 $w$
as a function of the pressure drop
 $\unicode[STIX]{x0394}p$
. Solid lines show the function
 $w=w_{0}\unicode[STIX]{x1D706}$
, where
 $\unicode[STIX]{x1D706}$
is the deformation ratio of the membrane represented in (2.2). (d) Rescaled dimensionless membrane width plotted as a function of
 $g=16\unicode[STIX]{x1D6FD}^{2}L^{2}\unicode[STIX]{x0394}p/E_{0}d_{0}^{2}$
, illustrating the data collapse (solid line is a linear fit and dashed line is (2.2)). The membranes start to rupture at
 $\unicode[STIX]{x0394}p_{c}>10~\text{kPa}$
(open symbols).

To quantify the deformation of the membrane, the pressure in the channel was increased to a level
 $\unicode[STIX]{x0394}p$
above atmospheric using the pressure controller (figure 2
a). The deflection of the PDMS membrane can be described by the vertical displacement
 $u(x,\unicode[STIX]{x0394}p)$
from the initial position
 $u(x,\unicode[STIX]{x0394}p=0)=0$
(figure 2
b). Here,
 $x$
is the distance from the centre of the channel of total width
 $w_{0}$
. We pressurized one inlet of the membrane channel through the glass capillary, but the pressure drop and the variation of membrane displacement along the length direction were negligible because the flow rate
 $Q$
through the membrane is very low and the membrane was sufficiently deformed over its entire area. Figure 3(a) shows the measured maximum displacement
 $u_{max}$
as a function of pressure drop
 $\unicode[STIX]{x0394}p$
for each
 $d_{0}$
. At low to moderate pressures, we observed an inverse relationship between thickness and deformation, and an approximate square-root dependence of the maximum displacement on pressure drop, i.e.
 $u_{max}\sim \unicode[STIX]{x1D6FD}^{\prime }d(\unicode[STIX]{x0394}pw_{0}^{2}L^{2}/E_{0}d^{4})^{1/2}$
, where the constant
 $\unicode[STIX]{x1D6FD}^{\prime }=5.8\times 10^{-3}$
(figure 3
a,b) and the elastic modulus of the PDMS
 $E_{0}=1.89~\text{MPa}$
(see Johnston et al.
Reference Johnston, McCluskey, Tan and Tracey2014). The observed deformation along the long axis of the channel was negligible. The membranes failed at a critical pressure drop
 $\unicode[STIX]{x0394}p_{c}>10~\text{kPa}$
, which gradually increased with the membrane thickness
 $d_{0}$
(figure 3
a).
We note two well-established mathematical models that can be used to estimate the deflection of a thin plate subjected to loads: Kirchhoff–Love (KL) plate theory and the Föppl–von Kármán (FK) equations. Deformations described by KL theory are characterized by a linear relationship between the maximum displacement of the membrane
 $u_{max}$
and the applied load
 $\unicode[STIX]{x0394}p$
. This prediction is consistent with our experiments (figure 3
a,b) for relatively small deformations (
 $u_{max}<d$
). However, the data deviate from KL theory when the deformation exceeds the plate thickness. In this limit, the deformation of the membrane can be described by the FK equations generally, where
 $u_{max}/d\sim (\unicode[STIX]{x0394}pw_{0}^{4}/E_{0}d^{4})^{1/3}$
(see Bouremel et al.
Reference Bouremel, Madaan, Lee, Eames, Wojcik and Khaw2017). In our experiments, the deformation scales as
 $u_{max}/d\sim (\unicode[STIX]{x0394}pw_{0}^{2}L^{2}/E_{0}d^{4})^{1/2}$
, due to the hyperelastic properties of PDMS (see Nunes Reference Nunes2011). Unfortunately, few analytical solutions are known in this case, and numerical simulations would therefore be required to predict the exact relationship between
 $u_{max}$
and
 $\unicode[STIX]{x0394}p$
for elastic materials (see Wang & El-Sheikh Reference Wang and El-Sheikh2005; Razdolsky Reference Razdolsky2015) and hyperelastic materials (see Selvadurai & Shi Reference Selvadurai and Shi2012; Amabili et al.
Reference Amabili, Balasubramanian, Breslavsky, Ferrari, Garziera and Riabova2016).
To simplify the subsequent analysis, we base the discussion on the observed robust scalings of membrane deflection and effective width with pressure drop (figure 3). We observed that the shape of the inflated membrane was well approximated by a quadratic curve whose
 $x$
-intercepts are fixed by the width of the channel
 $x=\pm w_{0}/2$
. Hence, the displacement of the membrane can be expressed as
 $$\begin{eqnarray}u(x)=\frac{4u_{max}}{w_{0}^{2}}\left(\frac{w_{0}}{2}+x\right)\left(\frac{w_{0}}{2}-x\right),\end{eqnarray}$$
where from our observations
 $u_{max}\sim \unicode[STIX]{x1D6FD}^{\prime }d(\unicode[STIX]{x0394}pw_{0}^{2}L^{2}/E_{0}d^{4})^{1/2}$
is a function of the applied pressure drop and membrane thickness. This
 $u_{max}$
can be approximated using the undeformed dimensions as
 $u_{max}=\unicode[STIX]{x1D6FD}d_{0}(\unicode[STIX]{x0394}pw_{0}^{2}L^{2}/E_{0}d_{0}^{4})^{1/2}$
, where
 $\unicode[STIX]{x1D6FD}=7.4\times 10^{-3}$
. The stretched width of the deformed membrane,
 $w$
, was calculated from the arc length of the quadratic curve as
 $\int \sqrt{1+(\text{d}u/\text{d}x)^{2}}\,\text{d}x$
. We expressed this as a deformation ratio of the membrane,
 $\unicode[STIX]{x1D706}$
, as
 $$\begin{eqnarray}w=\frac{w_{0}}{2}\left(\sqrt{1+g}+\frac{\sinh ^{-1}\sqrt{g}}{\sqrt{g}}\right)=w_{0}\unicode[STIX]{x1D706},\end{eqnarray}$$
where
 $g=(4u_{max}/w_{0})^{2}=16\unicode[STIX]{x1D6FD}^{2}L^{2}\unicode[STIX]{x0394}p/E_{0}d_{0}^{2}$
. This model of the membrane width
 $w$
is in accord with experimental data (figure 3
c) and the experimental data collapse to one line after scaling (figure 3
d).
Having established the relationship between applied pressure drop and membrane area, the remaining essential parameter in Darcy’s law (1.1) is the thickness of the deformed membrane
 $d$
. We can estimate the value of
 $d$
by noting that Poisson’s ratio for PDMS is approximately
 $\unicode[STIX]{x1D708}\simeq 0.5$
(Johnston et al.
Reference Johnston, McCluskey, Tan and Tracey2014). Volume conservation then dictates that
 $V_{0}=Lwd$
is constant, i.e. the thickness can be expressed as
 $d=d_{0}w_{0}/w$
.
With these observed variations in membrane dimensions (2.2), we can now express Darcy’s law (1.1) as
 $$\begin{eqnarray}Q=\unicode[STIX]{x1D705}\frac{Lw_{0}}{\unicode[STIX]{x1D702}d_{0}}\unicode[STIX]{x0394}p\unicode[STIX]{x1D706}^{2}.\end{eqnarray}$$
However, it remains unclear whether the permeability
 $\unicode[STIX]{x1D705}$
is also affected by the deformation of the membrane.
Experimental data and comparison to theory. (a) Flow rate
 $Q$
plotted as a function of pressure drop
 $\unicode[STIX]{x0394}p$
(symbols). (b) Membrane permeability
 $\unicode[STIX]{x1D705}$
plotted as a function of pressure drop
 $\unicode[STIX]{x0394}p$
(symbols). The open symbols in (a,b) mean the rupture threshold value
 $\unicode[STIX]{x0394}p_{c}$
. The dashed lines in (a) illustrate Darcy’s law with a simple geometric correction and constant permeability
 $\unicode[STIX]{x1D705}_{0}=0.45~\text{nm}^{2}$
(2.3). The solid lines in (a,b) show our full model, where the microscopic pore structure is altered by the macroscopic deformation of the membrane (3.7).

2.3 Results: membrane permeability
To quantify the permeability
 $\unicode[STIX]{x1D705}$
of the PDMS membrane, we measured the liquid flow rate
 $Q$
between the enclosed channel and the surrounding reservoir driven by the applied pressure drop
 $\unicode[STIX]{x0394}p$
. At relatively low pressures, our experiments show a linear relationship between flow rate
 $Q$
and applied pressure drop
 $\unicode[STIX]{x0394}p$
(figure 4
a), in accord with (1.1) and (2.3) with constant permeability
 $\unicode[STIX]{x1D705}_{0}=0.45~\text{nm}^{2}$
(figure 4
b). At moderate pressures, however, the data deviate from this trend; the flow rate
 $Q$
scales sub-linearly with the applied pressure drop
 $\unicode[STIX]{x0394}p$
. Finally, the flow rate increases sharply as the pressure approaches the rupture threshold value
 $\unicode[STIX]{x0394}p_{c}$
.
Comparing our data to the modified Darcy equation (2.3), in figure 4(a), we observe reasonable agreement at low pressures. However, this model, which assumes a constant permeability
 $\unicode[STIX]{x1D705}=\unicode[STIX]{x1D705}_{0}$
, is clearly unable to account for the sub-linear scaling of flow with pressure drop at moderate to high pressures (figure 4
a). To further elucidate the link between permeability and applied pressure drop, we can determine the effective permeability directly from the observed data by solving for
 $\unicode[STIX]{x1D705}$
in (2.3):
 $$\begin{eqnarray}\unicode[STIX]{x1D705}=\frac{Q\unicode[STIX]{x1D702}d_{0}}{Lw_{0}\unicode[STIX]{x0394}p}\unicode[STIX]{x1D706}^{-2},\end{eqnarray}$$
shown in figure 4(b) as symbols. According to our data, the effective permeability decreases with pressure. In the following, we proceed and attempt to rationalize the observed decrease in permeability due to changes in the membrane microstructure.
3 Theory
3.1 Effects of pore deformation on membrane permeability
We consider flow through a PDMS membrane to elucidate the impact of macroscopic deformations on the membrane permeability
 $\unicode[STIX]{x1D705}$
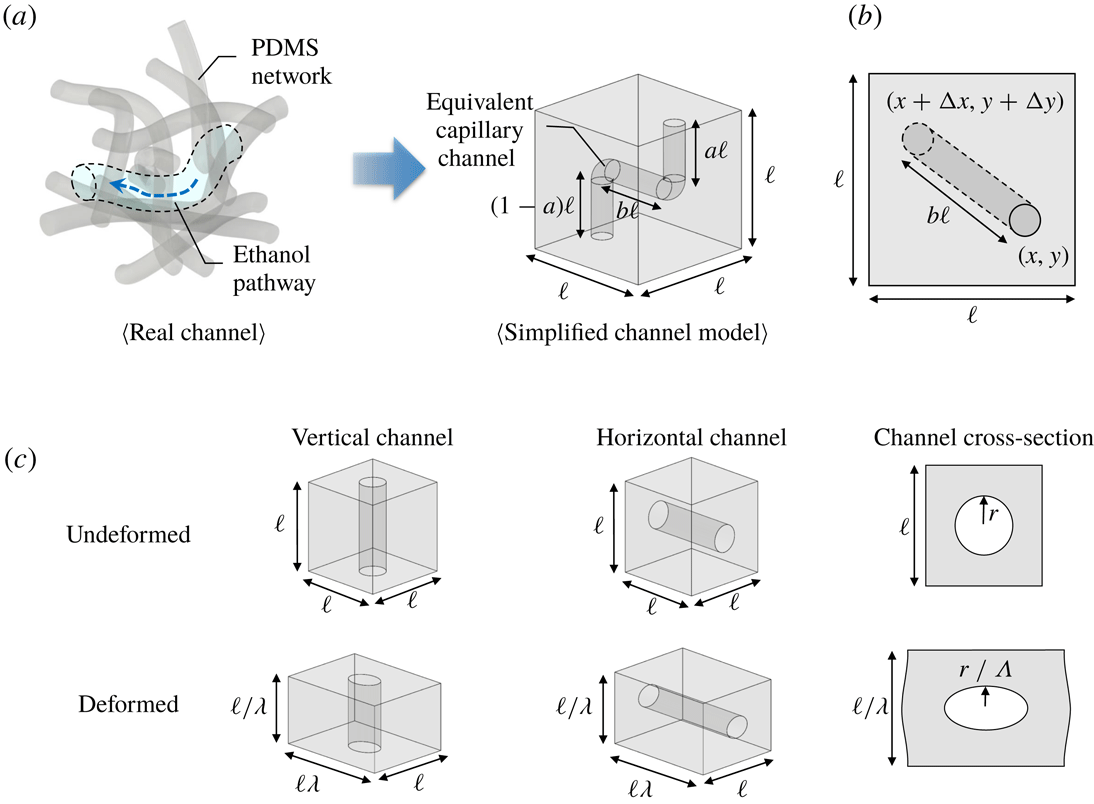
. We model PDMS as a porous medium containing numerous interconnected channels. To understand how the deformation of the internal nano-dimension channels caused by membrane deformation affects the permeability, we introduce a simplified geometric model (figure 5
a). In our model, the pore structure in a cube with sides of length
 $\ell$
are cylindrical channels consisting of vertical and horizontal tubes of equal hydraulic resistance that connect the inlet and outlet at random positions on the top and bottom of the cube (figure 5
b). The total length of vertical channels is the same as the height of the cube, i.e.
 $\ell$
. The inlet and outlet are located at random positions
 $(x,y)$
and
 $(x+\unicode[STIX]{x0394}x,y+\unicode[STIX]{x0394}y)$
representing values of horizontal distance,
 $b\ell =\sqrt{(\unicode[STIX]{x0394}x)^{2}+(\unicode[STIX]{x0394}y)^{2}}$
, where
 $b$
is a constant. The horizontal length between the inlet and outlet was calculated from the probability of positions. We assume that all locations for the inlet/outlet on the top/bottom of cube are randomly distributed with same probability. Within the various combinations, the horizontal channel length was decided as
 $0.52\ell$
, which gave the maximum probability among inlet and outlet locations.
(a) In a real PDMS membrane, the fluid flows within small and complex shape pores and channels surrounded by the PDMS network. A representative complex channel is simplified as an equivalent capillary channel assuming that it has the same hydraulic resistance as the real channel. (b) The top view of the simplified channel model shows the length of horizontal channel, which can be estimated using statistical methods. (c) Schematics of the deformation of simplified (nano)channels in a PDMS network. The vertical/horizontal channels are deformed into wide/narrow and long/short shapes. Since the wall and the interior of the channel have different physical properties, channels deform more than bulk PDMS (
 $r/\unicode[STIX]{x1D6EC}=r/[1+c(\unicode[STIX]{x1D706}-1)]$
).

When the pressure is applied, the cube is deformed in the same proportion as the membrane as follows:
 $\ell \rightarrow \ell \unicode[STIX]{x1D706},\ell \rightarrow \ell /\unicode[STIX]{x1D706}$
and
 $\ell \rightarrow \ell$
in width, thickness and length, respectively. As shown in figure 5(c), the nanochannel is also deformed along with the cube so that the cross-section of a channel is transformed from circular to elliptic, and its length is also changed. The hydraulic resistance of a vertical channel decreases due to the increasing cross-sectional area and the reduction in length, whereas the hydraulic resistance of a horizontal channel increases.
The relation between pressure drop and flow rate for elliptic cylinders of semi-axes
 $r_{1}$
and
 $r_{2}$
is given by (see Bruus Reference Bruus2007)
 $$\begin{eqnarray}Q_{P}=\frac{\unicode[STIX]{x03C0}}{4}\frac{1}{\unicode[STIX]{x1D702}\ell _{c}}\frac{r_{1}^{3}r_{2}^{3}}{r_{1}^{2}+r_{2}^{2}}\unicode[STIX]{x0394}p=\frac{\unicode[STIX]{x0394}p}{R},\end{eqnarray}$$
where
 $Q_{P}$
is the Poiseuille flow rate,
 $\unicode[STIX]{x0394}p$
is the applied pressure drop,
 $R$
is the hydraulic resistance and
 $\ell _{c}$
is the channel length. In a circular channel,
 $r_{1}=r_{2}=r_{0}$
, where
 $r_{0}$
is the radius of the circular channel without deformation. When the cube of PDMS is deformed (figure 5
c), the inner channel is significantly deformed. This can be represented by an effective elastic modulus of the channel
 $E_{c}=E_{0}(\unicode[STIX]{x0394}\ell /\ell )/(\unicode[STIX]{x0394}r/r)=(1/c)E_{0}$
, where
 $\ell +\unicode[STIX]{x0394}\ell =\ell \unicode[STIX]{x1D706}$
, since the liquid inside the channel is also affected (see Gangi Reference Gangi1978; Zhang et al.
Reference Zhang, Standifird, Roegiers and Zhang2007). A correction factor
 $c=7$
, the value of which was selected by comparison with the experiments, was introduced to apply the effective elastic modulus of the channel and allowed for
 $r_{1}$
,
 $r_{2}$
and
 $\ell _{c}$
to be expressed as a function of pressure drop according to
 $$\begin{eqnarray}\left.\begin{array}{@{}c@{}}\text{Horizontal:}\quad r_{1}=r_{0},\quad r_{2}=r_{0}/\unicode[STIX]{x1D6EC},\quad \ell _{c}=b\ell \unicode[STIX]{x1D706},\\ \text{Vertical:}\quad r_{1}=r_{0}\unicode[STIX]{x1D6EC},\quad r_{2}=r_{0},\quad \ell _{c}=\ell /\unicode[STIX]{x1D706},\end{array}\right\}\end{eqnarray}$$
where the deformation ratio of the channel
 $\unicode[STIX]{x1D6EC}$
is
 $$\begin{eqnarray}\unicode[STIX]{x1D6EC}=(r+\unicode[STIX]{x0394}r)/r=1+c(\unicode[STIX]{x1D706}-1).\end{eqnarray}$$
In this notation, the hydraulic resistances of the horizontal channel
 $R_{H}$
and vertical channel
 $R_{V}$
can be written as
 $$\begin{eqnarray}\left.\begin{array}{@{}c@{}}R_{H}=b(R_{0}/2)\unicode[STIX]{x1D706}(\unicode[STIX]{x1D6EC}^{3}+\unicode[STIX]{x1D6EC}),\\ R_{V}=(R_{0}/2)(1/\unicode[STIX]{x1D706})(1/\unicode[STIX]{x1D6EC}^{3}+1/\unicode[STIX]{x1D6EC}),\end{array}\right\}\end{eqnarray}$$
where the hydraulic resistance of a circular channel is
 $R_{0}=8\unicode[STIX]{x1D702}\ell /\unicode[STIX]{x03C0}r_{0}^{4}$
. The total resistance of the deformed channel is
 $R_{tot}=R_{H}+R_{V}$
, since the nanochannels are connected in series. The initial total resistance is
 $R_{i}=(1+b)R_{0}$
.
To determine the effective permeability, we note that Darcy’s law represents the total flow rate through a porous medium, which is composed of individual channels. Assuming that the PDMS membrane consists of
 $n$
parallel channels, the total flow is
 $$\begin{eqnarray}Q=nQ_{P}.\end{eqnarray}$$
Finally, from the general relations between flow and applied pressure drop (
 $Q\approx \unicode[STIX]{x1D705}\unicode[STIX]{x0394}p\approx \unicode[STIX]{x0394}p/R$
), it is clear that hydraulic resistance
 $R$
and permeability
 $\unicode[STIX]{x1D705}$
, as defined here, are inversely related. From these considerations, we can express the pressure-dependent permeability
 $\unicode[STIX]{x1D705}$
as a function of the deformation ratio of the membrane
 $\unicode[STIX]{x1D706}$
and the channel
 $\unicode[STIX]{x1D6EC}$
by
 $$\begin{eqnarray}\unicode[STIX]{x1D705}=\unicode[STIX]{x1D705}_{0}\frac{R_{i}}{R_{tot}}=\unicode[STIX]{x1D705}_{0}\frac{2(1+b)\unicode[STIX]{x1D706}\unicode[STIX]{x1D6EC}^{3}}{(1+\unicode[STIX]{x1D6EC}^{2})(1+b\unicode[STIX]{x1D706}^{2}\unicode[STIX]{x1D6EC}^{4})},\end{eqnarray}$$
where
 $\unicode[STIX]{x1D705}_{0}$
is the permeability of the undeformed PDMS membrane,
 $\unicode[STIX]{x1D6EC}$
is
 $1+c(\unicode[STIX]{x1D706}-1)$
and the constants
 $b$
and
 $c$
are 0.52 and 7, respectively.
3.2 Comparison between theory and experiments
With the expression for the pressure-dependent permeability
 $\unicode[STIX]{x1D705}$
(3.6), we are now in a position to reformulate Darcy’s law (2.3) for the deformable material:
 $$\begin{eqnarray}Q=\frac{\unicode[STIX]{x1D705}_{0}Lw_{0}}{\unicode[STIX]{x1D702}d_{0}}\unicode[STIX]{x0394}p\frac{2(1+b)\unicode[STIX]{x1D706}^{3}\unicode[STIX]{x1D6EC}^{3}}{(1+\unicode[STIX]{x1D6EC}^{2})(1+b\unicode[STIX]{x1D706}^{2}\unicode[STIX]{x1D6EC}^{4})}.\end{eqnarray}$$
Comparing our data to the modified permeability (3.6) and Darcy equation (3.7), we observe good agreement at both low and moderate pressures (figure 4). In the case of
 $d_{0}=200~\unicode[STIX]{x03BC}\text{m}$
where deformation is small, the flow rate does not agree well because the model equation (2.2) underestimates the actual experiment (figure 3). Data near the rupture pressure drop
 $\unicode[STIX]{x0394}p_{c}$
deviate from our model in that the permeability increases with the deformation, presumably due to the formation of microscopic ruptures in the membrane, or violations of the no-slip boundary condition at sufficiently small length scales (e.g. Choi et al.
Reference Choi, Westin, Johan and Breuer2003; Priezjev Reference Priezjev2007; Ramos-Alvarado, Kumar & Peterson Reference Ramos-Alvarado, Kumar and Peterson2016; Hu et al.
Reference Hu, Bao, Priezjev and Luo2017).
4 Conclusion
In this study, we investigated the permeability of deformed hyperelastic thin PDMS membranes in pressure-driven flow. Our experimental results were inconsistent with Darcy’s law (1.1) with constant permeability
 $\unicode[STIX]{x1D705}_{0}$
, and revealed that the flow rate
 $Q$
depends nonlinearly on the applied pressure drop
 $\unicode[STIX]{x0394}p$
(figure 4). These observations suggest that the effective permeability
 $\unicode[STIX]{x1D705}$
decreases until a moderate pressure drop and then increases before rupture. To rationalize our data, we developed a model that incorporates the effects of pressure-induced deformation at distinct scales: at macroscopic scale, the membrane surface area increases while the membrane thickness decreases with pressure; whereas at the nanoscale, the structure of the porous material, modelled as nanochannels, is deformed. With these corrections to the permeability (3.6) and Darcy’s equation (3.7), we observe a good agreement between theory and experiments (figure 4) at low to moderate pressures. Data near the rupture pressure deviate from our model, presumably due to the formation of microscopic ruptures in the membrane, or violations of the no-slip boundary conditions at sufficiently small length scales. Our results represent a novel case in which macroscopic deformations can have an impact on the microstructure and transport properties of soft materials. It would be beneficial to apply the results to design or understand other mass transport processes through soft, deformed porous membranes.
Acknowledgements
J.L. acknowledges the support by Basic Science Research Program through the National Research Foundation of Korea (NRF) funded by the Ministry of Science, ICT & Future Planning (2014M3C1B1033982 and 2017R1A2B2006964). H.A.S. thanks the NSF for support via grants CMMI-1661672 and DMR-1420541. K.H.J. was supported by a research grant (13166) from VILLUM FONDEN.