Rather surprisingly, the key findings from non-partisan Get Out the Vote (GOTV) campaigns—that campaign interventions have civic benefits by increasing electoral participation, and that personalized interventions are more effective than impersonal contact methods (Green and Gerber Reference Green and Gerber2008; Green, Aronow and McGrath Reference Green, Aronow and McGrath2013)—do not fully generalize to partisan campaigns. In spite of using similar contact methods, such as canvassing, telephone calls and leafleting, extant field studies randomizing contact with a partisan campaign show mixed results (Green Reference Green2004; Nickerson, Friedrichs and King Reference Nickerson, Friedrichs and King2006; Arceneaux Reference Arceneaux2007; Huber and Arceneaux Reference Huber and Arceneaux2007; Bailey, Hopkins and Rogers 2016; Barton, Castillo and Petrie Reference Barton, Castillo and Petrie2014; Doherty and Adler Reference Doherty and Adler2014; Kendall, Nannicini and Trebi 2014). Green, Aronow and Mc-Grath (Reference Green, Aronow and McGrath2013) conclude from their meta-analysis of 79 experiments using non-partisan direct mail and 31 experiments using advocacy-direct mail, including both party-and issue-based endorsements, that the effects of non-partisan mailings and advocacy mailings differ significantly. While non-partisan direct mail on average has a positive effect on turnout, advocacy mailings have a negative, but statistically insignificant effect. It is particularly striking that field experiments that randomize partisan contact at the aggregate level have consistently failed to show an increase in voter turnout (Ramiro, Morales and Jiménez-Buedo Reference Ramiro, Morales and Jimenez-Buedo2012; Pons and Liegey Reference Pons and Liegey2016; Kendall, Nannicini and Trebbi 2014; Pons Reference Pons2014).
To conclude from these mixed results that partisan campaigns are ineffective at influencing turnout is to misunderstand the goal of political parties when they make contact with voters. In contrast to non-partisan campaigns, political parties are not civic charities. They do not aim to increase turnout across the board (Gerber Reference Gerber2004; Holbrook and McClurg Reference Holbrook and McClurg2005; Nickerson Reference Nickerson2005). Instead, parties want to change the outcome of an electoral contest and there are different strategies of achieving this goal. Of course parties can act strategically and target GOTV efforts at party supporters or at places with the greatest density of support in a targeted mobilization strategy. In reality, most parties in countries other than the United States and Britain cannot follow this campaign strategy because they do not have access to valid and reliable data that would allow them to discriminate effectively between their supporters and opponents in the electorate. It is therefore no surprise that campaign experiments conducted with political parties in France, Spain and Italy have consistently failed to show positive effects on turnout (Ramiro, Morales and Jiménez-Buedo Reference Ramiro, Morales and Jimenez-Buedo2012; Pons and Liegey Reference Pons and Liegey2016; Kendall, Nannicini and Trebbi 2014; Pons 2016).
Even in the United States and Britain, where campaign targeting and canvassing is more advanced than elsewhere, it may explicitly make sense to include supporters of rival parties as targets of campaign interventions, assuming that campaign communication can win over voters or reduce turnout amongst those unlikely to support the party or candidate. For political parties and candidates, the key is to change the composition of the electorate, not to increase turnout. Many real-world campaign interventions include a double-edged appeal both to turnout and to vote for a particular candidate or party (for a discussion, see Nickerson, Friedrichs and King Reference Nickerson, Friedrichs and King2006, 86). However, in spite of experimental results pointing to the possibility that political preferences might condition mobilization effects (McNulty Reference McNulty2005; Shi Reference Shi2015; Foos and de Rooij Reference Foos and de Rooij2016), the large majority of field experiments that randomize contact at the aggregate (Kendall, Nannicini and Trebbi 2014; Pons Reference Pons2014) or the individual level (Nickerson Reference Nickerson2005; Nickerson, Friedrichs and King Reference Nickerson, Friedrichs and King2006) have problems identifying heterogeneous mobilization effects conditional on pre-intervention party support. At the aggregate level, null effects might mask that the intervention mobilized party supporters, but demobilized opponents. This possibility is of course particularly pronounced in multi-party systems such as Britain, France, Germany, Spain and Italy, where supporters of one particular party make up a smaller fraction of the electorate.
Aiming to throw more light on the effects of partisan campaign interventions on the partisan composition of the electorate, this paper reports results from a Conservative Party ground campaign using personal door-to-door visits and impersonal leaflets. The research site is the English town of Keynsham in the North East Somerset parliamentary constituency. Working with the local constituency Conservative Party in the run up to the 2014 European Parliament elections,Footnote 1 the intervention included 6123 registered voters.
Using the constituency office records on individual party support, we estimate the effect of the treatment on turnout overall, and on the turnout of supporters of different political parties. We find that the party’s ground campaign, based on leaflets and door-to-door canvassing, did not increase turnout overall, but instead had a negative effect. Our analyses show that the campaign had a significantly more negative effect on supporters of rival parties than on supporters of the Conservative Party.
In this way, using campaign tactics that are frequently employed by Conservative constituency campaigns in the United Kingdom, the interventions worked to the party’s advantage while failing to increase turnout at the aggregate. This study contributes to a more nuanced understanding of how ground campaigns can shape the composition of the electorate, while adding to the growing literature that points to some of the paradoxical consequences of campaign interventions for political participation (Enos, Fowler and Vavreck Reference Enos, Fowler and Vavreck2014).
How Can Campaign Contact Shape the Composition of the Electorate?
We are of course not the first to entertain the thought that partisan campaigns might result in differential turnout effects. As Holbrook and McClurg argue, “[presidential] campaigns are most influential in shaping the partisan composition of the electorate rather than its overall size” (Reference Holbrook and McClurg2005, 695). Moreover, as conclusions from two large field experiments conducted in collaboration with the French and Spanish Socialist Parties show, partisan ground campaigns routinely fail to lead to higher turnout in the aggregate, while at the same time increasing the vote share of the party that initiates the campaign intervention. While both Ramiro, Morales and Jiménez-Buedo (Reference Ramiro, Morales and Jimenez-Buedo2012, 23) and Pons (Reference Pons2014) explicitly mention that their intervention also targeted supporters of rival parties, and they briefly entertain the thought that their intervention could have demobilized opponents, they opt for an explanation focused on persuasion rather than differential mobilization. As Pons (Reference Pons2014, 164) writes:
There are two possible interpretations of the results. The first is that the intervention mobilized left-wing non-voters and cross-pressured and demobilized an equal number of (far) right-wing voters (Fiorina Reference Fiorina1976).
It is not only field experiments that measure turnout at the aggregate level that show results consistent with differential mobilization. McNulty (Reference McNulty2005, 53) found that Republicans that were contacted by a Democratic campaign were less likely to vote than the control group, albeit his sample size of Republican supporters was too small to detect significant effects. Stronger evidence is presented by Shi (Reference Shi2015) who examines the effects of a campaign on same sex marriage that demobilized Republicans opposed to the issue. As Shi (Reference Shi2015) indicates, there is an important theoretical explanation for why campaigns can lead to demobilization among opponents. Political information that conflicts with political beliefs, attitudes or predispositions can create internal cross-pressure (Fiorina Reference Fiorina1976; Hillygus and Shields Reference Hillygus and Shields2008) and cognitive dissonance (Festinger Reference Festinger1957) among voters. This work on cross-pressure goes back to the classic studies of electoral politics (Lazarsfeld, Berelson and Gaudet Reference Lazarsfeld, Berelson and Gaudet1948; Berelson, Lazarsfeld and McPhee Reference Berelson, Lazarsfeld and McPhee1954). One means of avoiding internal cross-pressure and cognitive dissonance is to abstain from making a choice (Hirschman Reference Hirschman1970; Fiorina Reference Fiorina1976). Campaigns that target supporters of rival parties might hence affect their turnout behavior via those psychological mechanisms. Exit might be a rational strategy for cross-pressured citizens if they want to relieve the cognitive dissonance caused by campaign interventions from candidates they oppose. Non-voting relieves the tension of voting for one’s party when pressured not to do so, but it also prevents the tension that would be induced by being disloyal. For a campaign, it is beneficial if rival party supporters are demobilized. If they do not turn out, they do not vote for the other candidate. Even if voters followed an acceptance–rejection rule according to which they would be less likely to accept campaign messages from sources that did not match their partisan preferences (Zaller Reference Zaller1992), we would still expect differential mobilization effects between supporters of the party that initiates contact and supporters of rival parties (Foos and de Rooij Reference Foos and de Rooij2016). The only worry for a campaign should be counter-mobilization that might occur when supporters of rival parties do the opposite of what a campaign would want them to do (Lupia and McCubbins Reference Lupia and McCubbins1998). While messages have been shown to “backfire” in survey experiments (see, for instance, Nyhan and Reifler Reference Nyhan and Reifler2010). Arceneaux and Kolodny (Reference Arceneaux and Kolodny2009) remain the only researchers to detect counter-mobilization effects as a result of randomized campaign interventions in the field. As a campaign strategy, demobilization might hence be particularly effective in challenging electoral environments where parties have trouble persuading supporters of other parties and where their own supporters are difficult to mobilize. In such cases, reducing turnout among opponents could be the most cost-effective way of tipping the partisan balance of an electorate in a party’s favor.
Are Standard, Light-Touch, Campaign Methods Effective?
Other dimensions on which to understand the difference between partisan and non-partisan GOTV campaigns are mode and content. One of the best-known and most widely cited result from the non-partisan GOTV literature is that face-to-face contact (Green and Gerber Reference Green and Gerber2008; Green, Aronow and McGrath Reference Green, Aronow and McGrath2013), and heavy hitting interventions such as social pressure mailings (Gerber, Green and Larimer Reference Gerber, Green and Larimer2008) are most effective at encouraging turnout.
But inherent differences between partisan and non-partisan campaigns may explain why messages might fail to reproduce some of the effect hierarchies that we have come to expect from non-partisan GOTV campaigns. In fact, while some partisan experiments replicate expected hierarchies of treatments, such as Arceneaux (Reference Arceneaux2007) and Nickerson (Reference Nickerson2006), others do not (Adams and Smith Reference Adams and Smith1980; McNulty Reference McNulty2005; Nickerson, Friedrichs and King Reference Nickerson, Friedrichs and King2006; Shaw et al. Reference Shaw, Green, Gimpel and Gerber2012; Doherty and Adler Reference Doherty and Adler2014). Light-touch and even impersonal interventions might be effective in a partisan context because parties have a history of interacting with constituents. Establishing a social connection between the campaign and the voter through social interaction, which is seen as an important stimulus of turnout (Rogers, Fox and Gerber Reference Rogers, Fox and Gerber2012), would therefore be unnecessary. Impersonal forms of communication might be sufficient to affect electoral behavior in repeated interactions. It is striking that when sent to voters who already interacted with a campaign, even impersonal light-touch methods such as text messages are effective at increasing turnout (Dale and Strauss Reference Dale and Strauss2009). Dale and Strauss (Reference Dale and Strauss2009) argue that text messages are effective because they are noticeable reminders. If we combine the idea of repeated interactions using noticeable but light-touch interventions in the low-salience context of the European and local elections in the United Kingdom, we might expect that noticeable party reminders, no matter their form, will mostly influence voters who vote in General Elections, but who are at the verge of non-voting because of the low-salience of the second order election.
From this review, we would not expect a partisan campaign targeted toward the entire electorate to result in higher levels of turnout. Yet, even impersonal and light-touch modes of campaign interactions might be effective at shaping the composition of the electorate because campaigns relate to already existing social and political connections. Our differential mobilization hypothesis hence predicts that campaign interventions will lead party supporters (and to a lesser extent) unattached voters who are at the verge of non-voting to continue voting, while supporters of rival parties who are at the verge of non-voting in the low salience election might be pushed across the abstention threshold because they are cross-pressured by interacting with a party they dislike.
Study Design
The site of the study was the small town in Keynsham in the west of England. The intervention was organized and delivered by the staff at the North East Somerset Conservative Party constituency offices in the three-week campaign period before the 2014 European Elections, which took place on 22 May. Keynsham is in the South West European Parliament constituency, which has six Members of the European Parliament (MEPs) (before the 2014 election, which saw two Conservatives, two United Kingdom Independence Party (UKIP), one Green and one Labour MEP elected, three out of six MEPs were Conservative, one Liberal Democrat and two UKIP). The study area was the wards of North and South Keynsham which are within walking distance of the constituency office. North Keynsham has 2073 dwellings, and 5035 individuals; South Keynsham has 2253 dwellings and 5019 individuals. All addresses with registered voters in the two wards were selected. Postal voters were removed on the grounds that they would have already cast their ballots by the time of the campaign. Hard-to-reach addresses, such as homes for the elderly, were removed where these were known. Randomization was blocked by ward: in Keynsham North, out of 1660 households (3253 individuals), 500 were randomly allocated to the canvass group and 500 to the leaflet group; in Keynsham South, out of 1559 households (2870 individuals), two randomly selected groups of 500 were also allocated to canvass and leaflet groups. This procedure created the final sample: 1000 households to be canvassed; 1000 to receive a leaflet; and the rest—1219—to be left in the control group. An innovative aspect of this design is that it is able to isolate the treatment effect for canvassing even though all members of the canvass group also received a leaflet because the leaflet group was used as a control group from which an instrumental variable analysis could be conducted. In this way, it was possible to mimic the design of a campaign a local Conservative party would normally run while retaining the ability to make a causal inference. With households as the unit of randomization and contact, individual voters, from whom the outcome of voter turnout is measured, are clustered within these households. We take account of this feature of the design at the analysis stage. Since we intended to estimate mobilization effects by partisan group, it was important that the constituency office pre-recorded detailed data of the voting intentions of subjects based on previous canvassing campaigns.Footnote 2 We divided our sample into three main categories: Conservative supporters, supporters of rival parties (Labour, Liberal Democrats, UKIP, Green Party, etc.), and unattached voters (non-identifiers, non-voters and subjects with missing party identification data). We chose to rely on three broad partisan groups because canvassing data is a noisy measure of party support. While in the United Kingdom it is common practice for voters to volunteer their voting intentions to canvassers from rival parties, they sometimes choose to report vaguely, indicating for instance that they are “Against Conservatives.” Moreover, the “out-partisan” category has been validated using traditional phone interviews (Foos Reference Foos2015, Chapter 3). As the extensive robustness checks reported in the analysis section demonstrate, our findings are robust to a more fine-grained operationalization of party support.
The interview protocol was finalized after a pilot carried out on 15 and 16 April at 159 addresses, which were removed from the sample before randomization. The protocol for the canvass group was a door knock at the intervention group addresses where the canvasser sought to talk to a person on the electoral register. The canvasser left a leaflet—either to give to the respondent or put through the door if there was no response. The canvasser recorded whether a contact had taken place and even a brief opening of the door counted. The message was a standard question about whether the respondent was intending to vote Conservative and an encouragement to vote for the party. The script ran as follows: “Good morning/afternoon/evening. I am from the Conservative Party. (Hand over leaflet). I am just checking to see if you are going to vote Conservative in the upcoming European elections.” If response was yes/no and the person is the only elector in the household, the canvasser went on to say “I am very glad/sorry to hear about that. We look forward to getting your vote/I’m sorry we won’t be getting your vote but thank you anyway.” If the response was yes/no and there were other electors in the household the script was “I am very glad/sorry to hear about that. And which way are other members of the household voting? Thank you for your help.” There was no script beyond this point. The canvasser did not give any indication that the respondent should turn out in general or that turnout was a good thing, eschewing the classic GOTV techniques such as emphasizing civic duty. In some cases conversations carried on about matters in local politics or anything else of interest to the voter as there was an emphasis on keeping the contact natural and informal. In practice, the intervention was usually short, lasting about 2 minutes.Footnote 3 The canvasser recorded which person from the household he or she had spoken to and whether they intended to vote Conservative or not, or noted which other party they intend to vote for or whether not intending to vote.
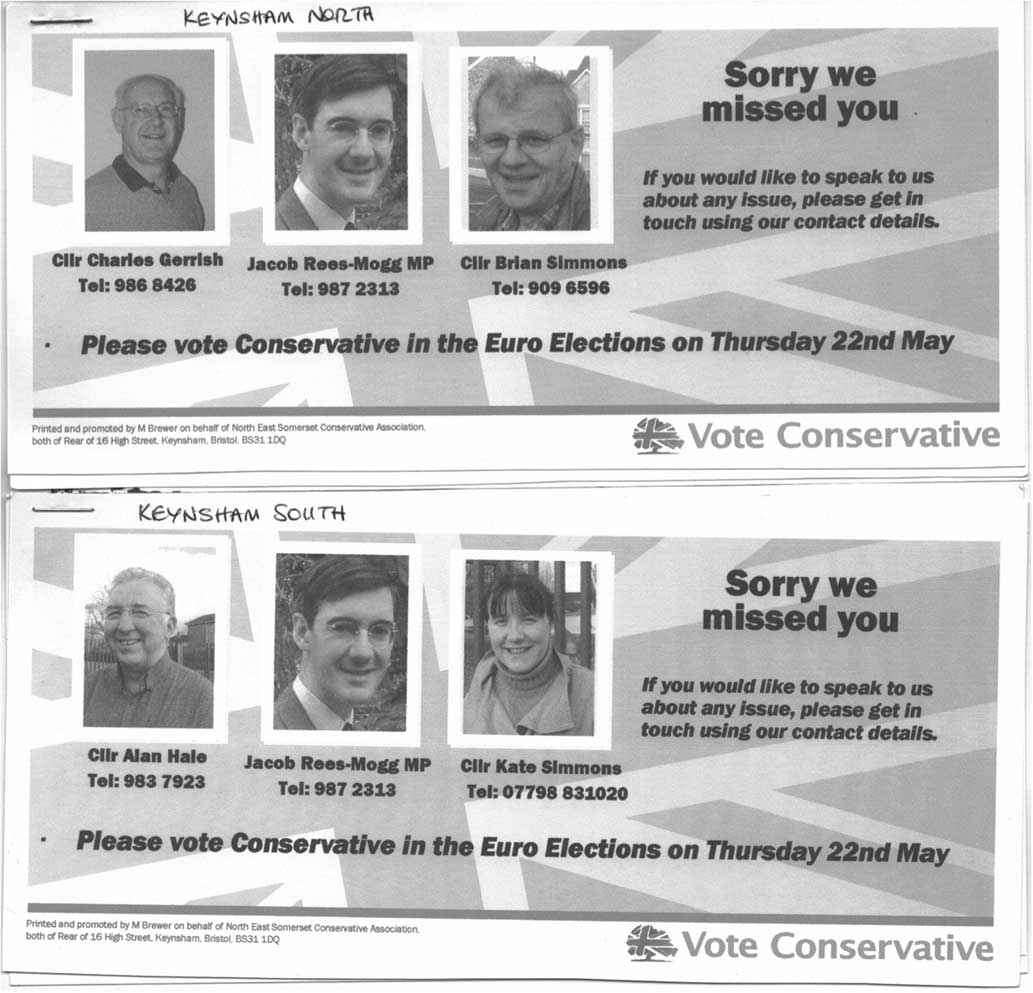
The constituency office produced lists of addresses from the canvass treatment and then created walkways. Canvassing was carried out during the three weeks before the election date. There were 12 canvassers in total, including the local MP; but the local councilors carried out most of the door knocks.Footnote 4 Canvassers attempted to treat subjects in 1000 households and were successful at contacting 406 households including a total of 808 subjects. This represents 41 percent of households or 43 percent of subjects that were cluster-randomly assigned to the canvassing treatment. The group of compliers includes 252 Conservative voters, 204 supporters of rival parties and 354 subjects who were listed as unattached. Leaflets delivered via mail were the same as those received by the canvass group (see Figure 1). This printed document showed pictures of three local politicians (not the European Parliament candidates, but the local MP and two councilors), and invited the respondent to vote Conservative. There was no explicit GOTV message. The control households were left alone.
Leaftet given to all treatment households in Keynham North and Keynham South

Data were recorded in the constituency office. Before random assignment, the party made available data about party support available to us, which it had recorded from previous canvassing. In order to perform a randomization check, we also obtained pre-treatment data on (verified) turnout in the 2010 General Election, and the sex of the voter. In order to check if, taken together, our pre-treatment covariates significantly predict treatment assignment, we regress assignment to one of the two treatment groups (1) or to control (0) on all available pre-treatment covariates (2010 turnout, gender and pre-treatment party support), and conduct a joint f-test. The p-value of 0.16 indicates that covariate differences between treatment and control groups are not statistically significant (Table A1 in the Supporting Information provides detailed information on covariate balance between treatment and control groups).Footnote 5 After the election in May 2014, turnout data were requested from the local authority and matched to the data set. Data were prepared by the office and were sent to the researchers.
Results
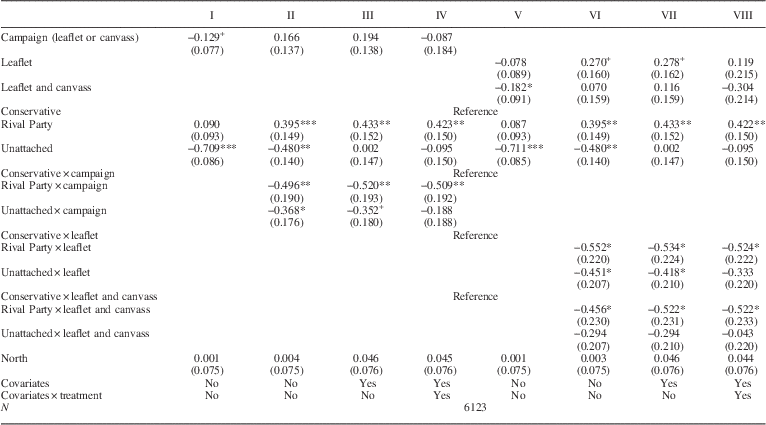
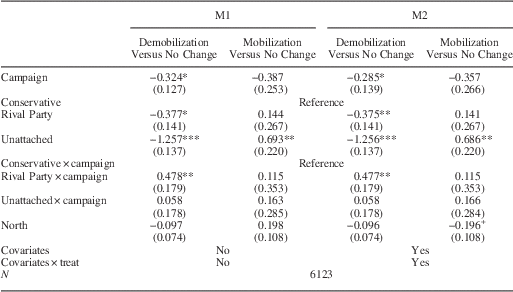
Table 1 and Tables A3 and A4 in the Supporting Information present the results from eight logistic regression models of the combined ground campaign, as well as the two campaign interventions separately, on turnout. In all models, standard error estimates are clustered by household to account for assignment to treatment and control groups at the household level. The coding of the party identification variable differs in Table 1 and Tables A3 and A4. While Table 1 shows treatment effects conditional on the three larger partisan sub-groups outlined in the research design section, Tables A3 and A4 include a detailed breakdown of support for rival parties and a more finely grained categorization of unattached voters, demonstrating that our results are not driven by our operationalization of pre-treatment partisan subgroups.
Logistic Regression of Turnout on Treatment Assignment, Conditional on Party ID

Note: Clustered SE in parentheses.
***p<0.001, **p<0.01, *p<0.05, +p<0.1.
Model 1 in Table 1 shows the overall results of the Conservative canvassing and leafletting campaign compared with the untreated control group. It is clear that, overall, the campaign interventions, if at all, had a negative effect on turnout, significant at the 0.10 level. Models 2, 3 and 4 include interactions with pre-treatment party support dummies testing our differential mobilization hypothesis that the campaign increased turnout among supporters of the Conservative Party more than turnout among supporters of rival parties such as Labour. Model 3 adds the pre-treatment covariates gender and validated turnout in the 2010 General Election, while Model 4 also adds interactions between treatment assignment and pre-treatment covariates, testing whether the conditional treatment effects by partisanship are driven by compositional differences within partisan groups. Models 5–8 replicate the aforementioned steps, breaking the ground campaign down into its constituent parts, namely whether a household was sent a leaflet only, or if the household was also assigned to personal contact with a Conservative Party canvasser. Table 1 Models 2 and 6 clearly demonstrate that campaign interventions had a different (more negative) effect on the turnout of rival party supporters and unattached voters than on the turnout of Conservative Party supporters. The differential effects are statistically significant with p<0.05.
Models 3 and 4 show that the differential effect for supporters of rival parties is robust to the inclusion of pre-treatment covariates as well as to the inclusion of interactions of pre-treatment covariates and the treatments, suggesting that the key result is not a function of observed compositional differences between partisan subgroups. Moreover, the interactions of the treatments with unattached subjects show that the differential effect uncovered in Models 2 and 6 is, in fact, a function of observable compositional differences with unattached voters, ex ante, less likely to vote than party identifiers and the treatment being more effective with higher propensity voters. If our theory that rival party supporters are put off voting by contact from a rival campaign because of their partisanship is correct, then that is exactly what we should observe: robust differential effects of the treatment between Conservative supporters and supporters of rival parties, and differential effects between Conservative supporters and unattached voters due to compositional differences related to pre-treatment turnout propensity.
Tables A3 and A4 display a further robustness check, dividing the three partisan subgroups using all available information on partisanship from the Conservative campaign office. The significant negative interaction effects displayed in Table A4 between both treatments and the Labour Party dummy show that the negative effect for rival party supporters is driven by supporters of the largest rival party, the Labour Party: treatments had a significantly more negative effect on Labour supporters than on Conservative supporters.
Moreover, Table A3 demonstrates that the negative effect for unattached voters is mainly driven by subjects with missing data on the party identification variable, and not by self-declared non-voters and non-identifiers, who turn out more when treated.
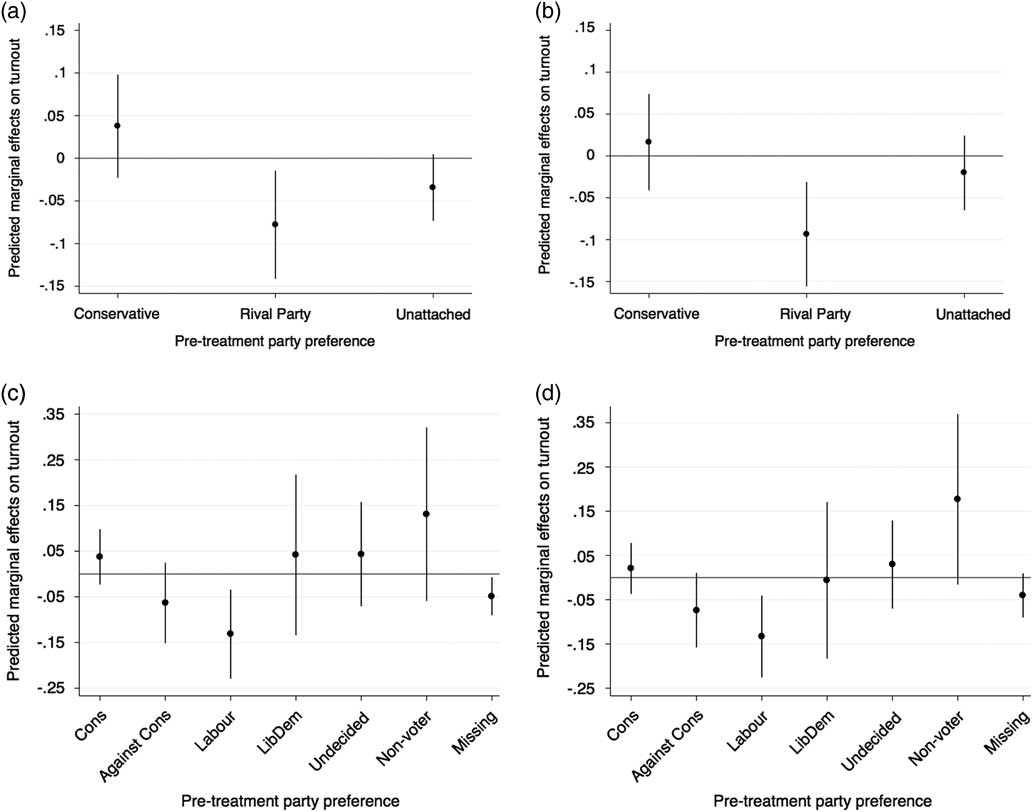
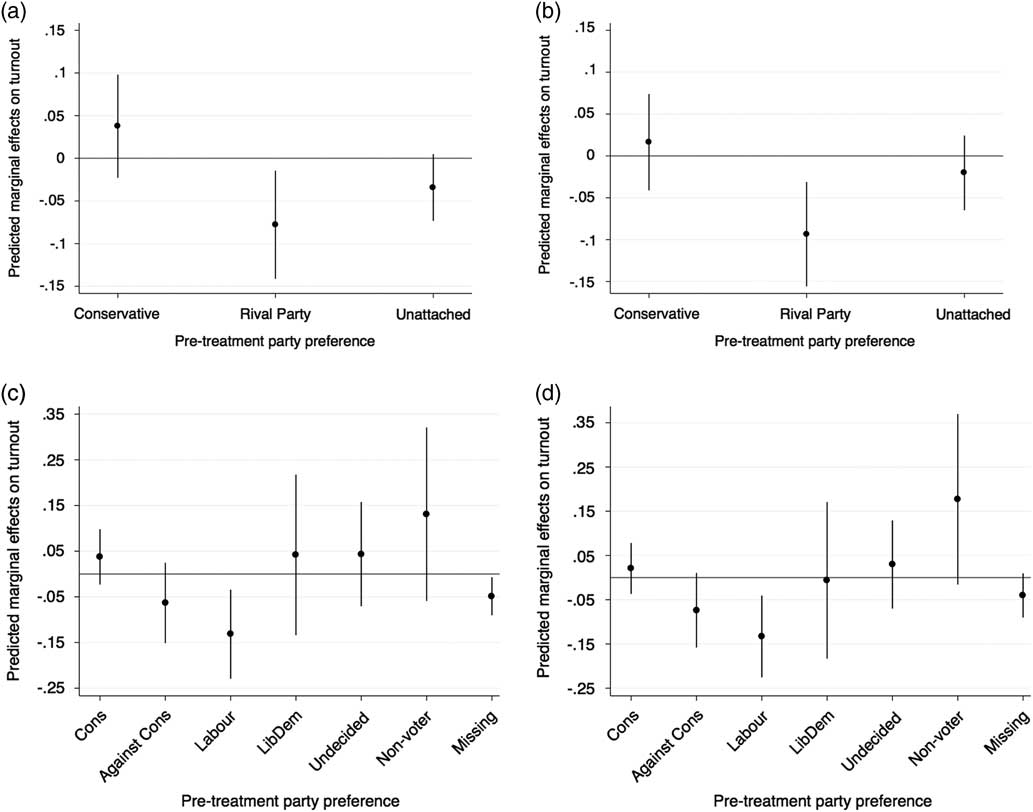
Figure 2 plots the marginal changes in predicted turnout probabilities derived from Table 1 and Table A4 Models 6 and 8 (adjusted for all available pre-treatment covariates and the interactions between pre-treatment covariates and assignment to campaign contact). The predicted Intention-to-Treat (ITT) effects are estimated while holding covariates at their mean. Figure 3 clearly shows that the differences in treatment effects between Conservative supporters and rival party supporters is statistically significant and amounts to 12 percentage points (unadjusted) or 11 percentage points (covariate-adjusted).
ITT Effects of Canvassing on Turnout, conditional on Party ID Note: Bars denote 95 percent confidence intervals. First row: three-group specification, second row: seven-group specification. First column: unadjusted, second column: covariate-adjusted.
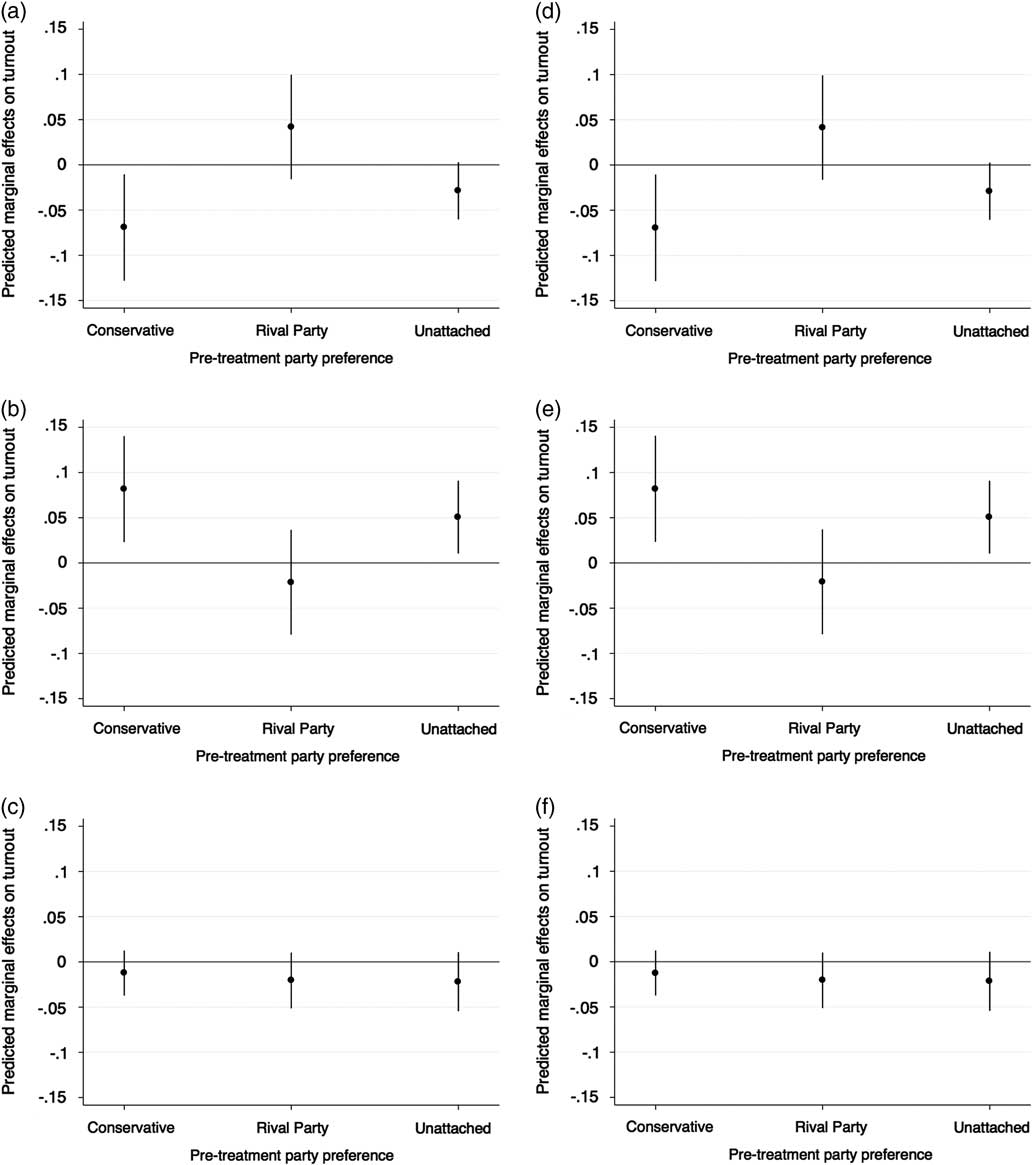
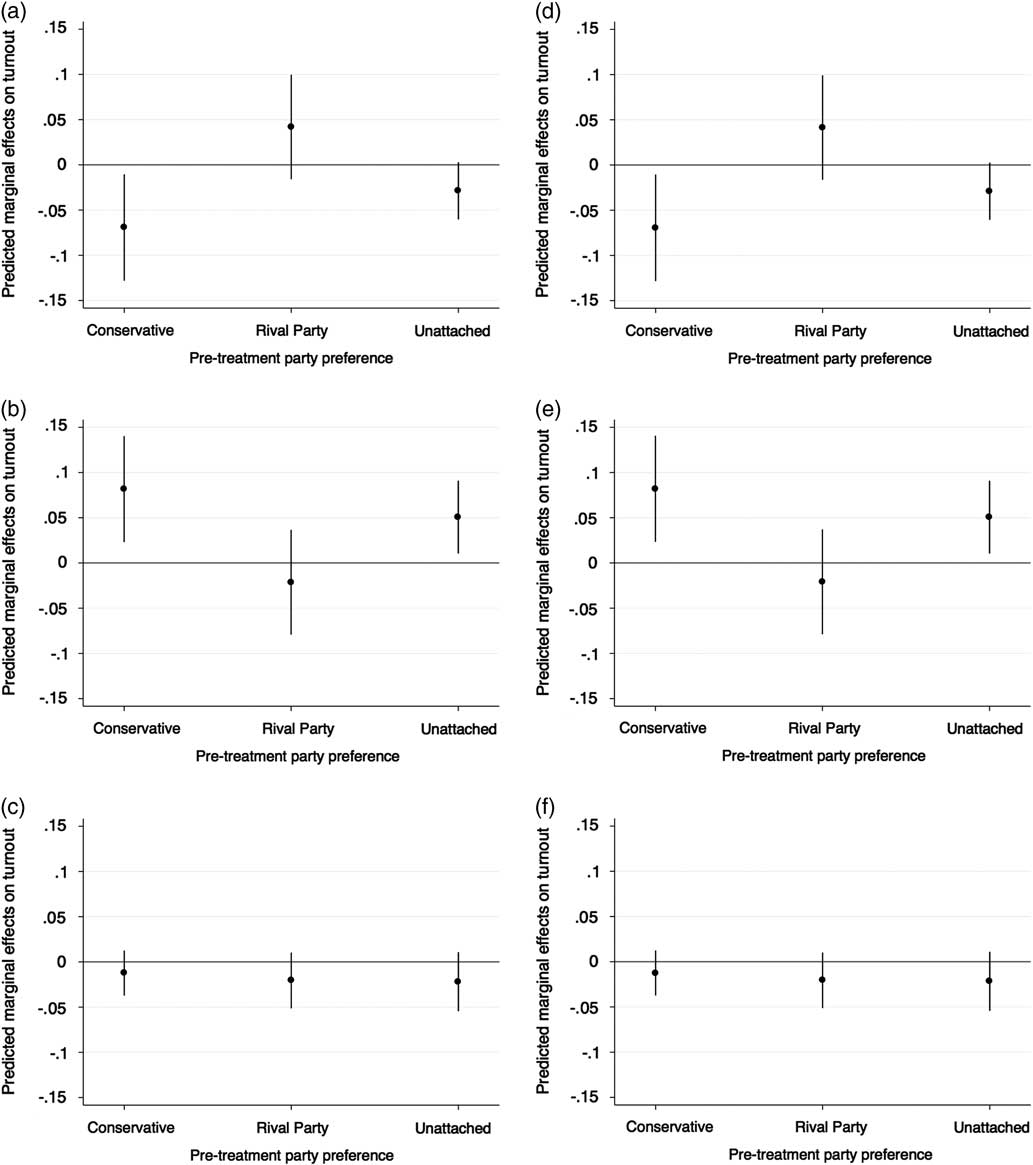
Change in Turnout from General Election 2010 to European Election 2014 as Function of Treatment Assignment, conditional on Party ID Note: Row 1: voter 2010→ non-voter 2014. Row 2: No change 2010–2014. Row 3: non-voter 2010→voter 2014. Column 1: unadjusted, Column2: covariate-adjusted. Bars denote 95 percent confidence intervals.
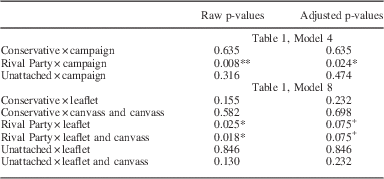
We also correct for multiple comparisons by applying the Benjamini and Hochberg correction, which controls the false discovery rate. We follow the method outlined by Coppock (Reference Coppock2015). Since analysis includes pre-treatment covariates displayed in Table 1 Model 4, we performed subgroup analysis for each of the three partisan subgroups, we begin by ordering the three p-values from the smallest to the largest. Then we look for the largest p-value that satisfies
 $$p_{k} \leq \left( {{k \mathord{\left/ {\vphantom {k m}} \right. \kern-\nulldelimiterspace} m}} \right){\times}\alpha $$
, where k is the p-values index, m the number of tests, and α is 0.10. According to Coppock (Reference Coppock2015), this p-value and all smaller p-values remain statistically significant at the 0.10 level. The corrected p-values in Table 2 show that the interaction between the campaign and the rival partisan group (the key finding of this paper) remains significant at the 0.05 level with p=0.024.
Benjamini–Hochberg Correction for false discovery rate

Note: Two-tailed tests.
***p<0.001, **p<0.01, *p<0.05, +p<0.1.
Since in Table 1 Model 8 we performed two hypothesis tests for each of the three partisan subgroups, we again order the six p-values from the smallest to the largest, and locate the largest p-value that satisfies:
 $$p_{k} \leq \left( {{k \mathord{\left/ {\vphantom {k m}} \right. \kern-\nulldelimiterspace} m}} \right){\times}\alpha $$
, where k is the p-values index, m the number of tests, and α is 0.10. The corrected p-values in Table 2 show that, if we decompose the campaign treatment, the interactions between the leaflet and the rival partisan group, and the canvassing and the rival partisan group, both remain significant, albeit only at the 0.10 level, with p=0.075.
Table 3 shows the results of a multinomial logistic regression of difference in turnout behavior between the 2010 General Election and 2014 European Elections as a function of treatment assignment, pre-treatment party support and the interaction between treatment assignment and pre-treatment party support.Footnote 6 Model 2 also includes the pre-treatment covariate, sex, and interactions between treatment assignment and gender. The dependent variable is coded −1 if the subject turned out in the 2010 General Election and abstained in the 2014 European election, 0 if the subject abstained in both elections or turned out in both elections, and 1 if the subject abstained in the 2010 General Election but turned out in the 2014 European election.
Multinomial Logistic Regression of Change in Turnout Between 2010 and 2014 on Treatment Assignment, Conditional on Party ID

Note: Two-tailed tests. Clustered SE in parentheses.
***p<0.001, **p<0.01, *p<0.05, +p<0.1.
From the low salience electoral context and light-touch nature of both campaign interventions, we expect that the campaign should change the electoral behavior of General Election voters either by activating the existing connection between party and voter, and thus preventing them from abstaining in the lower salience, European elections, or by pushing them across the abstention threshold (in the case of rival party supporters).
This change is exactly what we observe with Conservative supporters. The main treatment effects in Table 3 show that the campaign reduced second-order election abstention among Conservative voters who voted in the 2010 General Election. In contrast, the statistically significant interaction effect with supporters of rival parties shows that those subjects, if they voted in 2010, were significantly less likely to be prevented from abstaining than subjects who supported the Conservative Party. Figure 3 plots the marginal changes in predicted probabilities for each type of voter derived from Table 3, Models 1 (displayed in column 1) and 2 (displayed in column 2). The first row shows how the treatment affected low salience abstention compared with continuing with General Election turnout behavior. The second row plots how the treatment affected continuity between low and high salience turnout behavior, and the third row displays mobilization effects among General Election non-voters. The marginal effects plots show that Conservatives are around 8 percentage points more likely to stick with their General Election turnout behavior when assigned to contact either by leaflet or door-to-door, and those who stick are 7 percentage points more likely to keep on voting. On the other hand, supporters of rival parties who voted in the 2010 General Election are 3 percentage points more likely to abstain from voting in the European elections (n/s) when assigned to treatment as compared with control, but also 2 percentage points less likely to start voting in the Europeans (n/s), which means that the significant and negative main effect on turnout among rival party supporters observed in Figure 2 may be a composite of higher abstention among General Election voters and lower turnout among 2010 General Election non-voters (e.g., subjects that were too young to vote in 2010).
Discussion and Conclusion
Large-scale partisan campaign experiments that randomize contact at the aggregate level often report positive effects on parties’ vote shares while failing to detect effects on aggregate turnout (Ramiro, Morales and Jiménez-Buedo Reference Ramiro, Morales and Jimenez-Buedo2012; Pons and Liegey Reference Pons and Liegey2016; Kendall, Nannicini and Trebbi 2014; Pons Reference Pons2014). But are these effects entirely due to persuasion as the literature suggests? By developing a theory of differential mobilization and testing it on individual-level data collected from a randomized field experiment conducted in collaboration with the North East Somerset Conservative Party, we show that campaigns can affect the partisan composition of the electorate in favor of the party that initiates contact, while leaving aggregate turnout unchanged.
Null results, or even negative results, on turnout should not be surprising given that partisan campaigns have different strategic objectives than civic campaigns. As Gerber (Reference Gerber2004) points out, winning an election may sometimes involve reducing turnout among opponents. This outcome is particularly likely in multi-party systems where supporters of the party that initiates contact only make up a fraction of voters that are targeted by a campaign. The aim of this research was to test the differential impact of two common campaign methods on supporters of different parties. Differential partisan effects of door-to-door canvassing and leafleting on turnout have so far either been ignored because most partisan campaign experiments are based on samples that exclude rival party supporters (e.g., Nickerson, Friedrichs and King Reference Nickerson, Friedrichs and King2006) or because they lacked detailed information on pre-treatment party support (e.g., Pons Reference Pons2014). We show that parties might be skilled at mobilizing their core voters to turn out while deterring voters of rival parties by using the same campaign intervention. Taking the case of one major party’s campaign in the 2014 European and local elections in an English parliamentary constituency, the research examined the differential turnout hypothesis, confirming that both the campaign overall, but also each intervention, leafleting and canvassing, separately affected the composition of the electorate favorably from the standpoint of the Conservative Party. Our results suggest that differential mobilization may be an important feature of partisan campaigning and should be explored further. While the causal mechanism leading to demobilization effects among opponents could be cognitive dissonance or cross-pressure induced through contact with a rival campaign, it may also be the case that campaign contact from an opposing party causes frustration and discontent with politics in general.
It should also be borne in mind that in European and local elections turnout is relatively low by UK (but not by US) national election standards. In a General Election when turnout is higher and all parties are attempting to contact voters, and when voters consider the election to be more important, the incentive for party loyalists to turn out in favor of their preferred party may be stronger. It therefore remains to be tested whether differential mobilization is generalizable to high salience elections. Of course, in the comparative context, where electoral systems and party competition differ, differential mobilization may also vary in its importance.
For scholars of GOTV and partisan campaigns, it might not be surprising that the script routinely delivered to voters at the doorstep by Conservative Party volunteers in North East Somerset was no more effective at affecting turnout than a simple campaign leaflet. The standard canvassing script used by the Conservative Party contained no specific behavioral cues that have been shown to make personal appeals more effective at getting out the vote (Nickerson Reference Nickerson2007; Green and Gerber Reference Green and Gerber2008). This experiment is therefore a reminder that voter contact statistics, as published routinely by political parties in the United Kingdom and elsewhere in the run-up to an election, are not necessarily a good indication of the effectiveness of a party’s ground operation. In this way, the findings, if replicated, might qualify other studies of partisan mobilization that have stressed the general importance of face-to-face interaction. Used heavily by Conservative campaigns in marginal seats during the 2015 UK General Elections, the effectiveness of the campaign leaflet in North East Somerset, a Conservative–Labour marginal, might help to explain some of the party’s unexpected victories despite Labour’s advantage in making door-to-door contact.
Our results show that contacting registered voters via leaflet and door-to-door canvassing are both effective at changing the composition of the electorate in a low salience election. This paper provides a novel explanation for the surprising empirical regularity that partisan campaigns often fail to increase turnout both at the individual and the aggregate level.