I. INTRODUCTION
The elastic stiffness, fracture strength, and fracture toughness of a perfect macroscopic crystal are intrinsic material properties characterizing the atomic bonding and crystal symmetry. In general, bulk materials are not perfect crystals, and their characteristic strength and fracture toughness can be much lower than the theoretical value. It could be expected that by decreasing dimensions, the probability of defects is reduced and we approach closer to the theoretical strength of a perfect crystal. However, by scaling the material volume in at least one spatial dimension, the number of atoms involved in the surface region becomes significant compared with the total number of atoms. A surface is essentially an abrupt termination of the translational symmetry of the crystal. The surface atoms are less coordinated than atoms in the bulk, leading to a “two-dimensional (2D) surface lattice.” In this surface localized 2D lattice, the bonding configuration is characterized by surface reconstruction and could be significantly different to the bulk. The increasing dominance in the influence of atoms at the surface and near surface region is the rationale behind the significant variation of the elastic stiffness of low-dimensional materials from their bulk counterparts. Considering that silicon is a key enabling material for nanotechnology, there is an obvious motivation to characterize the mechanical properties of silicon at the nanoscale. Among other properties of silicon, the fracture strength, fracture toughness, elastic stiffness, and even the brittle-ductile transition have been found to differ from the bulk as dimensions approach the nanoscale.Reference Kang and Cai1–Reference Han, Zheng, Zhang, Zhang, Zhang and Wang4
Similar to the mechanical properties, the electromechanical properties of silicon are predictedReference Nakamura, Toriyama and Sugiyama5 to change at the nanoscale. There have been interesting claims on mechanical strain influencing the “carrier density” and spawning an enhanced piezoresistive coefficient in surface depleted nanoscale silicon structures.Reference He and Yang6 These investigations have enormous technological pertinence not only for piezoresistive sensorsReference Barlian, Park, Mallon, Rastegar and Pruitt7 but also in strain engineering, i.e., enhancing the mobility (and hence the current density) in metal oxide semiconductor field effect transistors.Reference Singh, Jenkins, Sleight, Ren, Ieong and Haensch8, Reference Tan, Liow, Lee, Hoe, Tung, Balasubramanian, Samudra and Yeo9 The “defect-free” nanoscale silicon additionally offers a road to large deformation, allowing the investigation of electromechanical coupling at significantly higher strains. A large perturbation of the atomic arrangement could additionally reveal unique physicochemical couplings related to surface instabilities.Reference Freund and Suresh10 Recently, the transport properties of silicon in the ultrastrain regime have been explored and an “anomalous” piezoresistance: an increase in resistivity under low strain (∼0.5%), and an unexpected decrease in the resistivity at high applied tensile strain (∼<2%) have been experimentallyReference Lugstein, Steinmair, Steiger, Kosina and Bertagnolli11 demonstrated in (111) oriented p-type silicon nanowires.
The mechanical characterization of silicon thin films or nanowires is demanding due to the inherent defect sensitivity leading to a statistical brittle failure behavior. The most popular method to mechanically deform silicon nanobeams/wires is by nanoscale bending tests, where an atomic force microscope (AFM) tip or a sample manipulator is used to laterally bend released cantilevers or nanowires suspended over a trench.Reference Hoffmann, Utke, Moser, Michler, Christiansen, Schmidt, Senz, Werner, Gosele and Ballif12–Reference Wu, Heidelberg and Boland14 The ease associated with performing nanoscale bending tests is mitigated both by the complexity associated with interpreting the force–displacement curves for a nonuniform stress state and the ambiguity in modeling the contact mechanics between the AFM tip and the sample. Tensile testing is widely considered to be a superior alternative since it provides uncomplicated analysis and interpretation by ensuring the application of uniaxial tensile stress throughout the length of the sample. Various micro/nanoscale tensile testing stages concepts have been proposed utilizing electrostatic, piezoelectric, or thermal actuators to pull on thin-film specimens.Reference Haque and Saif15–Reference Tsuchiya, Hirata, Chiba, Udo, Yoshitomi, Ando, Sato, Takashima, Higo, Saotome, Ogawa and Ozaki17 While all these techniques have their relative merits, the general difficulty in sample manipulation for nanoscale tensile testing creates tremendous requirements for designing and conducting such experiments. Furthermore, there is an obvious need for developing simple and generic techniques to deform nanoscale silicon, sufficiently equipped to investigate simultaneously the mechanical properties and the carrier transport under large strains.
In this article, we present new extensions of an on-chip technique,Reference Gravier, Coulombier, Safi, André, Boé, Raskin and Pardoen18–Reference Fabregue, André, Coulombier, Raskin and Pardoen22 which relies on the extraction of statistical data in micro-nanoscale silicon for the investigation of quasi-one-dimensional, quasi-2D, and quasi-three-dimensional scaling effects. The technique permits measurement of the mechanical properties of silicon beams down to the nanometer scale while allowing a reproducible application of large deformations required for generating significant stress-induced modification on the transport phenomena. The technique is applied to the study of monocrystalline silicon thin films lying on an insulating silicon dioxide layer [Silicon-on-Insulator (SOI)] and hence also offers more readily accessible information for SOI-based Micro-Electro Mechanical Systems/Nano-Electro Mechanical Systems (MEMS/NEMS) applications. In addition to the inherent versatility, simplicity, and ease of multiplicity, it ensures the application of perfect uniaxial tensile stress along the length of the nano-microscale beams. Strains up to 5% can be attained and most specimens reproducibly survive large deformation demonstrating the quality of the fabrication and the expected decrease of defect probability. Finally, the intrinsically static nature of the technique coupled to the absence of any external loading mechanisms delivers a unique opportunity for AFM-based surface characterization.
This article starts with an introduction to the experimental techniques involved, followed by preliminary results on observed scale effects on the elastic response, mechanical strength, evolution of the surface morphology under tension, and concludes with prospects for electromechanical investigations.
II. EXPERIMENTAL PROCEDURES
A. Internal stress-based measurement technique
Internal stresses that originate from lattice or thermal expansion mismatch as well as from growth processes are widely considered as detrimental in thin-film deposition since they cause microscopic defects and dimensional changes. Low-pressure chemical-vapor-deposited (LPCVD) silicon nitride (SiN) notoriously possesses a high value of internal tensile stress (∼1 GPa), originating from the mismatch in thermal expansion coefficients between silicon and SiN.Reference Irene23 The aforementioned technique is designed to make favorable use of the internal stresses present in SiN, referred to hereon as “actuator” material, to mechanically load/deform thin films of interest, here single-crystal silicon.
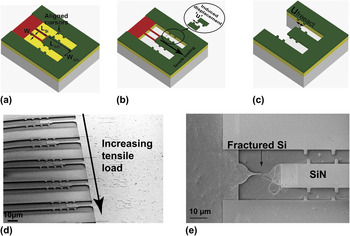
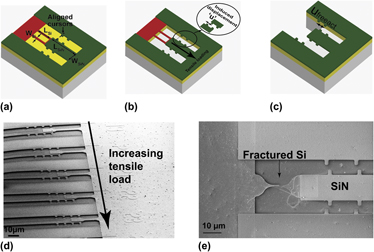
The first step toward designing an elementary tensile stage, as schematically visualized in Fig. 1(a) is to fabricate a cantilever beam made of single-crystal silicon, followed by fabrication of a stiffer cantilever beam of SiN to partially overlap the silicon beam at the area of interest. The essential idea here, as illustrated in Fig. 1(b), is to use the displacement induced upon release of the SiN beam, owing to its internal stress relaxation, to mechanically load/deform the attached silicon sample. The magnitude of the strain (ξ = u/L) imposed on each silicon beam is directly inferred from measuring the displacement u of the released beams using a scanning electron microscope (SEM) and by prior knowledge (by design) of the length L of the silicon beam. Figure 1(c) embodies the structures designed to facilitate displacement measurement of a free SiN beam. The relative difference in displacement between a free SiN cantilever beam and a SiN–Si clamped-clamped beam yields an estimate of the mechanical constraint imposed by the presence of the silicon beam. Force equilibrium between the two beams gives the stress in the Si beam as

Schematic depiction of silicon nano/micro loop-based tensile testing stage structures fabricated using top-down approach from a Silicon-on-Insulator wafer covered with silicon nitride (SiN). (a) before and (b) after release. Where LSi, WSi, LSiN, WSiN correspond to the length and width of the silicon and SiN, respectively. (c) Schematic depiction of the cantilever beam structures designed to facilitate the free actuator displacement Ufree. (d) Scanning electron microscopic (SEM) images showing an array of tensile stages at increasing actuator lengths and hence increasing levels of applied deformation and (e) SEM images showing fracture in silicon beam.

where E act is the Young’s modulus of SiN, S is the cross section area ratio of the SiN and Si beam geometries, and ξ mis is the elastic (or mismatch) strain present in the SiN before release. This mismatch strain is calculated as ξ mis= u freeact/L freeact, from SEM measurement of u freeact [Fig. 1(c)] and length L freeact of a free actuator beam. Hence, for a fixed geometry, every tensile stage leads to a given value of strain, and as seen in Fig. 1(d), by varying the length of the actuator it is possible to determine the maximum load that can be sustained by the silicon beam. Figure 1(e) shows a magnified image of loading beyond the tensile strength, hence corresponding to fracture of the Si beam. The maximum measured strain prior to the onset of fracture is noted as the fracture strain characteristic of the silicon beam geometry. A more detailed discussion of the technique can be found in Ref. Reference Gravier, Coulombier, Safi, André, Boé, Raskin and Pardoen18.
The parallel processing of optical lithography allows the fabrication of simple beam [Figs. 1(d) and 1(e)] and loop-based [Fig. 1(a)] microscale test structures with different geometries. The proposed methodology has recently proven its credentials as a simple, straightforward and versatile on-chip nanomechanical testing technique with successful applications to both ductile (palladiumReference Idrissi, Wang, Colla, Raskin, Schryvers and Pardoen21 and aluminumReference Fabregue, André, Coulombier, Raskin and Pardoen22) and brittle (silicon and polysiliconReference Gravier, Coulombier, Safi, André, Boé, Raskin and Pardoen18) thin films. This work relies on this technique to pioneer its application on the mechanical and electromechanical study of silicon in micro-nanoscale geometries.
B. Fabrication details
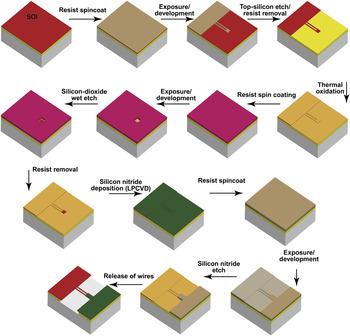
Only the fabrication of micron scale test structures are presented in this article. The steps involved in nanowire-based test structure fabrication have been described in detail elsewhereReference Passi, Bhaskar, Pardoen, Södervall, Nilsson, Petersson, Hagberg and Raskin19; the general procedure remains the same except for the use of electron beam lithography. The complete multistep process flow is sketched in Fig. 2. The starting material is a p-type (20 Ω-cm) SOI substrate with different top silicon thicknesses and a 1-μm-thick buried oxide. After cleaning in a piranha mixture, a 20-nm-thick thermal oxide layer is grown on the top silicon. This thermal oxide is patterned using photolithography and hydrofluoric acid (HF) etching. An over etch time is performed to ensure the complete removal of the thermal oxide in the area uncovered by the developed resist. After removing the photoresist with acetone and isopropanol, chlorine etching is used to etch top silicon, with the silicon oxide playing the role of an etching mask. This process of etching silicon is extremely selective to oxide. After removing the thermal oxide in HF and cleaning the wafer with standard procedures, a 20-nm-thick thermal oxide is grown. Windows are opened in this oxide layer thereby giving access to certain parts of the silicon where the SiN will be in direct contact. Then, LPCVD SiN is deposited at 800 °C. Photolithography on SiN is done followed by etching using SF6 chemistry. Since SF6 etches quicker silicon than silicon oxide, the thermal oxide (between the top silicon and SiN) acts as an etch stop layer. The photoresist is removed using acetone followed by isopropanol rinse. The sample is subjected to HF-73% to etch away the buried oxide and thus release the beams, leading to the stress relaxation in the actuator and the deformation of the specimen. After releasing the wires, the sample is kept under isopropanol and transferred to a critical point dryer. Concerning the microstructures designed for electromechanical measurements, the additional steps consist of the opening of windows at the anchors/contact pads for degenerate boron doping (necessary for tunnel contacts) and the deposition and annealing of Al–Si for the contact pads.
Complete process flow for the fabrication of silicon micron scale test structures with on-chip application of the loading through the release of the internal stress present in a SiN “actuator” beam.

C. AFM setup and calibration for roughness measurements
AFM characterization of surface roughness is carried out using a XE-150 tool from Park Systems (Suwon, Korea). Areas of 750 × 750 nm2 are scanned with a resolution of 2048 pixels per line, which results in a step of 3.7 Å between consecutive data points. All measurements are performed in noncontact mode using a piezoresistive Si tip. Noise conditions are minimized in an acoustic isolation chamber, and a simple median filter is also applied to the image to suppress any noise contributions. The noise floor of these measurements is ∼0.2 Å. A detailed description of the experiment can be found in Ref. Reference Escobedo-Cousin, Raskin, Bhaskar, Pardoen and Olsen20.
D. Surface states and electrical measurements
Interface/surface states are principally localized states associated with discontinuity of the lattice potential at the semiconductor–vacuum interface. In silicon, the energy levels introduced by defects, or by the presence of a surface, occupy states within the forbidden energy levels, i.e., the band gap of the periodic bulk.Reference Brillson24 These states can dynamically influence carrier transport by acting as charge traps, i.e., by capturing and subsequently emitting back electrons. The inherent sensitivity of interfacial states to extrinsic molecules introduces dynamic variations in carrier conduction. This effect has previously instigated erroneous conclusions on the influence of strain on the transport properties of nanoscale silicon measured in ambient conditions.Reference Milne, Rowe, Arscott and Renner25 To negate these influences, all transport measurements reported in this work were conducted in vacuum.
The removal of native oxide and hydrogen termination of the surface brought by an HF treatment, performed here during release of the beams, stabilizes the surface against reoxidation for several hours. Hence, the released samples are quickly transferred to a vacuum chamber and all electrical characterizations are carried out under vacuum condition. The high vacuum (∼5x10⁻⁵ mbar) ensures against any surface contamination for the duration of the measurements. The measurements are performed using an Agilent 4156C precision semiconductor parameter analyzer (Santa Clara, CA) capable of detecting accurately femtoampere current. This high resolution is required for studying the high-resistance transport characteristics displayed by surface depleted silicon nanowires. For analysis, the resistances of free cantilevers and supported cantilever beams fabricated with the same geometry constitute the “zero-stress” resistance measurements. This measured resistance is compared to the resistance of cantilever beams at predefined values of mechanical loading. The validity of this assumption relies on the uniformity of geometry and morphology (due to similarity in fabrication) and owes to conformity in the surface potential of the beams after HF treatment.Reference Euaruksakul, Chen, Tanto, Ritz, Paskiewicz, Himpsel, Savage, Liu, Uao, Liu and Lagally26 Indeed, any effects of local surface dipoles from impurities on the surface potential cannot be taken into account, but this and other in-correlations can be compensated from statistical analysis of the large throughput data extracted. The fact that our silicon beams are patterned from the top surface of standard SOI wafers also provides direct access to field effect measurements and other standard MOSFET transport characterization techniques.
E. Independent dynamic resonance-based evaluation of the stress
Resonance measurements are additionally performed to provide an independent estimate of the stress developed in the released silicon beams. The vibration excitation is enabled via a piezoelectric disk on top of which the sample die is glued, and these vibrations are optically detected using a laser doppler vibrometer. Measurements are carried out in a customized vacuum chamber (∼1x10⁻⁶ mbar) with an optical window. The vacuum chamber prevents any damping/perturbation introduced into the resonance frequency from the absorption and desorption of stray molecules.Reference Yang, Xia, Gan, Xu, Yu and Li27 The choice of aluminum as a reflective layer stems from the facts that it has a low density, relatively low Young’s modulus, a low deposition temperature, and zero internal stress upon deposition, which together render ease the modeling of the reflective layer. Since the microstructures presented here are composite dual beam structures for which it is not possible to find a simple analytical formula relating the stress to the resonance frequencies as is the case with clamped-clamped beams, modal analysis based on the Rayleigh–Ritz technique is performed to find the axial stress in the structures, as explained elsewhere.Reference Bhaskar, Houri, Passi, Pardoen and Raskin28, Reference Kynch29
III. RESULTS AND DISCUSSION
A. Size effects on the Young’s modulus of Si
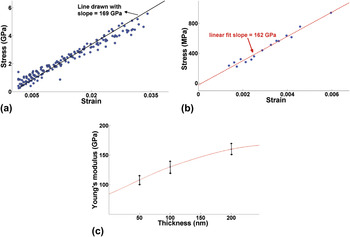
The Young’s modulus of (110) silicon is extracted independently from static measurements [Fig. 3(a)] with Eq. (1) and dynamic (see Section II E) characterizations [Fig. 3(b)]. The Young’s modulus of 200-nm-thick silicon is equal to ∼160 GPa, corresponding well within 5% to the bulk value, i.e., 169 GPa. Additionally, a very good correspondence is noted when comparing both techniques [Figs. 3(a) and 3(b)], which are based on very different principles. The experimental spread in the extracted values from die to die variation and experimental correlation between static and dynamic measurements is estimated to be around ±10% of range. For thickness below 200 nm, there is a marked decrease of the Young’s modulus. The measurements on 50-nm-thick silicon revealed a ∼40% decrease in the observed Young’s modulus equal to ∼108 GPa, as shown in Fig. 3(c). The magnitude of the observed decrease is too large to be explained only as the softening of the silicon surface layer brought about by the dominant influence of lower atomic coordination over any stiffening contributions introduced by electron redistribution and surface reconstruction.Reference Zhou and Huang30 The increased significance of the native oxide, volumetric defects, along with the resulting lower atomic coordination and electron redistribution in the neighborhood of these defects are suspected to be important factors for the observed scaling in the elastic modulus of silicon.Reference Sadeghian, Goosen, Bossche, Thijsse and van Keulen31 These measurements summarized in Fig. 3(c) show good correspondence with literature values obtained from bending.Reference Sadeghian, Goosen, Bossche, Thijsse and van Keulen31–Reference Sadeghian, Yang, Goosen, van der Drift, Bossche, French and Van Keulen33
(a) Stress–strain curve extracted from static measurements on 200-nm-thick silicon beams; (b) Stress–strain curve extracted from dynamic measurements for 200-nm-thick silicon beams; (c) Silicon Young’s modulus as a function of the Si beam thickness with the error bar serving as an estimate of spread in extracted value define to be <±10% of range.

B. Fracture strength
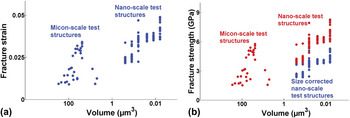
Fracture strength is essentially governed by defect population and loading conditions; this is primarily the reason of wide scatter in experimental values from 300 MPa to 17 GPa.Reference Zhu, Moldovan and Espinosa3, Reference Tsuchiya, Hirata, Chiba, Udo, Yoshitomi, Ando, Sato, Takashima, Higo, Saotome, Ogawa and Ozaki17, Reference Johansson, Schweitz, Tenerz and Tirén34–Reference Boyce, Grazier, Buchheit and Shaw38Figure 4(a) depicts the evolution of the fracture strain with respect to the volume of the stressed material. The maximum value of fracture strain measured in our study has been observed in the tensile testing of nanobeams fabricated from 50-nm-thick top silicon of 2.5-μm-long for widths of 50 nm (4.9%) and 500 nm (4.7%), respectively. These results are consistent with pre-existing defect and standard Weibull type brittle failure.Reference Boyce, Grazier, Buchheit and Shaw38
(a) Fracture strain data collected from silicon of different geometries and thicknesses plotted as a function of volume of stressed material. (b) Corresponding fracture strength evolution with respect to volume of material, and comparison of the difference in trends observed when imposing the size-corrected Young’s modulus with the fracture strength obtained by imposing the bulk value of Si, i.e., 169 GPa. For the nanoscale structures, the uncorrected fracture strength physically translates to the value at the core of the wire, while the size-corrected fracture strength corresponds to the effective strength of the specimen.

From the calculated fracture strain, we estimate the fracture strength by imposing the “size-corrected” Young’s modulus, i.e., the value corresponding to the thickness of the film as calculated in Section III B. Figure 4(b) compares the trends observed in the fracture strength obtained by imposing this size-corrected Young’s modulus and the fracture strength obtained by imposing the bulk value of Si, i.e., 169 GPa. For the 50-nm-thick nanoscale structures, the uncorrected fracture strength physically translates to the value at the core of the wire while the size-effects corrected fracture strength corresponds to the average strength of the specimen. There is no obvious trend in the scaling of strength with respect to the size-corrected fracture strength. However, the fracture-determining defect population in silicon is surface based, and seemingly “arbitrary” topological differences like surface roughness, sidewall in-homogeneity, and contact impurities could all result in local stress concentrations and play a dominant role in fracture.Reference Cook37 This extreme sensitivity to extrinsic features could mask the effects of strength scaling with the size of defect population since fabrication processes introduce flaws and tolerances (like roughness) relative to the scale involved. The possible role of surface roughness is discussed in the following section.
C. Evolution of surface roughness under uniaxial tension
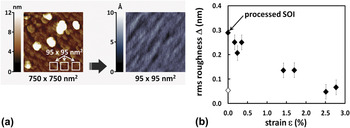
The surface morphology has a determining role in the mechanical fracture strength of silicon. For instance, a simple surface treatment (KOH etch followed by TMAH) has been shownReference Alan, Hines and Zehnder39, Reference Yi, Li and Kim40 to significantly enhance the fracture strength. However, there is not sufficient experimental investigation on the evolution of the surface morphology of silicon under the influence of a mechanical load. Figure 5(b) plots the variation of surface roughness as a function of strain. The surface roughness decreases ∼5-fold from 0.34 to 0.07 nm as the applied strain varied from 0.2 to 2.8%. This significant evolution of the roughness certainly plays a role in the observed strength of the material. With increasing deformations, one important source of stress concentration, i.e., the roughness diminishes continuously. There is thus an interesting cumulative effect; specimens with fewer defects will deform more without fracturing, while with increasing loading, there is a concurrent reduction in the roughness of these specimens, hence increasing even more the fracture strength. A quantitative analysis of this interesting coupled effect is left for future work.
(a) Selection of 95 × 95 nm2 regions from the 750 × 750 nm2 scans; (b) Root Mean Square (RMS) surface roughness as a function of strain in the Si beam measured on 95 × 95 nm2 images.

This observed roughness reduction has an additional implication in the transport characteristics of nanoscale devices, where the waviness introduced by surface roughness directly translates into potential fluctuations and influences carrier transport. Surface roughness promoted phonon scattering is a unique scattering mechanism that affects carrier transport in MOSFETs, semiconductor heterojunction and nanowire-based devices. Strain-induced reduction of the surface roughness is widely considered to be responsible for the in-correlation between the experimentally observed strain-enhanced mobility in MOSFET devices and theoretical predictions.Reference Fischetti, Gámiz and Hansch41–Reference Evans, Zhang, Joannoôulos and Pantelides43 Additionally, it has been observed through x-ray absorption spectroscopy that even moderate surface roughness could dramatically influence the transport properties of low-dimensional semiconductors by introducing significant perturbations in the local density of states.Reference Chen, Ramayya, Euaruksakul, Himpsel, Celler, Ding, Knezevic and Lagally44
D. Prospects for electromechanical investigations
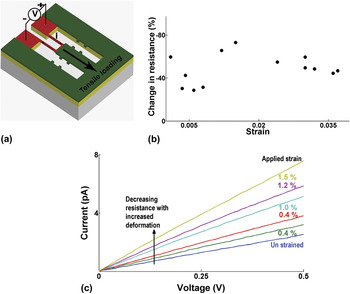
The schematic of the loop-based dual beam test structure for transport measurement is illustrated in Fig. 6(a). The essential idea as demonstrated in Fig. 1(d) is to multiply these elementary tensile stages and achieve increasing deformations by varying the length of the actuating beam. Figure 6(b) summarizes the results of our preliminary investigations on the influence of increased mechanical loading on the transport properties of (110) oriented, lightly p-doped (1015 cm−3), 40-nm-thick beams of various geometries. The decrease in the resistance with increasing deformation is visually better illustrated in Fig. 6(c), by plotting the variation in the current–voltage (I–V) characteristics for specific beam geometry. In this case, all the beam structures are 1-μm-wide, 80-μm-long, and 40-nm-thick. The decrease in the resistance of p-doped silicon with increasing tensile deformation is unexpected. It has been previously suggestedReference Scott, Peng, Kiefer, Jiang, Knezevic, Savage, Eriksson and Lagally45 that HF treatment causes inversion and minority carrier conduction in thin silicon films. However, the charge carrier polarity could not be confirmed through field effect measurements, owing to the fragility of our thin released beams. These results are only intended as “preliminary proof of concept observations,” demonstrating the possibility for investigating the transport properties irrespective of doping or orientation of ultra thin, micro-nanoscale silicon beams at very high intensities of mechanical loading.
(a) Schematic of the elementary loop-based test structures for transport measurements; (b) Plot depicting the percentage change in resistance as a function of the applied strain extracted from the current–voltage (I–V) characteristics corresponding to different channel geometries and 40-nm-thick p-type (110) orientation; (c) I–V characteristics for a 1-μm-wide, 80-μm-long, and 40-nm-thick dual beam silicon at increasing tensile deformation.

To proceed with extraction of the piezoresistive coefficients, it is necessary to elucidate the influence of the HF treatment on the charge carrier density. It is additionally necessary to adopt appropriate data reduction schemes with consideration of geometry, for instance, effects related to significant evolution of surface roughness would be more pronounced at increasing channel lengths.
IV. CONCLUSION
A new generic and versatile technique to deform micro and nano specimens of ultra thin silicon in tension up to large strains is proposed, involving different complimentary measurement tools and data reduction schemes. This method offers a platform to investigate the mechanical and electromechanical response, as well as couplings with other physical phenomena such as the evolution of surface morphology, surface potential, and band structure with mechanical loading. Important conclusions that can be drawn from this work include:
(i) The Young’s modulus under a tensile load decreases with thickness, significantly more than expected from only surface reconstruction effects in good correspondence with recent literature experimental results.Reference Zhou and Huang30
(ii) Fracture strain values up to 5% and in general greater than 1.5 and 2.5%, respectively, for micro and nanoscale specimens, demonstrate high quality of the fabrication. The corresponding maximum fracture stress is ∼8.3 GPa, taking the bulk value of Young’s modulus but decreases to ∼6 GPa, when evaluated with the corrected Young’s modulus.
(iii) The surface roughness decreases by a factor of 5 when deforming by 2% the Si specimen, with an expected influence on the fracture strength.
(iv) Transport measurements under deformation up till 3.5% performed on 40 nm-thick silicon beams.
ACKNOWLEDGMENTS
The authors express gratitude for access to MC2, Nanofabrication Laboratory, Chalmers University of Technology, Department of Microtechnology and Nanoscience, Sweden, and Prof. Ulf Södervall for the fruitful discussions. The authors would especially like to thank the European Network of Excellence (FP7) NANOSIL and MINATIS consortia for funding this research.