Implications
A mathematical model to estimate protein and amino acid requirements for a population of sows differing in size or milk production throughout lactation was developed. The between-sow variability predicted in the model can be used to guide the application of safety margins when formulating diets for a group of sows. Knowledge about how requirements vary between animals within a population and changes during lactation is a valuable tool for developing feeding strategies contributing to higher production and better health of sows. The results indicate that phase-feeding strategies for lactating sows may improve environmental and economic sustainability of sow operations.
Introduction
Determination of protein and amino acid (AA) requirements of lactating sows is essential to optimize sow productivity and longevity. It is essential to distinguish between requirements and recommendations. Requirements are determined for individual animals, whereas recommendations are given for a population of animals. Recommendations for populations are often determined as a requirement of an average sow without considering the between-animal variation. When these recommendations are applied to populations exhibiting large between-animal variation, the requirement of a certain percentage of the population is not met (Brossard et al., Reference Brossard, Dourmad, Rivest and van Milgen2009; Hauschild et al., Reference Hauschild, Pomar and Lovatto2010; Pomar et al., Reference Pomar, Hauschild, Zhang, Pomar and Lovatto2011), and the mean performance of the group will be lower than expected. Nutrient requirements vary greatly between animals of a given population and each animal follows individual patterns over time (Pomar et al., Reference Pomar, Hauschild, Zhang, Pomar and Lovatto2011). For example, the lysine requirement of a lactating sow depends on the animal (e.g. genetics, age, BW, body composition and milk production), environment (e.g. temperature and housing) and feeding factors (e.g. feed allowance and quality). Some of these factors may be controlled, and therefore be similar for all animals within a group, but many of them will result in variation between the animals.
Monte Carlo simulation models are becoming increasingly popular in nutritional science for representing between-animal variability in requirements (Kristensen and Pedersen, Reference Kristensen and Pedersen2003; Brossard et al., Reference Brossard, Dourmad, Rivest and van Milgen2009; Puillet et al., Reference Puillet, Martin, Sauvant and Tichit2011). However, such stochastic models that estimate nutritional requirements for sows are lacking. Thus far, stochastic models have only been developed for growing pigs (e.g. Pomar et al., Reference Pomar, Kyriazakis, Emmans and Knap2003; Schinckel et el., Reference Schinckel, Li, Preckel, Einstein and Miller2003). In traditional models, the sow is described by a number of parameters determined for the individual animal. The basic assumption in this approach is that the true parameter values of the population being simulated are known with complete certainty and they are assumed not to vary between animals. Similarly, milk production of the sow could be specified by a mean and s.d., so that the actual milk production of a particular sow is drawn from a normal distribution having specific parameters. The assumption is that the specified mean and s.d. are the true values. In reality, parameters can only be estimated with a certain precision and at worst they are based on expert estimates. In contrast to other nutritional herd simulation models such as the InraPorc sow model (Dourmad et al., Reference Dourmad, Etienne, Valancogne, Dubois, Van Milgen and Noblet2008), stochastic models take into consideration the uncertainty of biological variability of parameters and uncertainty of the estimation of true parameter values. For a given set of population parameters, a set of sow-specific parameters are generated, which reveal the range of nutrient requirements under these specific conditions. The variation in the median (or in any given percentile) nutrient requirement between the simulation runs of different population parameter expresses the uncertainty concerning the true population parameter values. In essence, the between-sow variation can be considerable, and the uncertainty concerning the different population parameter values in the model need to be taken into account when applying nutritional management to a sow population or herd. The aim of the present study was to develop a nutrient requirement model that integrates biological population variation and uncertainty of key parameters into establishing nutritional recommendations for lactating sows.
Material and methods
Calculation of protein and AA requirements
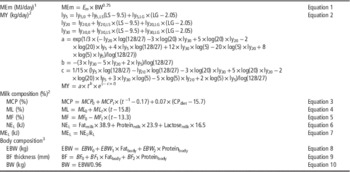
A factorial approach was taken to calculate energy, protein and AA requirements for lactating sows. Litter size (LS, number of nursed piglets), litter weight gain (LG, kg/day), BW of the sow postpartum (kg), back fat thickness (BF) postpartum (mm), feed intake (kg) and metabolizable energy (ME) concentration of the feed (MJ ME/kg) were given as inputs to the model. The model inputs should be seen as production expectations and for each input an expected s.d. was also given, and the s.d. results from both uncertainty and between-animal variation. LS and LG are most likely correlated; thus, a correlation coefficient was given as input. The feed intake curve of the sows was treated as an input to the model, and its parameters can be estimated from longitudinal data on sows, using a nonlinear mixed model routine such as OpenBUGS. Bayesian analysis of the longitudinal data was used, because it treats the parameter estimation in terms of a three-stage hierarchical model. Stages one (within-animal variability) and two (between-animal variation) are similar to those characterized by random effects modeling with restricted maximum likelihood, and the third stage refers to the previous distribution. In the simulations, a feed intake curve was developed from data on high-producing sows (Hansen et al., Reference Hansen, Lauridsen, Sørensen, Bach Knudsen and Theil2012a) using a Mitscherlich function, which was used as an example of feed intake at time t (FI(t)) in lactation:
 $$\displaylines{ {\rm FI}(t)=\phi _{1} {\plus}(\phi _{2} {\minus}\phi _{1} ){\times}{\rm exp}({\minus}{\rm exp}(\phi _{3} ){\times}t) \cr \phi _{1} =9.14{\plus}0.7{\times}({\rm LS}{\minus}11.3){\plus}c_{1} \cr \phi _{2} =2.14{\plus}0.59{\times}({\rm LS}{\minus}11.3){\plus}c_{2} \cr \phi _{3} ={\minus}2.45{\minus}0.31{\times}({\rm LS}{\minus}11.3){\plus}c_{3} \cr \cr \left[ {\matrix{ {c_{1} } \cr {c_{2} } \cr {c_{3} } \cr } } \right]\,\sim\,N\Big(0,\sum\Big) \cr \sum=\left[ {\matrix{ {0.528} & {{\minus}0.156} & {{\minus}0.080} \cr {{\minus}0.156} & {0.772} & {{\minus}0.176} \cr {{\minus}0.080} & {{\minus}0.176} & {0.092} \cr } } \right] $$
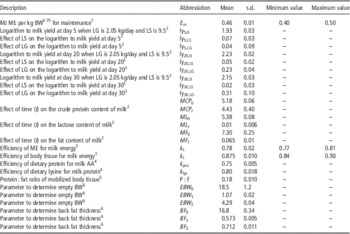
where ϕ 1 is the asymptote of the curve – that is, the maximum feed intake during lactation; ϕ 2 is the intake at day 1 postpartum; and ϕ 3 is a curvature coefficient. Random deviates c 1, c 2 and c 3 were derived from a multivariate normal distribution with a mean of zero and a covariance matrix Σ. The Bayesian approach yields the full posterior distribution of parameters from which uncertainties of covariance matrices for between-animal variability can be derived – that is, the uncertainty surrounding the estimate of Σ. The feed intake curve was set to be the maximum potential intake of the sows and was used as a constraint in the model. The metabolizable energy intake (MEI) was calculated using the intake curve. During lactation, the sow requires energy and nutrients for maintenance and milk production. Mammary gland growth is very limited during lactation (Kim et al., Reference Kim, Hurley, Han and Easter1999), and the energy and nutrient requirement for mammary growth was, therefore, ignored in the model. The ME requirement (MJ ME) for maintenance and milk were calculated by equations in Table 1 (equations 1 to 7), and parameters for the equations are listed in Table 2. The total energy requirement (MEreq) was calculated as sum of the energy requirement for maintenance and milk production. If the MEI was smaller than the MEreq, the model chose MEI as the intake curve (negative energy balance), and if the MEI was greater than the MEreq, the model used MEreq as the intake curve (zero energy balance).
Equations used for the factorial calculation of the requirement in lactating sows

ME=metabolizable energy; MEm=ME for maintenance; MY=milk yield; MCP=milk crude protein; CPdiet=crude protein content in the diet (%); ML=milk lactose; MF=milk fat; NEL=net energy in milk; MEL=ME for milk; EBW=empty body weight; BF=back fat.
Parameters used in the equations are listed in Table 2. Litter size (LS) and litter gain (LG, kg/day) are inputs to the model.
1 Noblet et al. (Reference Noblet, Dourmad and Etienne1990).
2 Hansen et al. (Reference Hansen, Strathe, Kebreab, France and Theil2012b).
3 Derived from Dourmad et al. (Reference Dourmad, Etienne, Noblet and Causeur1997).
Parameters used in the model

ME=metabolizable energy; LG=litter gain; LS=litter size; AA=amino acid.
Parameters are used in the equations in Table 1.
1 Dourmad et al. (Reference Dourmad, Etienne, Valancogne, Dubois, Van Milgen and Noblet2008).
2 Hansen et al. (Reference Hansen, Strathe, Kebreab, France and Theil2012b).
3 Theil et al. (Reference Theil, Jørgensen and Jacobsen2004).
4 Hansen et al. (Reference Hansen, Strathe, Theil and Kebreab2014).
5 The ratio between body fat (kg) and protein (kg) loss is an average of the total loss from farrowing to weaning and was found by reviewing the literature (Sauber et al., Reference Sauber, Stahly, Williams and Ewan1998; Dourmad et al., Reference Dourmad, Noblet and Etienne1998a; Jones and Stahly, Reference Jones and Stahly1999; McNamara and Pettigrew, Reference McNamara and Pettigrew2002; Gill, Reference Gill2006; also see Hansen et al., Reference Hansen, Strathe, Theil and Kebreab2014).
6 Derived from Dourmad et al. (Reference Dourmad, Etienne, Noblet and Causeur1997).
A number of sows turn catabolic during lactation due to insufficient feed intake and mobilize body reserves to maintain milk production (e.g. Mosnier et al., Reference Mosnier, Etienne, Ramaekers and Pere2010; Hansen et al., Reference Hansen, Lauridsen, Sørensen, Bach Knudsen and Theil2012a). Therefore, energy balances of sows in the model were either zero or negative, which also is the most likely situation for a high-producing lactating sow. It is not expected or desired that the sow gains weight during lactation, and therefore this approach gives a realistic representation.
It was assumed that the negative energy balance was due to an energy deficit. A literature survey on body and mobilized body tissue composition in lactating sows (Dourmad et al., Reference Dourmad, Noblet and Etienne1998a; Sauber et al., Reference Sauber, Stahly, Williams and Ewan1998; Jones and Stahly, Reference Jones and Stahly1999; McNamara and Pettigrew, Reference McNamara and Pettigrew2002; Gill, Reference Gill2006) showed that the sow mobilizes both fat and protein, although the protein requirement has been met by the diet. The calculated dietary protein requirement should cover the AA requirement for maintenance and milk production, as excessive mobilization from muscle protein is not desired because of the effects on subsequent reproductive performance (e.g. King et al., Reference King and Williams1984). In the case of a negative energy balance, the model assumptions are that the mobilized protein will be oxidized completely and not used as milk protein. This assumption may be a simplification and it is hard to quantify to what extent mobilized body protein is used for milk protein (Kim et al., Reference Kim, Baker and Easter2001). During the first week postpartum, the uterus is degenerated and protein could be available for milk production (Dourmad et al., Reference Dourmad, Noblet and Etienne1998a), but the quantity of released AA from the uterus is hard to determine and the model does not account for this.
The empty body weight (EBW) and body pools of protein and fat at day 1 postpartum were calculated from the given inputs for BW and BF by solving two equations with two unknowns (Table 1, equations 8 to 10; Hansen et al., Reference Hansen, Strathe, Theil and Kebreab2014). The BW and the body composition (fat and protein) of the sow can be calculated for all the days throughout lactation with knowledge of the energy and nutrient partitioning. When the energy balance of the sow is zero, there will be no change in BW and body composition, because maintenance requirements are supposed to be met. When the sow has a negative energy balance, the sow mobilizes protein and fat in a certain ratio (P : F; Table 2; Hansen et al., Reference Hansen, Strathe, Theil and Kebreab2014) to cover the energy deficit. The variation in ME for maintenance and the P : F ratio for mobilized tissues include sow-specific variation, because the BW and body composition was generated for each sow daily.
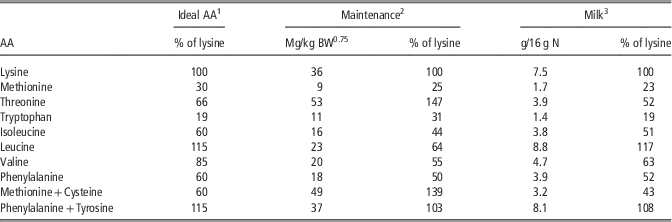
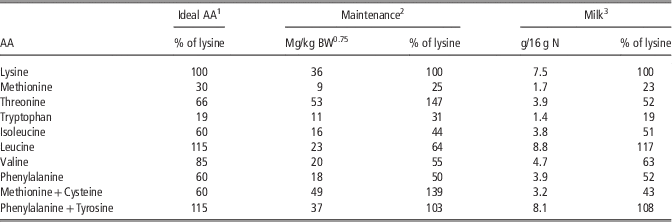
After calculating the AA requirement for maintenance and AA composition of milk protein (Table 3), the dietary protein and AA requirements can be estimated. The efficiencies of using dietary ME for milk energy (k L) and body tissue for milk energy (k t) are given in Table 2.
Daily amino acid (AA) requirement for maintenance, and AA composition of maternal, fetal and milk protein
1 Dourmad et al. (Reference Dourmad, Etienne, Valancogne, Dubois, Van Milgen and Noblet2008).
2 Dourmad et al. (Reference Dourmad, Noblet, Pere and Etienne1998b).
3 Darragh and Moughan (Reference Darragh and Moughan1998).
The efficiencies of using dietary AA for milk protein (k AA) were calculated using the van Milgen et al. (Reference Van Milgen, Valancogne, Dubois, Dorumad, Seve and Noblet2008) approach. The efficiencies were calculated assuming that the ideal AA profile was correct for a sow with a BW of 220 kg and an average milk yield of 10 kg/day with 5.4% lactose, 5.2% protein and 7.3% fat (Hansen et al., Reference Hansen, Strathe, Kebreab, France and Theil2012b). The expected efficiency for converting dietary standardized ileal digestible (SID) lysine (k lys) to milk lysine was set to 0.80 (Jones and Stahly, Reference Jones and Stahly1999), with a s.d. of 0.02 (Table 2), from which the k AA for the other essential AA were estimated. The variation in AA composition for maintenance, milk and body tissue and efficiencies of AA utilization were specified at the population level.
Equations with LG or LS as driving variables (Table 1) are inherently sow-specific, and therefore the lactation curves were sow-specific. Estimation of the variance components required to run the model can be derived by fitting linear and nonlinear mixed models to data sets with sufficient structure, allowing variation within- and between-sows to be estimated, such as the feed intake curve described previously (FI(t)).
Simulation to estimate requirements
The stochastic simulation model was built from Bayesian principles with the following three hierarchies: (1) within-sow variability – for example, a milk production profile; (2) between-sow variability – for example, multiple milk production profiles; and (3) uncertainty of model parameters. The simulation-based approach was described by Hansen et al. (Reference Hansen, Strathe, Kebreab, France and Theil2012b) for making predictions of milk yield in lactating sows. A total of 1000 sows were simulated using the model developed in this study. The simulation included the following steps: (1) a set of 1000 parameters were drawn from a multivariate normal distribution to account for the between-sow variation; (2) average daily protein and AA requirements were calculated for all sows; (3) the medians for the requirements of the 1000 sows were estimated; (4) steps (1) to (3) were repeated 100 times to estimate uncertainty in the median (50th percentile of the empirical distribution function) of the calculated requirements (structural uncertainty in the model); and (5) the true requirement of the population and its CV were calculated based on the 100 medians.
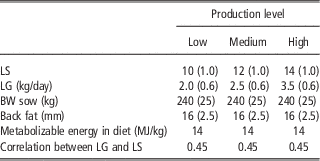
The model simulated daily requirements for each animal, and these requirements can be summed for any given period giving the variation of the requirement over a period for a single animal in the simulation or looking at the between-animal variation at a given time point in the simulated period. The recommendations were calculated as average values for the entire lactation period and as a recommendation for each week of lactation. The calculated requirement was given as SID protein or AA in g/day and g/MJ ME intake. As an example of the use of the model, several simulations of 100×1000 sows were made, one using three scenarios with a population of low-, medium- and high-producing sows, respectively, as defined in Table 4, to illustrate how the requirements change with different production levels. In another scenario, the requirement for each week throughout lactation were simulated using the inputs for a sow with a high production level to illustrate how the requirements and, thereby, the dietary recommendation might change from early to late lactation. Inputs to the scenarios are given in Table 4.
Inputs for the simulation of a population of sows with low, medium and high production levels
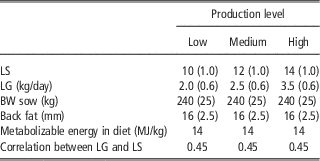
LS=litter size; LG=litter gain.
Standard deviations are given in parenthesis.
The results were compared with the National Research Council (NRC) (2012) model. Results from the literature on lysine requirements (King et al., Reference King, Toner, Dove, Atwood and Brown1993; Coma et al., Reference Coma, Zimmerman and Carrion1996; Dourmad et al., Reference Dourmad, Noblet and Etienne1998a; Sauber et al., Reference Sauber, Stahly, Williams and Ewan1998; Yang et al., Reference Yang, Pettigrew, Johnston, Shurson, Wheaton, White, Koketsu and Rathmacher2000; Huang et al., Reference Huang, Liu, Sun and Peng2013) were used to test the accuracy of the model using inputs from the studies (BW, BF, LG, LS and dietary ME content). From each study, numbers from the group with lowest body protein loss or N balance closest to zero were chosen. These groups were chosen because they met the assumptions of the model – that is, mobilized body protein is not used for milk protein and excessive body protein mobilization is undesirable. In studies where only total lysine was given as the requirement, a standard ileal digestibility of 85% for lysine was used. This comparison was used to calibrate the model by adjusting the efficiency of using dietary SID lysine for milk (k lys).
Results and discussion
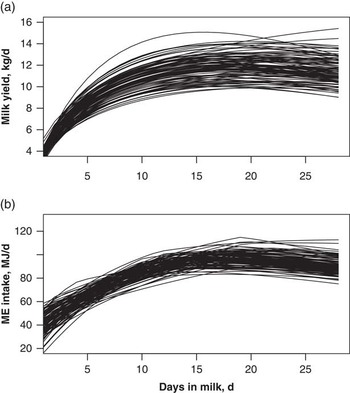
The model gives several outputs such as lactation curves (Figure 1a), ME intake curves (Figure 1b), energy and nutrients for maintenance and curves for changes in BW and body composition for each of the simulated sows.
Simulation of (a) milk yield (kg/day) and (b) ME intake (MJ/day) throughout lactation for 50 sows. Each line represents a sow.

Test of accuracy of the model
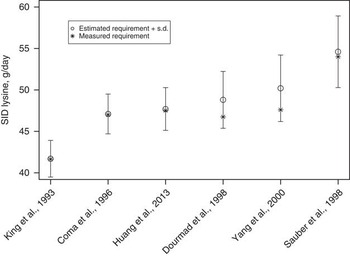
The k lys was set to 0.80 after comparing the model prediction of SID lysine requirement and six studies (King et al., Reference King, Toner, Dove, Atwood and Brown1993; Coma et al., Reference Coma, Zimmerman and Carrion1996; Dourmad et al., Reference Dourmad, Noblet and Etienne1998a; Sauber et al., Reference Sauber, Stahly, Williams and Ewan1998; Yang et al., Reference Yang, Pettigrew, Johnston, Shurson, Wheaton, White, Koketsu and Rathmacher2000; Huang et al., Reference Huang, Liu, Sun and Peng2013; Figure 2). The k lys at 0.80 was consistent with what was derived from the InraPorc model (Dourmad et al., Reference Dourmad, Etienne, Valancogne, Dubois, Van Milgen and Noblet2008), but was higher than the efficiency reported by NRC (2012), possibly due to the method used to obtain milk yield data. The NRC (2012) bases the estimation of k lys on milk yields measured by weigh-suckle-weigh, whereas our model uses data measured using the deuterium dilution technique, which generally gives higher milk yields, and thereby a higher k lys. The requirements estimated by the model were slightly higher (0.1% to 5.2%) than the requirements determined in the six studies, but the measured requirements were all within ±1 s.d. of the estimated values (Figure 2). The assumptions for choosing the different groups from the six studies to test the model were that mobilized body protein was not used for milk protein. This may not be completely true because some AA can be provided from body protein, but they may also be completely oxidized as assumed in the model.
Comparison of model-predicted SID lysine requirement and those determined in six studies. The requirement was estimated using BW, back fat thickness, LG, LS and dietary ME content given in the six studies. SID=standardized ileal digestible; LG=litter gain; LS=litter size; ME=metabolizable energy.

Simulations of the requirement of sows with different production levels and at different stages of lactation
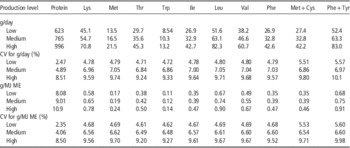
The average daily SID protein and lysine requirements increased with the increasing production level of the sows (Table 5). The simulation of the requirement of 1000 sows was repeated 100 times to account for the uncertainty of the parameters in the model. This procedure generated 100 empirical distribution functions as shown in Figure 3. The structural uncertainty of the model is seen as the variation between simulations (lines in Figure 3) in the vertical direction, whereas the differences seen in the horizontal direction are the between-sow variations within each simulation. The results for the other AA are presented in Table 5, but the results may be less reliable compared with lysine, because few studies have looked at the requirement and the efficiency of utilizing these AA for milk production.
The average daily standardized ileal digestible (SID) lysine (a) and protein (b) requirements in g/day and the average daily SID lysine (c) and protein (d) requirements in g/MJ ME. Graphs show 100 repetitions of the simulation of 1000 sows. Each line represents a simulation of 1000 sows. Variation in the vertical direction is the between-sow variation within each simulation. The variation in the horizontal direction is the variation between simulations (uncertainty of the model). ME=metabolizable energy.

Average daily requirements of standardized ileal digestible protein and amino acidsFootnote 1 in g/day and g/MJ metabolizable energy (ME) as calculated for a population of 100×1000 low-, medium- and high-producing sows (Table 4)

The requirement is given as the mean of the medians and CV.
1 Lys=lysine; Met=methionine; Thr=threonine; Trp=tryptophan; Ile=isoleucine; Leu=leucine; Val=valine; Phe=phenylalanine; Cys=cysteine and Tyr=tyrosine.
The s.d. increased with increasing requirements at higher production levels. The s.d. can be used as a safety margin in the dietary recommendations to make sure that the chosen percentile (in the examples 50% is used) of the sows have their requirement fulfilled.
Comparing simulations of sows with different production levels, the requirement for protein and AA increased with increasing production level. This can be ascribed to a higher milk production in the higher-producing sows. Sows also have an increasing requirement with increasing production level in the NRC (2012) model, but the increase from low to high production level is lower than in the current model (172 v. 373 and 13.8 v. 25.7 g/day for protein and lysine, respectively, between the low- and high-production group). The NRC (2012) model estimates 1.3% to 18.9% and 4.0% to 23.1% lower requirements of protein and lysine than the current model, respectively, for a given sow, and the largest discrepancies were seen for the high production level. Only the lysine requirement of the low-producing sow estimated by the NRC (2012) model was within ±1 s.d. of the recommendation estimated by the current model. The differences were mainly due to methods used for estimating requirements for milk protein and AA. The NRC (2012) model based on weigh-suckle-weigh data underestimates the average milk yield by ~2 kg/day (Hansen et al., Reference Hansen, Strathe, Kebreab, France and Theil2012b). In addition, the protein and AA content of milk used in the NRC (2012) model is slightly lower compared with the current model. Differences in milk yield and composition resulted in the NRC (2012) model estimating lower requirements for a given scenario compared with the current model. Another difference between the models is that the NRC (2012) model estimates requirements for either primiparous or multiparous sows, whereas the current model only uses size and production level of the sow as input. The size and production level will capture a lot of the differences seen between primiparous and multiparous sows, but it could be argued that different means and covariance matrices should be used for primiparous and multiparous sows for representing full biological variation.
The average feed intake for low, medium and high production levels were 5.51 (s.d.=0.11), 6.04 (s.d.=0.13) and 6.52 kg/day (s.d.=0.10), respectively. The inclusion of the feed intake curve enables the calculation of the required dietary concentration of protein or AA to cover the sows’ requirements. This is an important feature of the model, because the potential feed intake or feed allowance of the sow needs to be considered in order to evaluate whether the requirements are covered by a given diet. The dietary concentration of protein and AA increased with increasing production level (Table 5), which indicates that the increase in milk production is greater than the increase in intake capacity. This is a reasonable result of the simulation, because sows with a high milk production generally mobilize more from body tissues than sows with lower milk production. Therefore, high milk production sows reach their maximum feed intake capacity earlier in lactation (O’Grady et al., Reference O’Grady, Lynch and Kearney1985; Eissen et al., Reference Eissen, Kanis and Kemp2000). It is important to consider that different groups of sows might have different feed intake capacities or are fed according to different feeding curves to formulate diets that fulfill the daily protein and AA recommendations. It is, however, important to mention that this will depend on the applied feed intake curve. The curve applied as an example of feed intake in this model is developed from a data set from a study with only 40 second-parity sows (Hansen et al. Reference Hansen, Lauridsen, Sørensen, Bach Knudsen and Theil2012a), and the variation is probably higher between sows and between parities (e.g. Kruse et al., Reference Kruse, Traulsen and Krieter2011) within a herd than captured by this data. If total requirement of protein and AA are known, a decision can be made for a certain percentage of the requirement to be covered by mobilization of body protein and the remaining by the dietary intake. However, before such strategy can be applied successfully, it is essential to know how much protein a sow can mobilize without compromising her health, productivity and longevity.
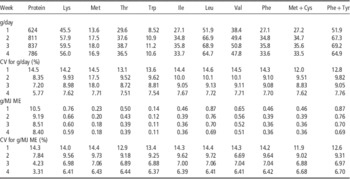
The daily SID protein and lysine requirements were lowest in week 1, intermediate in week 2 and 4 and the highest in week 3 of lactation (Table 6). The higher CV in week 1 compared with week 2 to 4 is partly a dynamic effect, because the increase from day 1 to 7 in week one is much higher than the increase during the other weeks. The required dietary concentration of SID protein and lysine decreased from 10.5 (CV=14.3%) and 0.76 (CV=14.0%) in week 1 to 8.40 (CV=3.3%) and 0.59 g/MJ ME (CV=6.4%) in week 4, respectively. Results for other AA are given in Table 6, but care should be taken because very little information about AA other than lysine is available in the literature. The requirement was the lowest in the 1st week, highest in the 3rd week and intermediate in weeks 2 and 4, and the same pattern was observed for other AA (Table 6). The changes in the requirements during lactation follow the changes in milk production, which was the lowest during the 1st week and peaked in week 3 (Hansen et al., Reference Hansen, Strathe, Kebreab, France and Theil2012b). Similar patterns are also seen in the NRC (2012) model, with the lowest requirement in week 1 and the highest in week 3. The decrease in dietary concentration of protein and AA from week 1 to 4 indicates that, although the requirement was lower in the 1st week, the feed intake capacity was even lower compared with later in lactation, and the sows need more concentrated feed in early lactation to fulfill their requirements. No major changes of the ratio between other AA and lysine were seen between the 4 weeks of lactation. The AA requirement for milk production represents the majority of the total AA requirement, and AA for maintenance represents only a minor part during all 4 weeks. The ratio is also very similar for the three production levels, because milk production represents most of the requirement regardless of milk yield. Therefore, the ratio between other AA and lysine will mostly be dictated by the AA composition of the protein requirement for milk production. Therefore, no changes in ratios were seen between the 4 weeks of lactation.
Daily requirements of protein and standardized ileal digestible amino acidsFootnote 1 in g/day and g/MJ metabolizable energy (ME) for every week during lactation as calculated for a population of 100×1000 sows with medium production levelThe requirement is given as the mean of the medians and CV

The requirement is given as the mean of the medians and CV.
1 Lys=lysine; Met=methionine; Thr=threonine; Trp=tryptophan; Ile=isoleucine; Leu=leucine; Val=valine; Phe=phenylalanine; Cys=cysteine and Tyr=tyrosine.
The methodology of the requirement calculations
The factorial approach seems appropriate to determine the protein and AA requirement for lactating sows, because many sows turn catabolic during lactation and mobilize AA from body protein to fulfill the requirement for AA and to some extent energy for milk production (Trottier and Guan, Reference Trottier and Guan2000). Dose-response studies (i.e. empirical approach) have limited application due to the definition of the most appropriate criterion for setting the requirement. King et al. (Reference King, Toner, Dove, Atwood and Brown1993) showed that lactational performance is maximized at 13% to 16% dietary CP, whereas nitrogen balance is maximized at 20% to 22% dietary CP, illustrating the problem of identifying a suitable criterion/trait for building recommendations. The majority of dietary protein and AA are used for milk production during lactation. Therefore, the requirement calculations are sensitive to the choice of a milk production curve, which was illustrated when comparing our model with the NRC (2012) model.
The simulation shows that 1000 sows with similar inputs will have different outputs, and these differences should be acknowledged in order to understand productivity at the herd level. Therefore, a stochastic simulation for a given scenario should always be replicated (Kristensen and Pedersen, Reference Kristensen and Pedersen2003) due to the inherent uncertainty of structural parameters. Different sources of randomness are used to represent the biological diversity of sow characteristics as they are found in reality. They may have a large effect on the results of a given simulation, and different simulation runs can, therefore, produce very different results, due to a different sequence of random numbers that are drawn for the different processes. Simulation results should, therefore, always be averaged over multiple runs when addressing herd characteristics.
Future applications of the model
The model can be a valuable tool in estimating requirements for individual animals and to develop new dietary recommendations for AA and protein for populations of lactating sows. Strategies for precision feeding can be improved using the model, which can potentially enhance the environmental and economic sustainability of sow operations due to lower nutrient excretion and diet costs. The increase in the size of modern sow herds could improve the opportunity to use group or phase feeding. Specific feed formulations could be made for different groups of sows – for example, first parity sows may have a different requirement than multiparous sows. Sows could also be divided into groups according to their body size or body condition, as Kim et al. (Reference Kim, Hurley, Wu and Ji2009) suggest that the AA requirement during lactation might depend on the body condition of the sow.
The daily protein and AA requirement changed throughout lactation for the simulated sows (Table 6). The requirement is lower in early lactation than later in lactation; therefore, ideally the concentration (g/MJ ME) of protein and AA should be increased in early lactation to meet the requirement, because the feed intake is also lower. New feeding strategies could be developed targeting different phases during the lactation period, as the simulations show that the requirements of the 1st week differ from the requirements of the last 3 weeks of lactation.
In the simulations, the median was chosen as the dietary recommendation for the population, indicating that 50% of the population will have their requirement covered. The s.d. was added as a safety margin, and this can be used when giving recommendations for requirements. The median was used as an example of the dietary recommendation in this simulation, but any other percentage of the population could be used, which could depend on feed prices or other production costs and targets.
The current model is an improvement on existing empirical models for determining the requirements of lactating sows using between-animal variation. However, the model could be further improved if new experiments using modern genotype sows were carried out to gain knowledge on changes in body composition throughout lactation and efficiencies of AA of dietary and body tissue origin for milk production. Data on efficiencies of essential AA apart from lysine are scarce. Similarly, there is lack of knowledge on whether efficiencies change during lactation depending on feed intake or when sows turn from the anabolic to catabolic state. Kim et al. (Reference Kim, Hurley, Wu and Ji2009) found that the order and ratios of the first limiting AA changed depending on the BW loss of the sow, which also emphasizes the complexity of AA nutrition in lactating sows and the need of generating more knowledge in this area.
In conclusion, the model is a valuable tool to understand the dynamics of protein and AA requirements of lactating sows and for the development of optimal feeding strategies by including information on between-sow variation and building new dietary recommendations.