





Introduction
In comparison to crop plants, weeds, which can be defined as any plant growing where it is not desired, compete with crops for nutrients, water, light, and space and are highly competitive and adaptable under unfavorable conditions. This is due to their high seed counts, phenotypic plasticity, and life-history traits that favor rapid reproduction over productivity (Neve and Caicedo Reference Neve, Caicedo, Upadhyaya, Clements and Shrestha2022; Ramesh et al. Reference Ramesh, Matloob, Aslam, Florentine and Chauhan2017; Schroeder et al. Reference Schroeder, Thomas and Murray2005). They produce numerous small seeds that persist and contribute substantially to soil seedbanks. Under favorable conditions of moisture, temperature, light, and oxygen, weed seeds can remain dormant and delay germination (Liebman et al. Reference Liebman, Nguyen, Woods, Hunt and Hill2021; Rao et al. Reference Rao, Brainard, Kumar, Ladha and Johnson2017; Rouw et al. Reference Rouw, Ribolzi, Douillet, Tjantahosong and Soulileuth2018). Weed seeds also tend to germinate and emerge earlier, grow and flower faster, and reach maturity before cultivated crops (Chauhan Reference Chauhan2012). Throughout the growing season, and particularly early in the season, weeds compete with crops for resources, thereby reducing yield and quality of the crops (Anwar et al. Reference Anwar, Islam, Yeasmin, Rashid, Juraimi, Ahmed and Shrestha2021; Horvath et al. Reference Horvath, Clay, Swanton, Anderson and Chao2023; Rajcan and Swanton Reference Rajcan and Swanton2001). However, crop yield losses due to weeds depend on the weed species that exist, landscape position, water management, soil fertility, growing season, rotation, and weed control product use and timing (Ahmed et al. Reference Ahmed, Alam, Hossain, Islam, Awan, Soufan, Qahtan, Okla and El Sabagh2021a; Norsworthy and Oliveira Reference Norsworthy and Oliveira2004; Kent et al. Reference Kent, Johnson and Becker2001).
Weed vegetation in an area is shaped not only by environmental factors but also by edaphic and biological conditions such as soil texture and structure, pH, nutrient and moisture levels, crops, control measures, and field history (Fried et al. Reference Fried, Norton and Reboud2008; Hakim et al. Reference Hakim, Juraimi, Ismail, Hanafi and Selamat2010). Crops and cropping systems with varying input levels and management regimes also influence weed diversity (Andersson and Milberg Reference Andersson and Milberg1998; Lososová et al. Reference Lososová, Chytrý, Cimalová, Kropác, Otýpková, Pyšek and Tichý2004). The biodiversity of weed communities often necessitates multiple control tactics, thereby limiting the effectiveness of single-control tactics within heterogeneous weed populations (Altieri Reference Altieri2002; Chauhan et al. Reference Chauhan, Ahmed, Awan, Jabran and Manalil2015). Agronomic practices, including crop type and cultivar, season, land preparation and tillage, and herbicide use, can be deployed to limit weed diversity and competition within cropping systems (Derksen et al. Reference Derksen, Lafond, Thomas, Loeppky and Swanton1993; Marshall et al. Reference Marshall, Brown, Boatman, Lutman, Squire and Ward2003). A clear understanding of weed species diversity within an agroecosystem can assist in guiding control measures to limit weed introduction and spread (Dekker Reference Dekker1997; Islam et al. Reference Islam, Nasir, Akter, Yeasmin, Islam, Ahmed, Anwar, Hadifa, Baazeem, Iqbal, Juraimi and Sabagh2021).
Cropping strategies and practices that increase cropping diversity limit the niches and resources available to weeds (Hyvönen and Salonen Reference Hyvönen and Salonen2002). Effective manipulation of cropping systems and management regimes requires improved understanding of the spatial and temporal dynamics of weed communities (Swanton and Murphy Reference Swanton and Murphy1996). For example, reduced- or no-tillage practices may—at least initially—result in greater crop–weed competition and a broader range of weed species (Hossain et al. Reference Hossain, Gathala, Timsina, Johnson and Krupnik2020). Evidence from crop rotation studies suggests that cropping sequence further conditions these outcomes by shaping disturbance frequency and resource availability over time (Koocheki et al. Reference Koocheki, Nassiri, Alimoradi and Ghorbani2009; Pratiwi and Marino Reference Pratiwi and Marino2025). In cereal–forage rotations, weed communities are often more diverse and more stable than those observed in cereal monocultures (Stevenson et al. Reference Stevenson, Legère, Simard and Pageau1997).
Rice (Oryza sativa L.)-based cropping systems dominate South Asian agriculture (Coggins et al. Reference Coggins, McDonald, Silva, Urfels, Nayak, Sherpa, Jat, Sahay, Krupnik, Kumar, Malik, Sapkota, Nayak and Craufurd2025). In Bangladesh and Nepal, rice production relies heavily on manual seedling transplanting into wet-tilled puddled soil, a technique favored to maintain water within rice paddies, ease transplanting, and limit crop-weed competition (Ahmed et al. Reference Ahmed, Kumar, Zaman, Dewan, Khatun, Hossain, Singh, Timsina and Krupnik2025; Devkota et al. Reference Devkota, Devkota, Acharya and McDonald2019). Nonetheless, weeds remain a major pest in rice in both countries. Manual uprooting is the most common weed management practice, although herbicide use is steadily increasing, and pretilachlor, pendimethalin, bensulfuron methyl, and acetochlor are the most commonly used herbicides (Ahmed et al. Reference Ahmed, Kumar, Alam, Dewan, Bhuiyan, Miajy, Saha, Singh, Timsina and Krupnik2021b).
In Bangladesh, rice–fallow–rice and rice–wheat (Triticum aestivum L.)/lentil (Lens culinaris Medik.)–jute (Corchorus olitorius L.) rotations are common, while rice–wheat and rice–lentil are common in Nepal (Nasim et al. Reference Nasim, Shahidullah, Saha, Muttaleb, Aditya, Ali and Kabir2018; Pokhrel and Soni Reference Pokhrel and Soni2017). Irrigated dry-season rice and rainfed rainy-season rice cover nearly 92% of Bangladesh’s cultivated rice area (BBS 2022). In Nepal, farmers cultivate rice in the rainy season and wheat, lentil, or maize (Zea mays L.) in the dry winter season. Crop husbandry practices such as crop rotation (Chamanabad et al. Reference Chamanabad, Ghorbani, Asghari, Tulikov and Zargarazadeh2009), fertilizer management (Yin et al. Reference Yin, Cai and Zhong2006), tillage (Hossain et al. Reference Hossain, Begum, Hashem, Rahman, Ahmed, Hassan, Javed, Shabbir, Hadifa, Sabagh and Bell2021), and herbicide use (Grundy et al. Reference Grundy, Mead, Bond, Clark and Burston2011) strongly influence weed community diversity in these systems.
Understanding weed diversity alongside key environmental factors is central to improving weed management strategies in rice-based systems (Kenkel et al. Reference Kenkel, Derksen, Thomas and Watson2002). This study assesses the effects of environmental variables, cropping systems, and weed management practices on weed species composition and diversity in rice fields in Bangladesh and Nepal. To our knowledge, the combined influence of management practices and environmental factors on weed species diversity in rice has not been examined across both countries and identifying dominant and problematic species alongside farmer management gaps may help prioritize management efforts and guide targeted measures to limit their growth and spread. The resulting data of this study can support the development of context-specific guidance for farmers seeking to manage troublesome weed flora in rice cultivation.
Materials and Methods
Field trials and farmer diagnostic surveys were conducted in Bangladesh and Nepal between 2016 and 2019 to evaluate environmental gradients, crop rotation, and herbicide effects on weed diversity in rice and identify dominant and problematic weed species.
Bangladesh: Field Study Site Description and Farm Surveys
Surveys were conducted in two districts of Bangladesh—Jhenaidah and Rajbari—during the wet season rice of 2016 and 2019, covering 120 farmers’ fields. Jhenaidah District is located within the High Ganges River Floodplains (HGRF) agroecological zone (AEZ), while Rajbari District lies in the Lower Ganges River Floodplains (LGRF) AEZ. These districts represent contrasting floodplain settings with differences in hydrology, soil properties, and rice management conditions.
The HGRF AEZ features intensive and diversified cropping patterns, supported by predominantly “high” and “medium” land types defined by relative elevation and seasonal flooding in Bangladesh (BARC 2012). Highland remains above normal monsoon flooding and permits timely field operations and dry-season cropping, while medium land experiences shallow seasonal flooding but drains sufficiently to support post-monsoon cultivation. Combined with silty loam and silty clay loam soils, these conditions enable dry irrigated rice–fallow–wet season rice, wheat–jute–wet season rice, lentil/mustard (Brassica spp.)–jute–wet season rice, mustard–dry irrigated rice–wet season rice, onion (Allium spp.)–jute–wet season rice, and maize–fallow–wet season rice cropping systems.
In contrast, the LGRF AEZ is dominated by “medium” and “medium-low” land types, defined in Bangladesh by greater flood depth and longer seasonal inundation, with 14% very lowland, 31% medium-low, 29% medium-high, and 13% highland areas (BARC 2012). Medium-low and very lowland areas experience prolonged monsoon flooding that constrains crop choice and timing, while medium-high and highland areas drain earlier and allow greater flexibility in dry-season cropping. Soil fertility is generally moderate, with low organic matter on ridges and higher levels in basin areas, and soils range from silty clay loam to heavy clay in low-lying fields and from silt loam to silty clay loam on ridges, supporting cropping systems such as wheat–jute–wet season rice, dry irrigated rice–fallow–wet season rice, onion–jute–wet season rice, and lentil–jute–wet season rice.
Before the wet season rice transplanting in Bangladesh, farmers were selected based on their willingness to transplant within approximately 7 d of one another, participate in surveys, and allow weed sampling from their fields. Rice fields were chosen along transects extending 40 km on either side of the primary highway through each district, with plots located at least 50 m from the road to minimize edge effects.
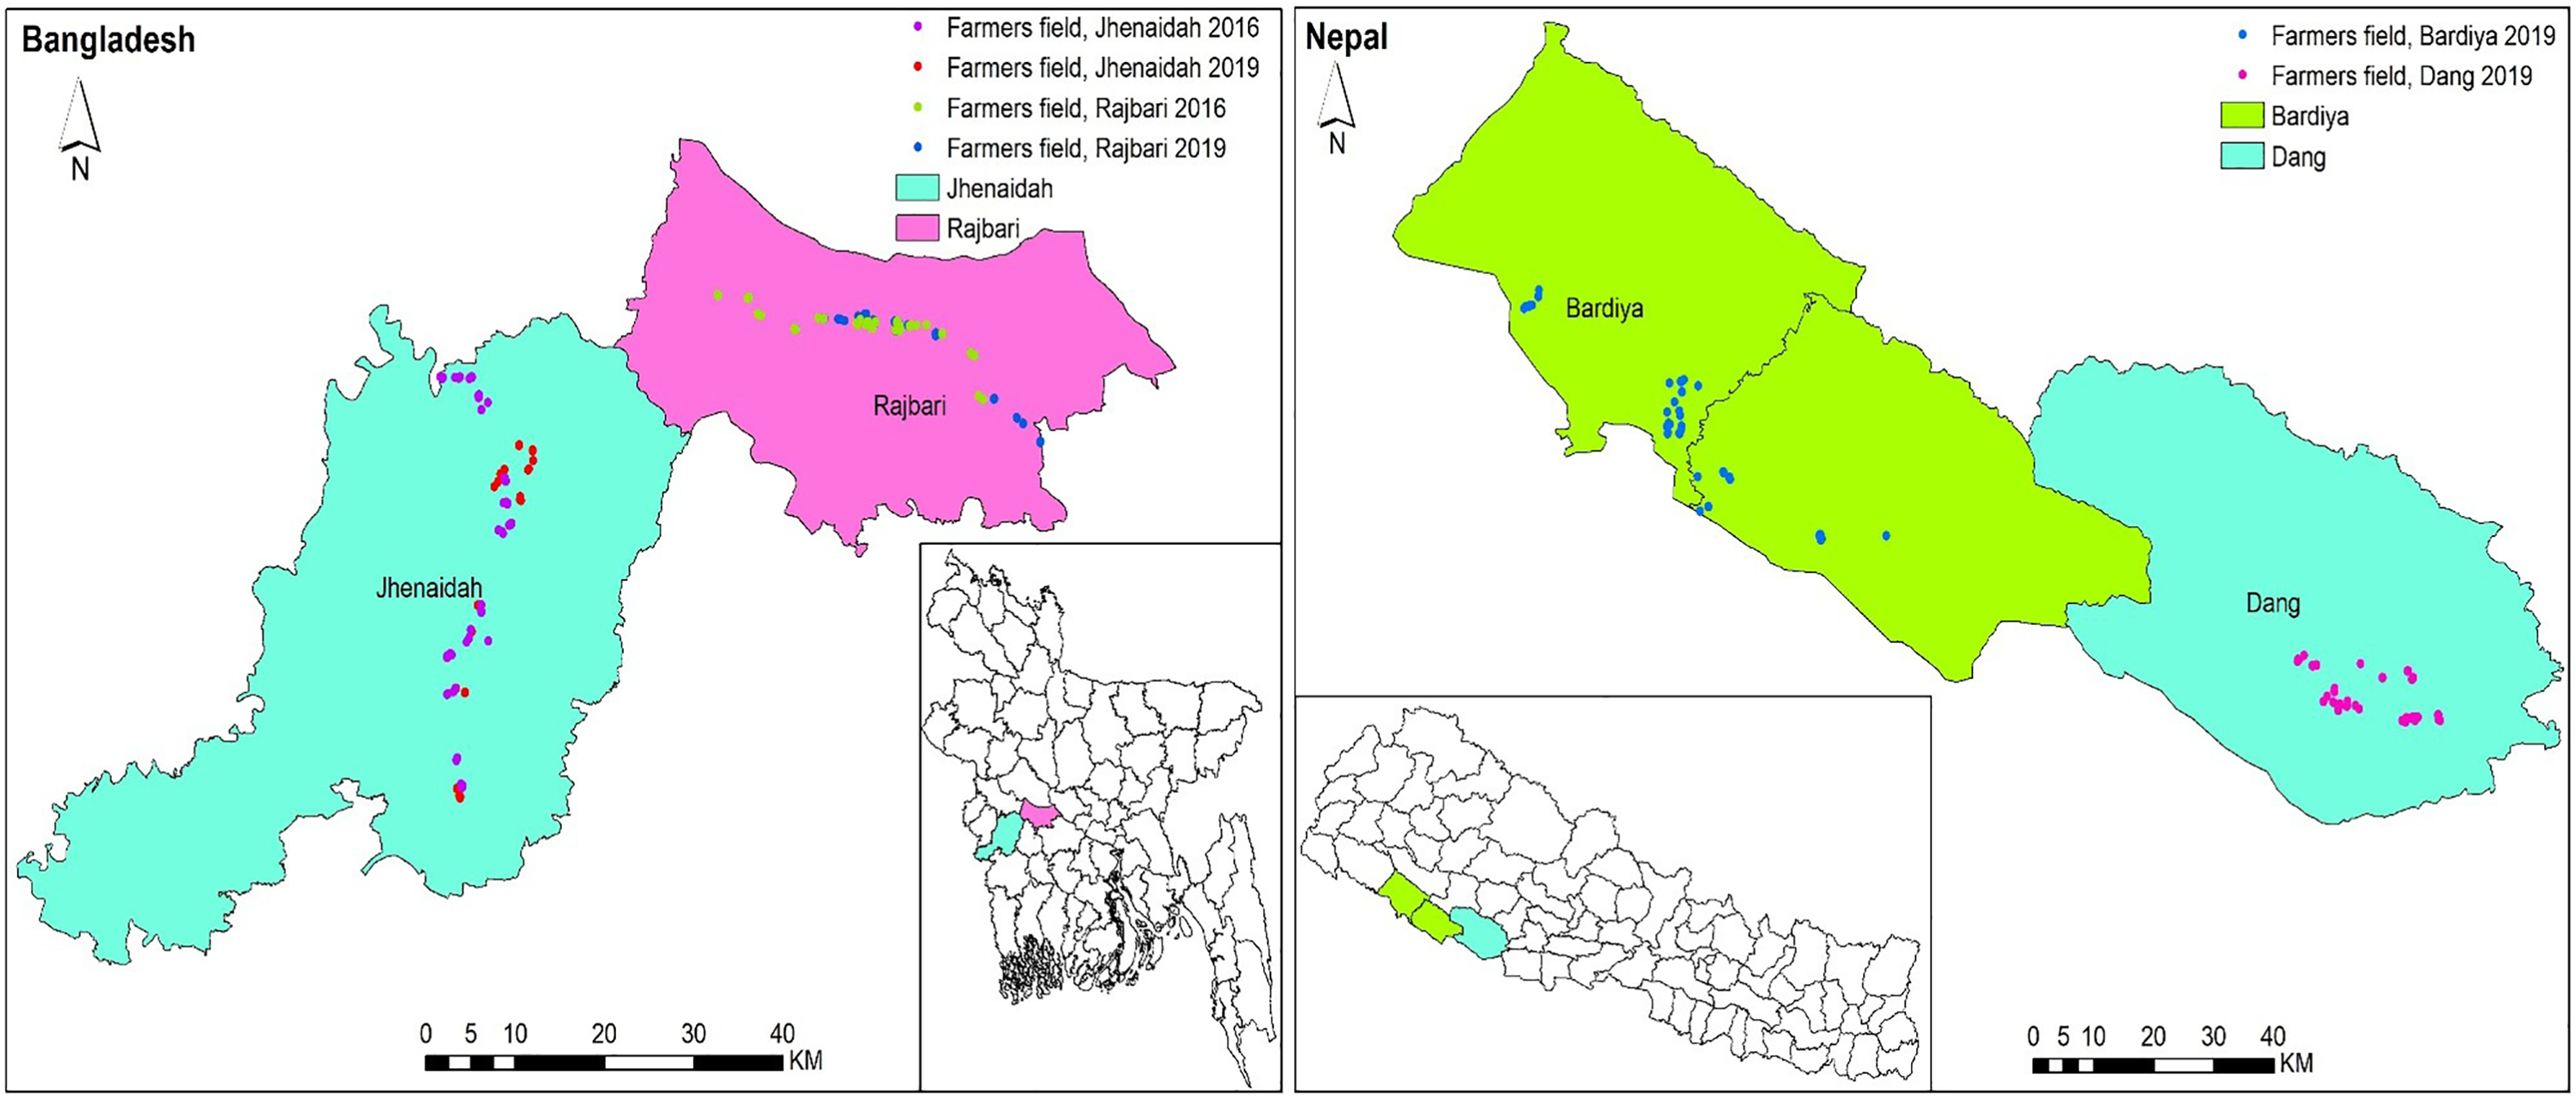
Across sites (Jhenaidah and Rajbari) and years, 60 fields were selected from each of two cropping systems (rice–fallow–rice and wheat–jute–rice) and weed management regimes, including the use (applied) or non-use (not applied) of preemergence herbicide. This resulted in four categories of farmers, each comprising 15 fields. The fields were spatially arranged with a minimum of 2-km distance between fields within each category. In 2019, the study followed the same sampling procedure as in 2016, but approximately 25% of participating farmers’ fields were replaced due to shifts in cropping patterns or weed management practices (e.g., farmers switched from no herbicide to herbicide use or changed their crop rotations). Field locations are shown in Figure 1, with details on weed sampling procedures provided below in the section “Weed Species and Rice Sampling”.
Location of farmers’ fields from which weed community surveys were conducted along a transect in Jhenaidah and Rajbari, Bangladesh, and Bardiya and Dang, Nepal.

After rice was harvested, a short questionnaire was administered to participating farmers to gather information on their use of inputs and management practices. In 2017, no field study was conducted; however, interviews were conducted with farmers from the 2016 study locations to track patterns in weed management practices and to identify dominant and problematic weed species based on farmers’ observations and experiences. A concise questionnaire guided farmer interviews, and each farmer was shown a poster of weed species and asked to identify those considered most problematic. The questionnaire also captured farming household characteristics and land type classification (high, medium, or low land), and the costs for common weed control products. It further documented field water management regimes, including average flooding depth during the rice growing season, along with crop management practices and detailed weed management within the sampled plots.
Specific weed management data included weed density ratings, control methods, number and timing of manual weeding events, labor requirements and associated costs, number and timing of herbicide applications, herbicide types and names, application methods and dosages, and herbicide-related costs. Weed posters served as visual aids during interviews to help farmers identify the most dominant weed species in their fields, as well as those poorly or not controlled by herbicides.
Nepal: Field Study Site Description and Farm Surveys
In Nepal, weed community composition surveys were conducted during the wet season of 2019 across 120 fields in three districts: Dang, Banke, and Bardiya. Dang is situated in the inner Terai, a low-elevation valley within Nepal’s southern plains that is bounded by the Churiya Range to the south and the Mahabharat Range to the north, whereas Banke and Bardiya lie on the outer Terai plains far from the Churiya foothills, which are unlikely to affect the local environment of these sites. The study area forms part of the northern Indo-Gangetic plain, where rice–wheat remains the predominant cropping system alongside rice–lentil and rice–mustard or canola (Brassica napus L. subsp. napus), and where a third crop may be added under irrigation, but fields often remain fallow after the winter harvest under rainfed conditions (Bhatt et al. Reference Bhatt, Singh, Hossain and Timsina2021).
Rice-based cropping systems dominate medium to lowland areas, where soils range from sandy loam to clay loam. In the Dang valley, mean sand, silt, and clay contents are approximately 28%, 38%, and 34%, respectively (Panday et al. Reference Panday, Ojha, Chalise, Das and Twanabasu2019), consistent with alluvial soils in western Terai districts formed by deposits from the Rapti and Babai rivers. Organic matter content across the study districts ranges from low to medium. Relative to eastern Nepal, the area receives less rainfall due to a shorter monsoon period (Pokharel et al. Reference Pokharel, Wang, Meyer, Marahatta, Nepal, Chikamoto and Gillies2019).
With the exception of cropping systems, field selection followed the same procedure as in Bangladesh. Fields with two cropping patterns—rice–wheat–fallow and rice–lentil–fallow—were included, with 60 fields selected for each (Figure 1). Weed management options for the use of preemergence herbicides or no use of herbicides and field numbers matched those used in Bangladesh. As in Bangladesh, farmers were interviewed following rice harvest to collect crop management information for each field investigated.
Weed Species and Rice Sampling
Within 1 wk after rice transplanting, five 1-m2 quadrats (1 m by 1 m) were randomly placed in each field along a diagonal transect, with each positioned at least 2 m from the field edges. The boundaries of each quadrat were marked by placing sticks at the four corners. These marked areas were left unweeded for 40 to 50 d after transplanting (DATr) until the time of sampling. Within each 1 m by 1 m marked quadrat, a smaller quadrat measuring 50 cm by 60 cm was placed to collect weed samples for species identification and biomass measurement.
At 40 to 50 DATr, weeds were uprooted from the 50 cm by 60 cm area within each 1-m2 marked location. The uprooted weeds were washed with clean water and placed separately in polyethylene bags for each of the five sampling locations. Samples were then transported to the laboratory for sorting of species and species count. Weeds were identified and counted by species, after which the roots were separated, and species-wise biomass was measured after oven-drying at 70 C for 72 h. All weed species in a sample were summed for weed density calculation. Simultaneously, all rice hills from the same area were cut at the soil base and collected. Rice biomass was washed to ensure no soil or debris was retained. Rice samples followed the same drying procedure. Soil texture within each quadrat was classified as light (sandy), loam, or heavy (clay) using the touch method during weed sampling, following Ritchey et al. (Reference Ritchey, McGrath and Gehring2015), and subsequently composited at the field level.
Data Processing
The density and dry weight of weeds, as well as the dry weight of rice plants, were expressed as the number of plants per square meter (plants m−2) and grams of dry weight per square meter (g m−2), respectively. Weed indices were calculated using Equations 1 to 9 as described by Hakim et al. (Reference Hakim, Juraimi, Ismail, Hanafi and Selamat2013):
 $\small{\eqalign{& {{\rm{Density}}\;\left( D \right)} = \cr& {{\rm{Total}}\;{\rm{number}}\;{\rm{of}}\;{\rm{individuals}}\;{\rm{of}}\;{\rm{a}}\;{\rm{species}}\;{\rm{in}}\;{\rm{all}}\;{\rm{quadrats}}} \over \left( {\rm{Total}}\;{\rm{number}}\;{\rm{of}}\;{\rm{quadrats}}\;{\rm{studied}} \right)\; \times \;\left( {\rm{Area}}\;{\rm{in}}\;{{\rm{m}}^{2\;}}{\rm{in}}\;{\rm{each}}\;{\rm{quadrat}} \right) }}$
 $\small{\eqalign{& {\rm{Frequency}}\;\left( F \right) = \cr & {{{\rm{Presence}}\;\left( 1 \right)\;{\rm{or}}\;{\rm{absence}}\;\left( 0 \right)\;{\rm{of}}\;{\rm{the}}\;{\rm{species}}\;{\rm{any}}\;{\rm{of}}\;{\rm{the}}\;{\rm{quadrat}}} \over {{\rm{Number}}\;{\rm{of}}\;{\rm{field}}\;{\rm{surveyed}}}}\; \times \;100}}$
 $\small{{\rm{Uniformity}}\;\left( U \right) = {{{\rm{Number}}\;{\rm{of}}\;{\rm{quadrats}}\;{\rm{in}}\;{\rm{which}}\;{\rm{a}}\;{\rm{species}}\;{\rm{occured}}} \over {{\rm{Total}}\;{\rm{number}}\;{\rm{of}}\;{\rm{quadrats}}\;{\rm{studied}}}}\; \times \;100}$
Abundance was calculated following Moeini et al. (Reference Moeini, Baghestani and Mashhadi2008) as in Equation 4:
 ${\rm{Abundance}}\;{\rm{index}} = D + F + U$
After which, relative density, frequency, uniformity, and abundance were computed following Thomas (Reference Thomas1985), as described in Equations 5 to 8:
 ${\rm{Relative}}\;{\rm{density}}\;\left( {{\rm{RD}}} \right) = \left( {{{{\rm{Density}}\;{\rm{of}}\;{\rm{a}}\;{\rm{species}}} \over {{\rm{Density}}\;{\rm{of}}\;{\rm{all}}\;{\rm{species}}\;}}} \right)\; \times \;100$
 ${\rm{Relative}}\;{\rm{frequencey}}\;\left( {{\rm{RF}}} \right) = \left( {{{{\rm{Frequency}}\;{\rm{of}}\;{\rm{a}}\;{\rm{species}}} \over {{\rm{Frequency}}\;{\rm{of}}\;{\rm{all}}\;{\rm{species}}\;}}} \right) \times 100$
 ${\rm{Relative}}\;{\rm{uniformity}}\;\left( {{\rm{RA}}} \right) \!= \! \left( {{{{\rm{Abundance}}\;{\rm{of}}\;{\rm{a}}\;{\rm{species}}} \over {{\rm{Abundance}}\;{\rm{of}}\;{\rm{all}}\;{\rm{species}}\;}}} \right) \times 100$
 ${\rm{Relative}}\;{\rm{abundance}}\;\left( {{\rm{RA}}} \right) = \left( {{\rm{RD}} + \;{\rm{RF}} + \;{\rm{RU}}} \right)$
Species abundance refers to the number or frequency of individuals of a weed species within an area, while RA reflects what proportion (or percentage) of the total weed population is made up of a particular species (Nkoa et al. Reference Nkoa, Owen and Swanton2015).
Following Magurran (Reference Magurran1988), weed richness was computed using Equation 9:
 ${\rm{Weed}}\;{\rm{community}}\;{\rm{richness}} = \left( {{{{\rm{Number}}\;{\rm{of}}\;{\rm{species}}\;{\rm{identified}}\;} \over {5\;{\rm{m}}{\;^2}}}} \right)$
Species diversity was computed by comparing species numbers and diversity indices. The Shannon diversity index value (H′) was calculated for each farmer’s field as in Equation 10 (Shannon and Weaver Reference Shannon and Weaver1963):
 $H' = \; - \sum {\left\lceil {{\rm{p}}i\; \times \ln \left( {{\rm{p}}i} \right)} \right\rceil }$
where pi is the proportion of total individuals in the ith species in the sampled area, and ln denotes natural logarithm. Finally, a species evenness index (J) was calculated following Pielou (Reference Pielou1971), as per Equation 11:
 $J = \;{{H'} \over {\ln\left( S \right)}}$
where H′ is Shannon-Weiner diversity, and S is the total number of species in a sample.
Data Analysis
The data were first analyzed using a combined ANOVA with restricted maximum likelihood to assess the effects of year, site (Jhenaidah and Rajbari in Bangladesh; Bardiya and Dang in Nepal), cropping system, and weed management practices (herbicide application vs. no herbicide application), as well as their interactions on weed density, weed biomass, weed richness, diversity index, and evenness index values. The analysis showed a significant effect of the year (p < 0.05) on most of the measured variables, indicating considerable variability between years. To address the variability in the data and enhance interpretability, we analyzed the data separately for each year and each site. We conducted a two-factor ANOVA, with cropping system and weed management as fixed effects, along with their interaction. The farmer fields were treated as random effects in the combined model to account for spatial variability.
Before ANOVA, a Shapiro-Wilk normality test was performed for all data, and outliers were removed from the database. Where significant differences were identified, mean separation was performed using Tukey’s honestly significant difference (HSD) test at the 5% probability level. The ANOVA and t-test were performed using statistical software JMP Pro 13 (SAS Institute, Cary, NC, USA). Linear regression was performed using SigmaPlot (SYSTAT v. 15, Grafiti, Palo Alto, CA, USA) to determine the relationship between weed and rice biomass.
To identify potential groupings of weed species, principal component analysis (PCA) biplot ordination (Kenkel et al. Reference Kenkel, Derksen, Thomas and Watson2002) was conducted using JMP Pro 13. However, ordination did not reveal which environmental variables influenced species groupings. Therefore, to examine the effects of cropping system nominal variables, weed management options, land type, soil texture, and water stagnation on weed species composition, canonical correspondence analysis (CCA) was applied separately for each site and year (ter Braak 1986), as this method detects patterns of variation in species data that can be subsequently explained by environmental variables (Kent et al. Reference Kent, Johnson and Becker2001). The environmental variables in our study included ordinal variables such as land type, soil type, and water stagnation level. CCA was performed using PAST software (PAleontological STatistics v. 4.13; Hammer et al. Reference Hammer, Harper and Ryan2001). Results were visualized as species–environment biplots with scaling focused on interspecies distances. Nominal environmental variables were plotted at the centroid of the study districts belonging to each class.
Results and Discussion
Weed Density, Biomass, Richness, and Weed Diversity
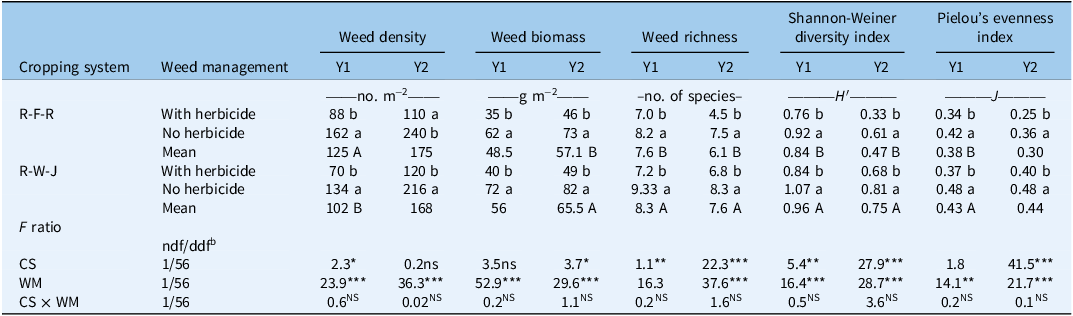
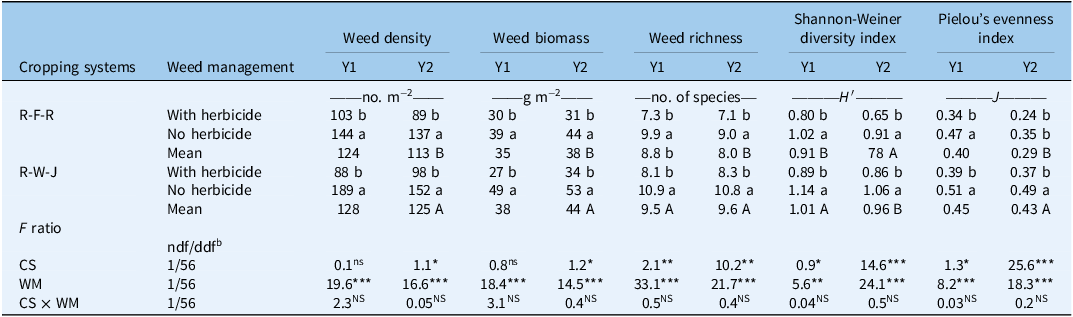
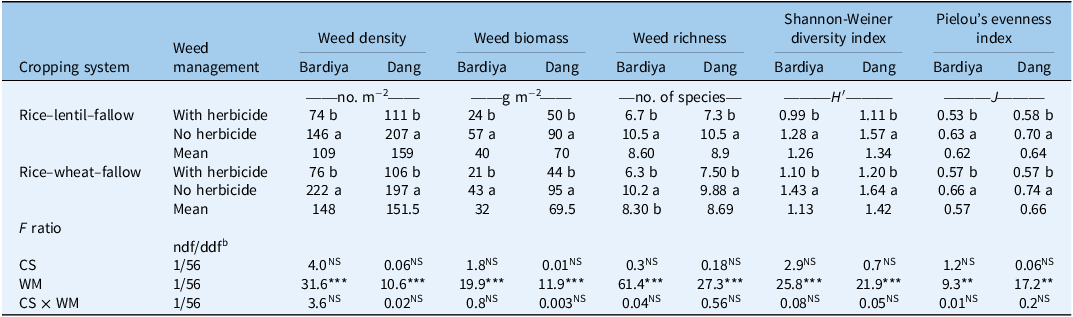
Weed management significantly influenced weed density, biomass, species richness, weed species diversity, and evenness across cropping systems and years in both countries (Tables 1 to 3). Fields treated with herbicides consistently showed lower weed density, biomass, richness, diversity, and evenness than untreated fields, consistent with Albrecht et al. (Reference Albrecht, Cambecèdes, Lang and Wagner2016), who reported marked declines in weed diversity associated with herbicide use. Similar patterns were reported by Légère et al. (Reference Légère, Stevenson and Benoit2005), who found that management practices, including herbicide type and efficacy, strongly shape weed diversity indices. Weed diversity is also determined by two main components: species richness and species evenness (Vahamidis et al. Reference Vahamidis, Chachalis, Akrivou, Karanasios, Ganopoulou, Argiri, Mandoulaki, Hatzigiannakis, Arampatzis, Panagopoulos, Mantzouni and Markellou2024). In our study, the lower weed diversity observed in herbicide-treated fields was associated with reductions in both richness and evenness indices (Tables 1 to 3). These findings are consistent with those of Mayerová et al. (Reference Mayerová, Mikulka and Soukup2018), who reported that herbicides can influence weed species richness and that lower diversity was found in the herbicide treatments.
Weed density, weed biomass, weed richness, Shannon-Weiner diversity index, and Pielou’s evenness index as influenced by cropping system (CS) and weed management (WM), including with and without preemergence herbicide, across years in rice–fallow–rice (R-F-R) and rice–wheat–jute (R-W-J) rotations, Jhenaidah District in Bangladesh. a

a Y1, 2016; Y2, 2019. Values are least square means (LSMeans). Any two means with different lowercase letters for any parameter in a column indicate significantly different for weed management options across cropping systems at a 5% level of probability based on Tukey’s honestly significant difference (HSD) test; any two means with different uppercase letters for any parameter in a column indicate significantly different for cropping systems across weed management option at a 5% level of probability based on Tukey’s HSD test. NS, nonsignificant. Asterisks indicate significance levels at ***0.1%; **1%; and *5%.
b ndf/ddf, numerator degrees of freedom/denominator degrees of freedom.
In Bangladesh, crop rotation systems significantly influenced weed species richness, diversity index, and evenness index (Tables 1 and 2). The rice–wheat–jute system consistently showed higher values than the rice–fallow–rice system, whereas weed density and biomass responded inconsistently. In Nepal, weed density, biomass, species richness, and diversity and evenness indices were higher in Dang than in Bardiya, while crop rotation systems did not significantly affect weed density, biomass, or diversity indices (Table 3).
Weed density, weed biomass, weed richness, Shannon-Weiner diversity index, and Pielou’s evenness index as influenced by cropping systems (CS) and weed management (WM), including with and without preemergence herbicide, in rice–fallow–rice (R-F-R) and rice–wheat–jute (R-W-J), Rajbari District in Bangladesh. a

Table 2. Long description
The table presents data on weed density, weed biomass, weed richness, Shannon-Weiner diversity index, and Pielou’s evenness index as influenced by cropping systems (CS) and weed management (WM), including with and without preemergence herbicide, in rice-fallow-rice (R-F-R) and rice-wheat-jute (R-W-J) systems in Rajbari District, Bangladesh. The table has 12 rows and 11 columns. Column headers are: Cropping systems, Weed management, Weed density (Y1, Y2), Weed biomass (Y1, Y2), Weed richness (Y1, Y2), Shannon-Weiner diversity index (Y1, Y2), and Pielou’s evenness index (Y1, Y2). Row labels include different cropping systems and weed management practices. Row 1: Cropping systems, Weed management, Weed density, Weed biomass, Weed richness, Shannon-Weiner diversity index, Pielou’s evenness index. Row 2: R-F-R, With herbicide, 103 b, 89 b, 30 b, 31 b, 7.3 b, 7.1 b, 0.80 b, 0.65 b, 0.34 b, 0.24 b. Row 3: R-F-R, No herbicide, 144 a, 137 a, 39 a, 44 a, 9.9 a, 9.0 a, 1.02 a, 0.91 a, 0.47 a, 0.35 b. Row 4: R-F-R, Mean, 124, 113 B, 35, 38 B, 8.8 b, 8.0 B, 0.91 B, 78 A, 0.40, 0.29 B. Row 5: R-W-J, With herbicide, 88 b, 98 b, 27 b, 34 b, 8.1 b, 8.3 b, 0.89 B, 0.86 b, 0.39 b, 0.37 b. Row 6: R-W-J, No herbicide, 189 a, 152 a, 49 a, 53 a, 10.9 a, 10.8 a, 1.14 a, 1.06 a, 0.51 a, 0.49 a. Row 7: R-W-J, Mean, 128, 125 A, 38, 44 A, 9.5 A, 9.6 A, 1.01 A, 0.96 B, 0.45, 0.43 A. Row 8: F ratio, ndf/ddfb, 1/56, 1/56, 1/56, 1/56, 1/56, 1/56, 1/56, 1/56, 1/56, 1/56. Row 9: CS, 0.1ns, 1.1*, 0.8ns, 1.2*, 2.1**, 10.2**, 0.9*, 14.6***, 1.3*, 25.6***. Row 10: WM, 19.6***, 16.6***, 18.4***, 14.5***, 33.1***, 21.7***, 5.6**, 24.1***, 8.2***, 18.3***. Row 11: CS x WM, 2.3NS, 0.05NS, 3.1NS, 0.4NS, 0.5NS, 0.4NS, 0.04NS, 0.5NS, 0.03NS, 0.2NS.
a Y1, 2016; Y2, 2019. Any two means with different lowercase letters for any parameter in a column indicate significantly different for weed management options across cropping systems at a 5% level of probability; any two means with different uppercase letters for any parameter in a column indicate significantly different for cropping systems across weed management option at a 5% level of probability. NS, nonsignificant. Asterisks indicate significance levels at ***0.1%; **1%; and *5%.
b ndf/ddf, numerator degrees of freedom/denominator degrees of freedom.
Weed density, weed biomass, rice biomass, weed richness, Shannon-Weiner diversity index, and Pielou’s evenness index as influenced by cropping systems (CS) and weed management (WM), including with and without preemergence herbicide options in Nepal in 2019. a

a Any two means with different lowercase letters for any parameter in a column indicate significantly different weed management options across cropping systems at a 5% probability level. NS, nonsignificant. Asterisks indicate significance levels at ***0.1%; **1%; and *5%.
b ndf/ddf, numerator degrees of freedom/denominator degrees of freedom.
Weed diversity was significantly influenced by cropping systems in Bangladesh but not in Nepal, reflecting differences in land type, hydrology, and associated management practices. In Bangladesh, rice–wheat–jute systems are commonly established on medium-high to medium-low land with greater variation in seasonal flooding, soil moisture, and crop sequencing than rice–fallow–rice systems (Nasim et al. Reference Nasim, Shahidullah, Saha, Muttaleb, Aditya, Ali and Kabir2018), which our data suggest contributes to stronger contrasts in weed communities. In Nepal, lentil and wheat fields in the Terai generally occur on comparable topography with similar soil texture and water regimes, resulting in limited differentiation in weed diversity between rice–wheat and rice–lentil systems. These patterns indicate that crop rotation alone does not strongly structure weed diversity; instead, interactions among land characteristics, water conditions, and management practices appear to exert greater influence on weed community composition.
Our findings on cropping systems align with those of Adeux et al. (Reference Adeux, Yvoz, Biju-Duval, Cadet, Farcy, Fried, Guillemin, Meunier, Munier-Jolain, Petit and Cordeau2022), who reported that crop diversification alone may not alter weed diversity, as outcomes depend on land type, tillage, and crop choice. Consistent with this, Nguyen and Liebman (Reference Nguyen and Liebman2022) showed that weed community composition is closely linked to the crops grown and their associated management practices. Cropping systems also exert influence on soil fertility, moisture, and pH, which shape weed communities by favoring species adapted to specific conditions (Kovács et al. Reference Kovács, Dorner, Csík and Zalai2023; Naeem et al. Reference Naeem, Farooq and Hussain2022; Salahin et al. Reference Salahin, Alam, Shil, Mondol, Alam, Kobeasy, Gaber and Ahmed2022). Patterns of soil disturbance further influence these dynamics, as Nichols et al. (Reference Nichols, Verhulst, Cox and Govaerts2015) observed that frequent tillage is associated with early successional weeds, whereas reduced disturbance is associated with later successional species, contributing to differences in overall weed diversity.
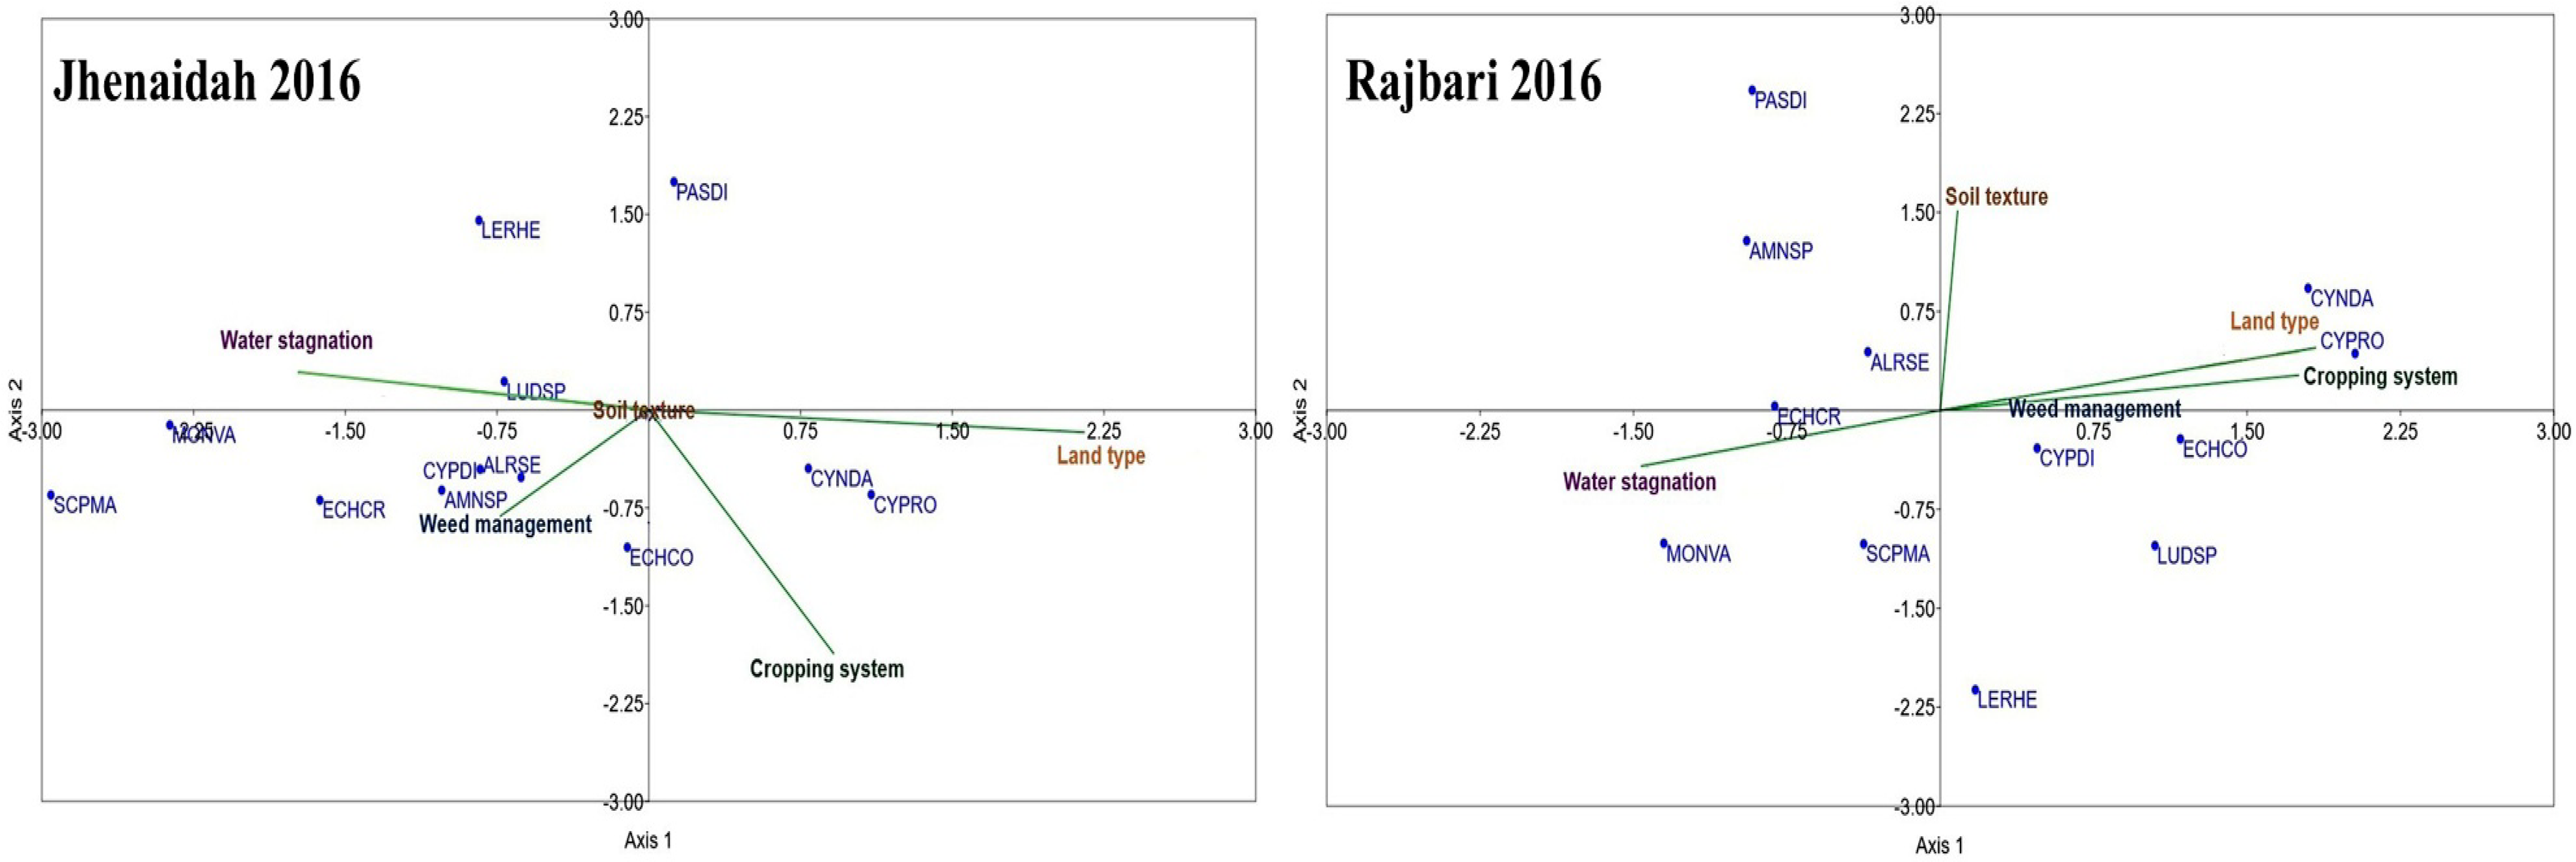
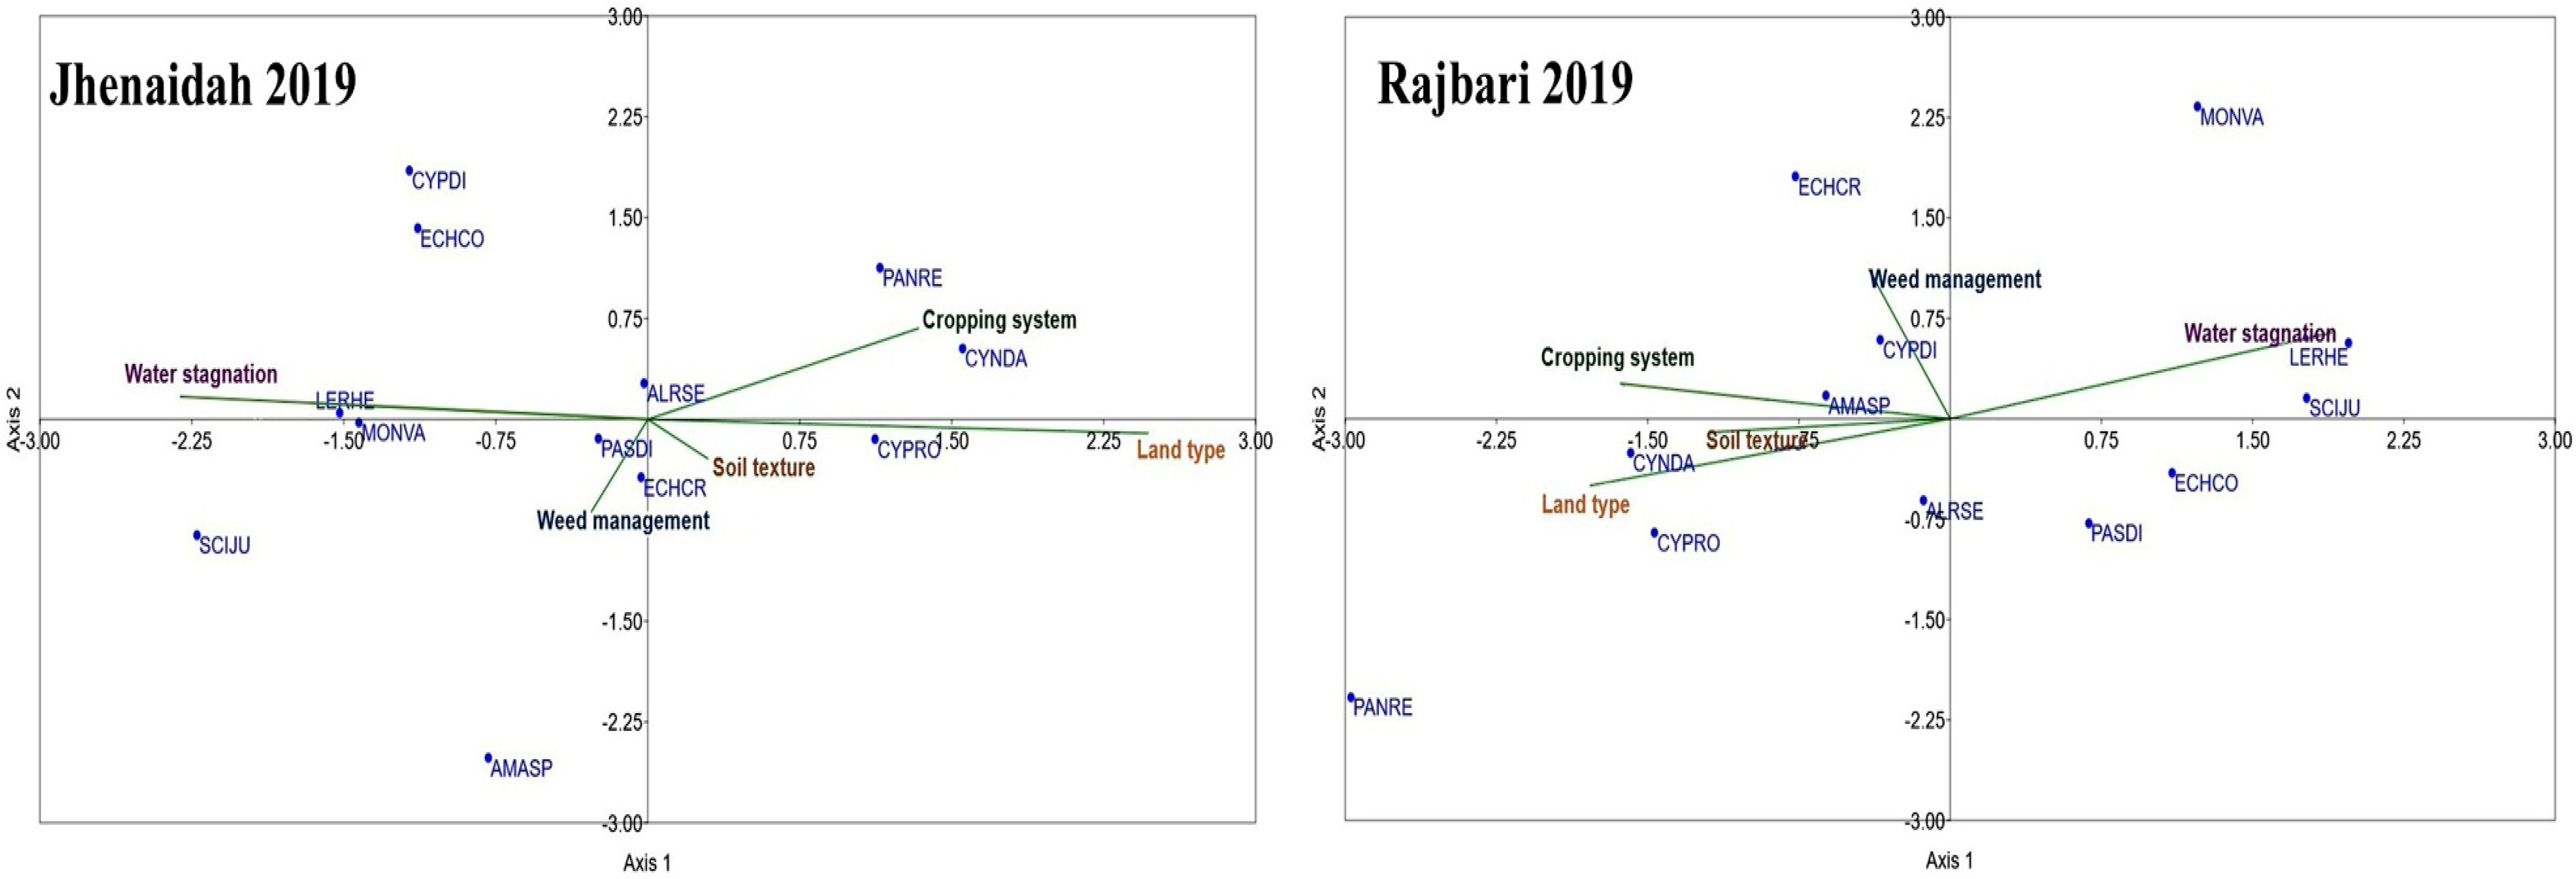
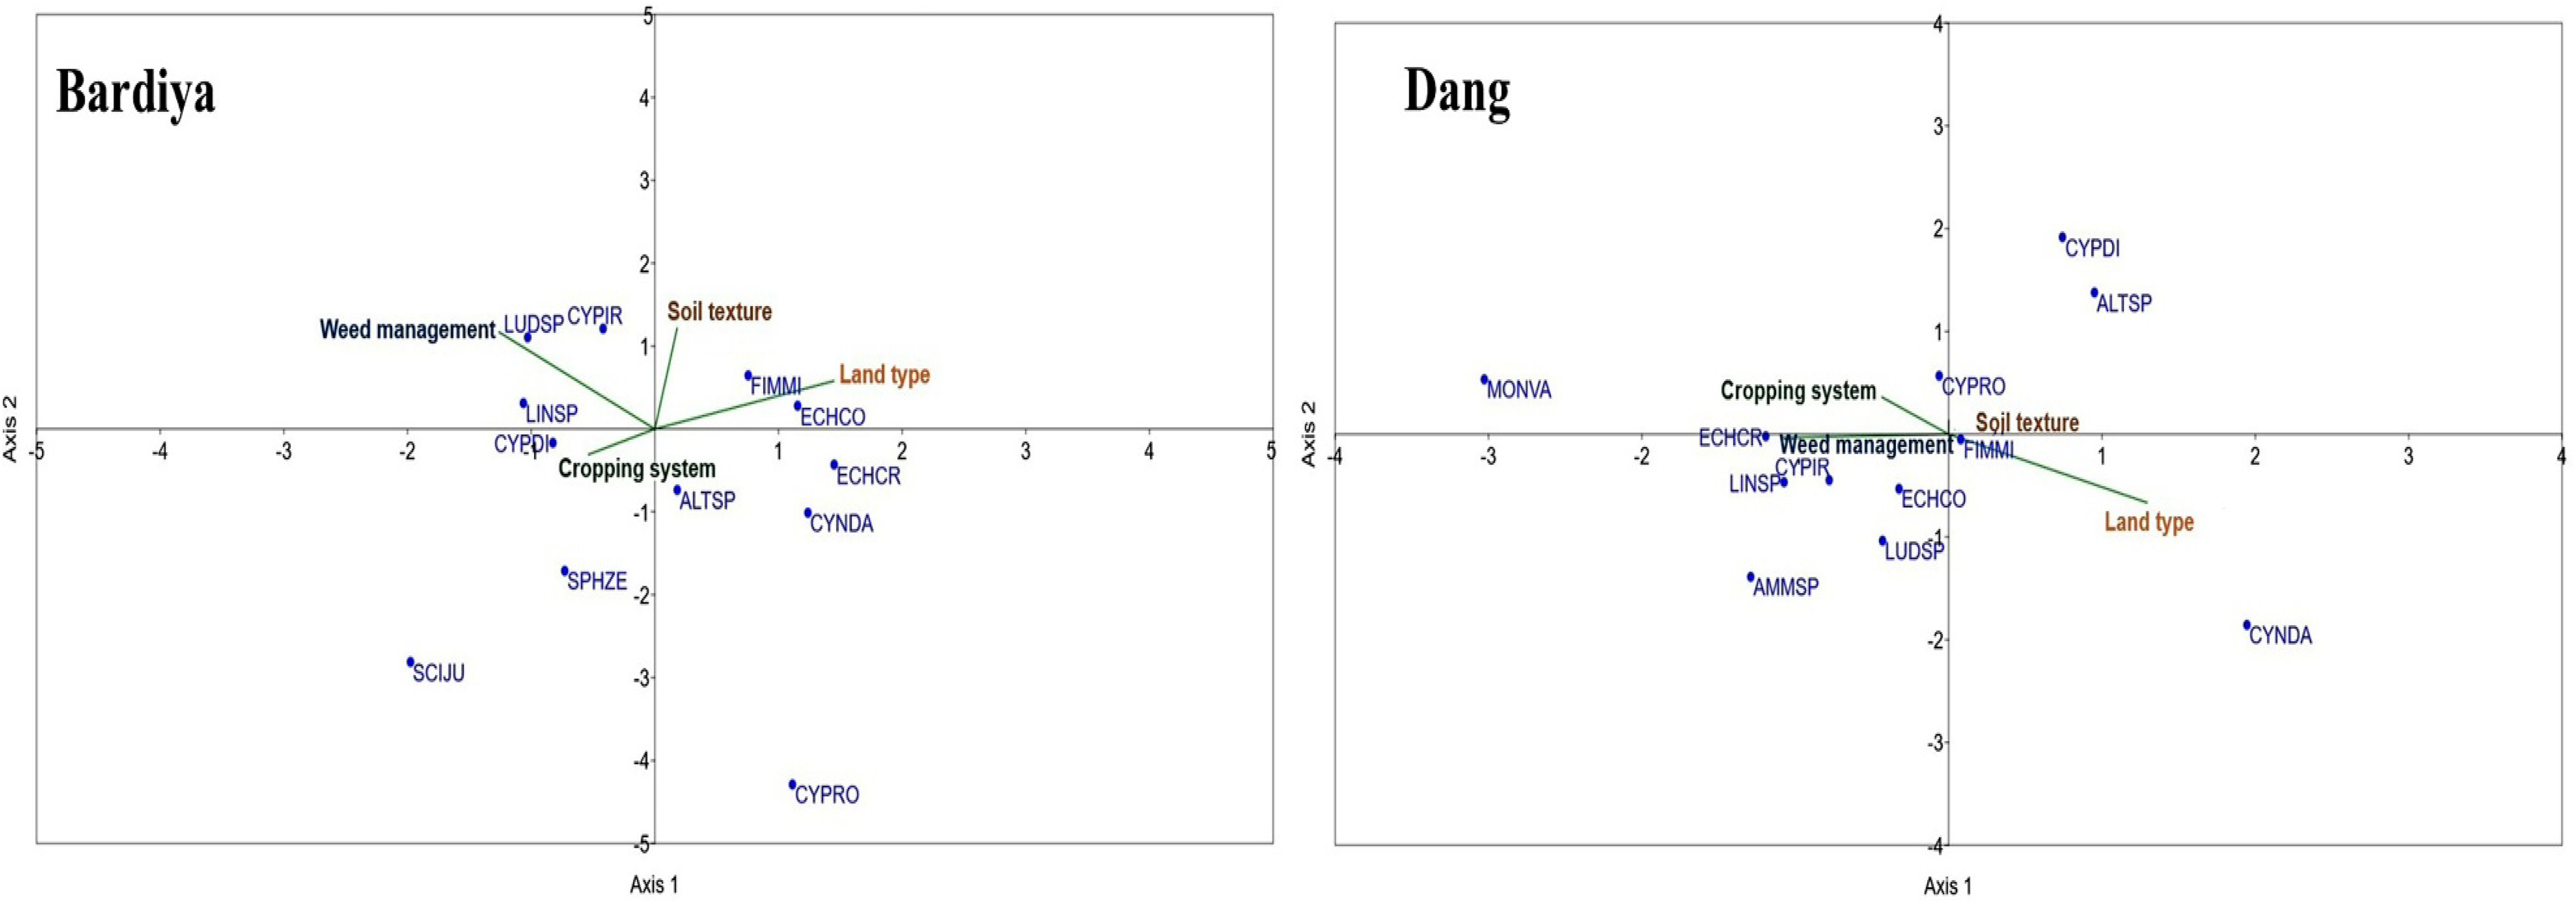
To examine how weed species respond to key environmental factors, including land type, soil texture, and flooding, as well as cropping systems and weed management strategies, we conducted CCA (Figures 2 to 4). The CCA ordination diagrams illustrate relationships among weed species, environmental variables, and weed management across sites and years. As described by ter Braak (1986), CCA extends weighted averaging ordination and provides an effective approach for arranging species patterns in relation to measured environmental variation. The length of the vectors of the CCA plot represents the strength of the relationship between explanatory variables and species distribution, with longer vectors indicating a stronger influence (Figures 2 to 4). Flooding regime, land type, and cropping systems appear to be the most influential determinants of weed community composition in Bangladesh (Figures 2 and 3), and land type and weed management in Nepal (Figure 4).
Canonical correspondence analysis (CCA) of weed species data in 2016 in Jhenaidah and Rajbari districts, Bangladesh. Nominal environmental variables are land type (1 = high, 2 = medium, 3 = medium-low), soil texture (1 = silty, 2 = clay, 3 = clay loam), maximum water stagnation levels during the cropping season (1 = 0–10 cm, 2 = 11–30 cm, 3 = 31–50 cm, 4 = >50 cm), cropping system (rice–fallow–rice, rice–wheat–jute), weed management option (herbicide use, no herbicide use). Highland: no water accumulation; medium land: water accumulates and remains flooded for less than a month; lowland: water accumulates and remains flooded for more than a month. ALRSE: Alternanthera sessilis; AMNSP: Ammannia spp.; CYNDA: Cynodon dactylon; CYPRO: Cyperus rotundus; CYPDI: Cyperus difformis; ECHCO: Echinochloa colona; ECHCR: Echinochloa crus-galli; LERHE: Leersia hexandra; LUDSP: Ludwigia spp.; MONVA: Monochoria vaginalis; PASDI: Paspalum distichum; SCPMA: Bolboschoenus fluviatilis. Some weed species are not visible in the CCA plot, likely due to very low densities that do not demonstrate any distinctiveness among the variables.

Canonical correspondence analysis (CCA) of weed species data in 2019 in Jhenaidah and Rajbari districts, Bangladesh. Nominal environmental variables are land type (1 = high, 2 = medium, 3 = low), soil texture (1 = silty, 2 = clay, 3 = clay loam), water stagnant (1 = 0–10 cm, 2 = 11–30 cm, 3 = 31–50 cm, 4 = >50 cm), cropping systems (rice–fallow–rice, rice–wheat–jute), weed management (with herbicide, without herbicide). Highland: no water accumulation; medium land: water accumulates and remains flooded for less than a month; lowland: water accumulates for more than a month. ALRSE: Alternanthera sessilis; AMNSP: Ammannia spp.; CYNDA: Cynodon dactylon; CYPRO: Cyperus rotundus; CYPDI: Cyperus difformis; ECHCO: Echinochloa colona; ECHCR: Echinochloa crus-galli, LERHE: Leersia hexandra; MONVA: Monochoria vaginalis; PASDI: Paspalum distichum; PANRE: Panicum repens; SCPMA: Scripus maritimus. Some weed species are not visible in the CCA plot, likely due to very low densities that do not demonstrate any distinctiveness among the variables.

Canonical correspondence analysis (CCA) of weed species data in 2019 in Bardiya and Dang districts, Nepal. Nominal environmental variables are land type (1 = high, 2 = medium, 3 = low), soil texture (1 = silty, 2 = clay, 3 = clay loam), cropping systems (rice–wheat, rice–lentil), weed management (with herbicide, without herbicide). Highland: no water accumulation; medium land: water accumulates and remains flooded for less than a month; lowland: water accumulates for more than a month. ALTSP: Alternanthera spp.; CYNDA: Cynodon dactylon; CYPDI: Cyperus difformis; CYPIR: Cyperus iria; CYPRO: Cyperus rotundus; ECHCO: Echinochloa colona; ECHCR: Echinochloa crus-galli; FIMMI: Fimbristylis miliacea; LINSP: Lindernia spp.; LUDSP: Ludwigia spp.; MONVA: Monochoria vaginalis; SPHZE: Sphenoclea zeylanica; SCIJU: Schoenoplectiella juncoides. Some weed species are not visible in the CCA plot, likely due to very low densities that do not demonstrate any distinctiveness among the variables.

In Bangladesh, yellow nutsedge (Cyperus rotundus L.), and bermudagrass [Cynodon dactylon (L.)] were more associated with cropping systems and land type (Figures 2 and 3).
River bulrush [Bolboschoenus fluviatilis (Torr.) Soják; syn.: Scirpus maritimus (L.) var. fluviatilis Torr.], variable flatsedge (Cyperus difformis L.), southern cutgrass (Leersia hexandra Sw.), M. vaginalis, E. crus-galli, and southern cutgrass (Leersia hexandra Sw.) to water stagnation. Jungle rice [Echinochloa colona (L.) Link], variable flatsedge (Cyperus difformis L.), and E. crus-galli with weed management (Figures 2 and 3).
In Nepal, joyweeds (Alternanthera spp.) and C. difformis were associated with crop rotation system (Figure 4). F. littoralis were associated with crop rotation system (Figure 4), while F. littoralis, C. dactylon, E. crus-galli, and E. colona were associated with land type. Finally, E. colona, Schoenoplectiella juncoides (Roxb.), E. crus-galli, pimpernels (Lindernia spp.), and C. iria were associated with weed management practices (Figure 4).
In general, the ordination results revealed that many weed species are strongly linked to specific environmental conditions, underscoring how these factors shape weed community composition across different sites.
Weed Species Abundance and Dominance
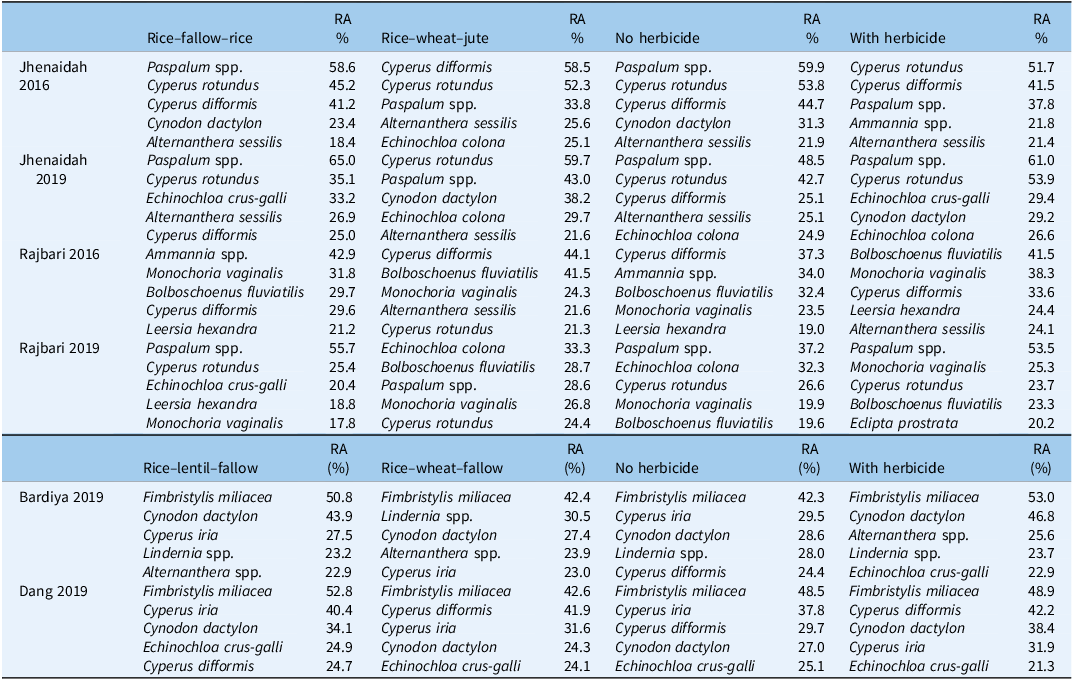
Data on weed species density, frequency, uniformity, abundance index, relative density, relative frequency, relative uniformity, and relative abundance across years, sites, cropping systems, and weed management practices are provided in Supplementary Tables 1 to 12 (Supplementary Tables 1 to 8 for Bangladesh and 9 to 12 for Nepal). In Bangladesh, 22 weed species were recorded across both sites, except in Jhenaidah in 2016, where 21 species were observed (Supplementary Tables 1 to 8). In Nepal, 20 species were documented in Banke and 15 in Dang (Supplementary Tables 9 to 12). Although species composition remained generally similar across sites, weed management practices, and cropping systems in Bangladesh, the species density, frequency, uniformity, abundance index, and relative abundance showed substantial variation. Considering relative abundance, the five dominant weed species for each year, location, cropping system, and weed management option are shown in Table 4. Dominant species varied by year, site, cropping system, and weed management strategy.
Five dominant weed species across cropping systems and weed management options in Bangladesh and Nepal.

RA, relative abundance. RA = Relative density (RD) + relative frequency (RF) + relative uniformity (RU).
We found that cropping systems and weed management practices significantly influenced weed species diversity and abundance, with these effects shaped by site-specific conditions. Differences in field topography and soil characteristics, including fertility, texture, moisture, pH, and organic matter, can create conditions that favor certain weed species over others (Fried et al. Reference Fried, Norton and Reboud2008). Weed communities are further shaped by edaphic and biological factors such as soil structure, nutrient availability, moisture status, crop type, weed control strategies, and field management history, which together influence patterns of species dominance and persistence (Fried et al. Reference Fried, Norton and Reboud2008; Hakim et al. Reference Hakim, Juraimi, Ismail, Hanafi and Selamat2010).
In Bangladesh, weed diversity was significantly influenced by crop rotation system, a pattern not observed in Nepal. Crop rotations influence weed communities, likely through differences in competitiveness, allelopathic effects, and nutrient demands that may suppress some species while favoring others (Hofmeijer et al. Reference Hofmeijer, Melander, Salonen, Lundkvist, Zarina and Gerowitt2020). Management practices within cropping systems and water management further shape weed composition, together with seasonal variation, tillage operations, weed seedbanks, control strategies, and fertilizer use (Kraehmer et al. Reference Kraehmer, Jabran, Mennan and Chauhan2016; Lal et al. Reference Lal, Gautam, Raja, Nayak, Shahid, Tripathi, Bhattacharyya, Mohanty, Puri, Kumar and Panda2014; Sharma et al. Reference Sharma, Shrestha, Kunwar and Tseng2021; Singh et al. Reference Singh, Kukal, Irmak and Jhala2022).
Relationship between Weed Biomass and Rice Biomass
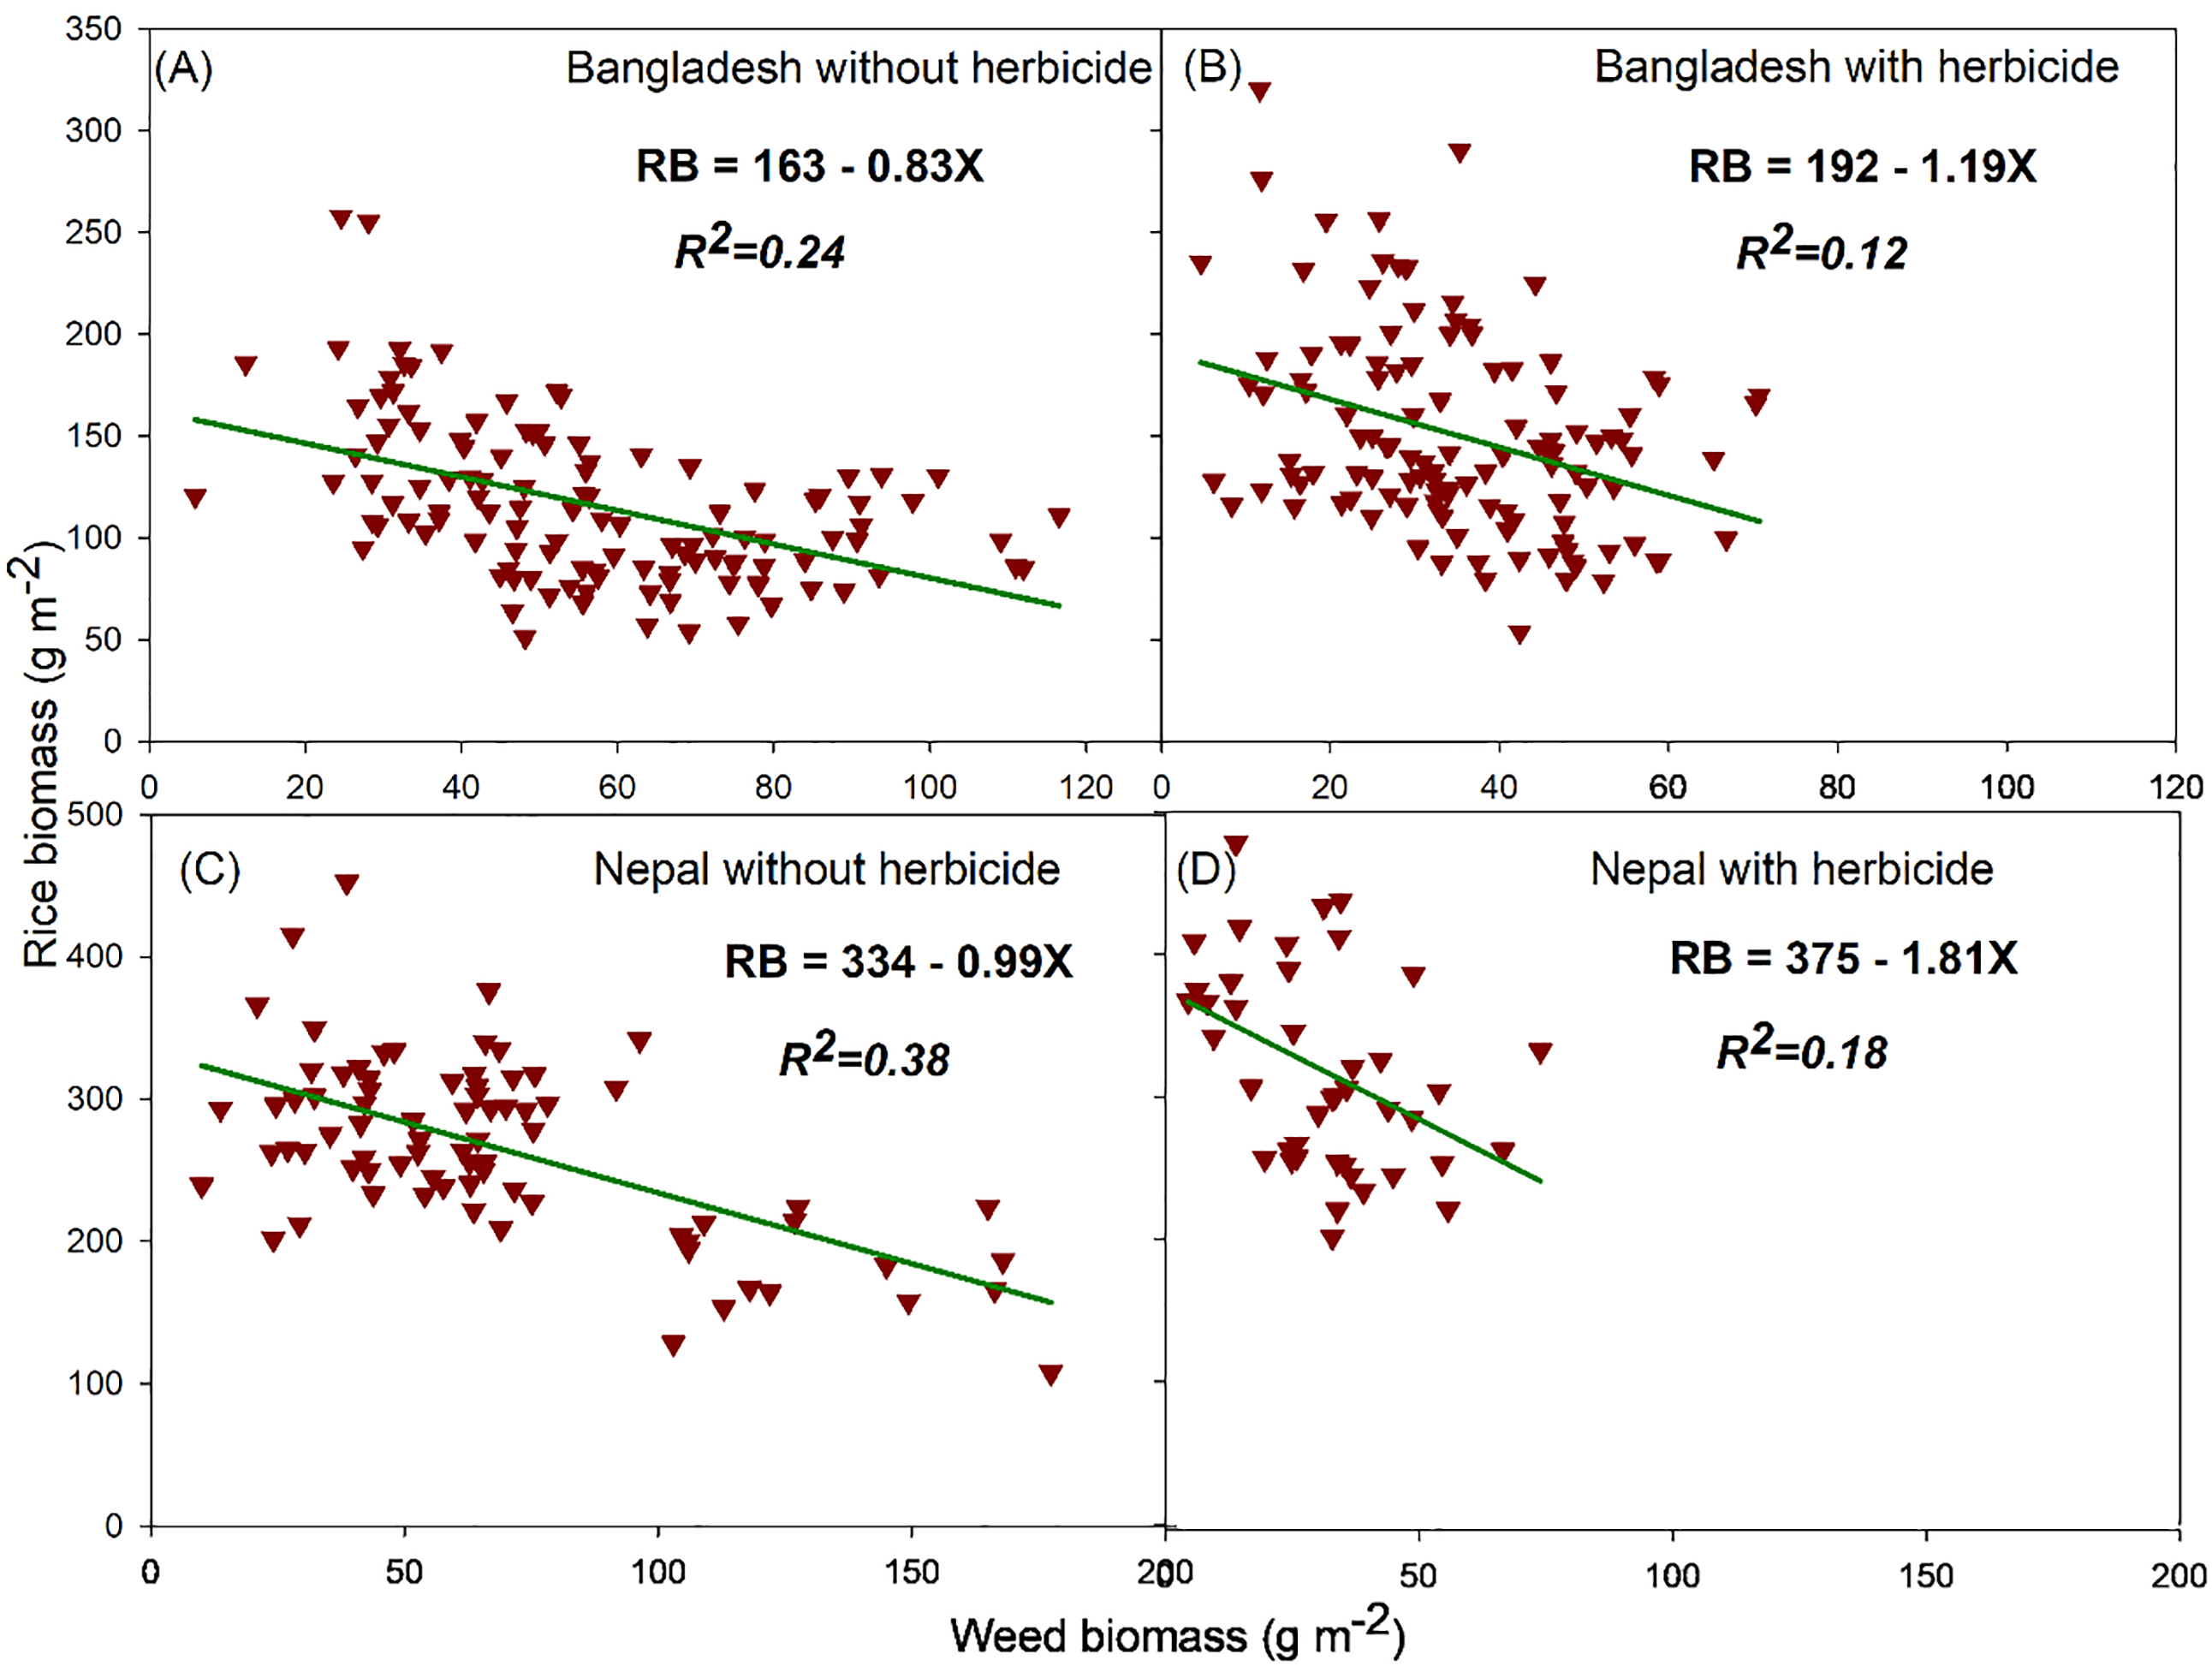
We found a significant negative linear relationship between rice biomass and weed biomass in both countries under both weed management practices (Figure 5). The relationship was stronger in fields without herbicide (Bangladesh: R2 = 0.24; Nepal: R2 = 0.38) compared with herbicide use (Bangladesh: R2 = 0.12; Nepal: R2 = 0.18) in both countries. Without herbicides, weed competition has a stronger negative influence on rice biomass. With herbicide, biomass reduction varied across fields, leading to inconsistent results.
The relationship between rice biomass and weed biomass. (A) Data points are the field data of plots without herbicide of two cropping systems, two trail sites, and 2 yr in Bangladesh; (B) data points are the field data of plots with herbicide of two cropping systems, two trail sites, and 2 yr in Bangladesh; (C) data points are the field data of plots without herbicide of two cropping systems and two trail sites in Nepal; (D) data points are the field data of plots with herbicide of two cropping systems and two trail sites in Nepal. RB, rice biomass.

Figure 5. Long description
Panel A: Scatter plot showing the relationship between rice biomass and weed biomass in Bangladesh without herbicide. The x-axis represents weed biomass in grams per square meter, ranging from 0 to 120. The y-axis represents rice biomass in grams per square meter, ranging from 0 to 350. The equation RB = 163 - 0.83X and R-squared value of 0.24 are displayed. Data points are scattered with a slight negative trend. Panel B: Scatter plot showing the relationship between rice biomass and weed biomass in Bangladesh with herbicide. The x-axis represents weed biomass in grams per square meter, ranging from 0 to 120. The y-axis represents rice biomass in grams per square meter, ranging from 0 to 350. The equation RB = 192 - 1.19X and R-squared value of 0.12 are displayed. Data points are scattered with a slight negative trend. Panel C: Scatter plot showing the relationship between rice biomass and weed biomass in Nepal without herbicide. The x-axis represents weed biomass in grams per square meter, ranging from 0 to 200. The y-axis represents rice biomass in grams per square meter, ranging from 0 to 500. The equation RB = 334 - 0.99X and R-squared value of 0.38 are displayed. Data points are scattered with a slight negative trend. Panel D: Scatter plot showing the relationship between rice biomass and weed biomass in Nepal with herbicide. The x-axis represents weed biomass in grams per square meter, ranging from 0 to 200. The y-axis represents rice biomass in grams per square meter, ranging from 0 to 500. The equation RB = 375 - 1.81X and R-squared value of 0.18 are displayed. Data points are scattered with a slight negative trend.
Farmer Identification of Troublesome Weed Species
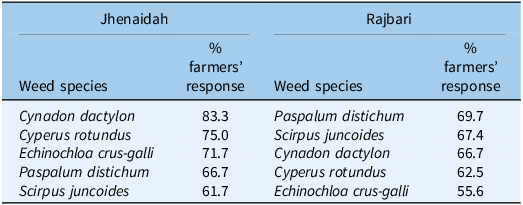
Farmers identified challenging weed species visually by selecting those they found most difficult to manage using a poster depicting each species at vegetative and reproductive stages. The top five troublesome weed species typically not controlled by herbicide application that farmers identified are presented in Table 5. In Jhenaidah in Bangladesh, C. dactylon and C. rotundus were most frequently reported, whereas in Rajbari, knotgrass (Paspalum distichum L.) and S. juncoides were of greatest concern. These observations are consistent with those of Ahmed et al. (Reference Ahmed, Kumar, Alam, Dewan, Bhuiyan, Miajy, Saha, Singh, Timsina and Krupnik2021b), who reported limited herbicide control of these species. Although farmers commonly relied on manual weeding to address problematic weeds, weed management practices differed markedly by site, year, and location.
Five dominant troublesome weed (usually not controlled by the herbicide) species in Jhenaidah and Rajbari, Bangladesh.

Farmers’ Weed Management Practices
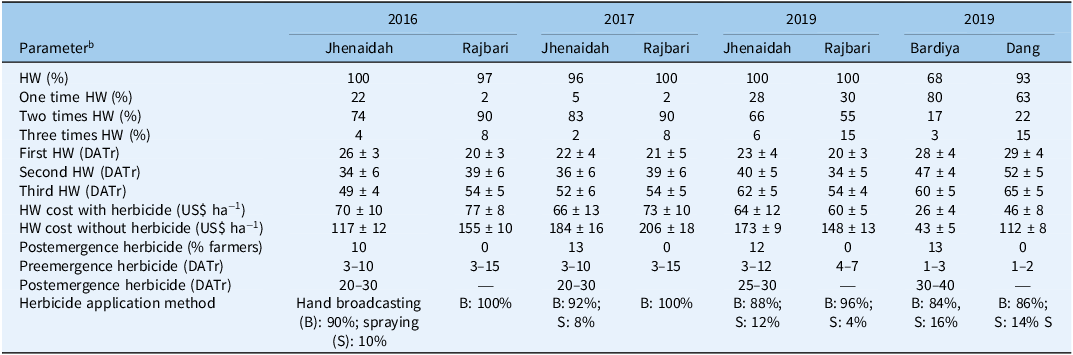
In Bangladesh, more than 95% of farmers performed at least one hand weeding (Table 5), compared with more than 65% in Nepal. A higher proportion of farmers in Rajbari than in Jhenaidah conducted hand weeding two or three times, while in Nepal, 17% to 22% of farmers performed two hand weedings and 3% to 15% performed three. The first hand weeding typically occurred 17 to 27 d after sowing in Bangladesh and around 24 to 33 d in Nepal, with associated costs ranging from US$55 to US$85 with herbicide and US$105 to US$220 without herbicide in Bangladesh, and US$20 to US$52 and US$40 to US$120, respectively, in Nepal. Postemergence herbicide use remains limited, with 10% to 13% of farmers in Jhenaidah applying these products and almost none in Rajbari, while in Nepal, 13% of farmers in Bardiya apply postemergence herbicide and none do in Dang. Across both countries, most farmers apply herbicides by the hand-broadcasting method, with smaller shares by the spraying method, including 8% to 12% in Bangladesh and 14% to 16% in Nepal (Table 6).
Descriptive statistical information on farmers’ weed management practices (survey data) in Jhenaidah and Rajbari in Bangladesh and Bardiya and Dang in Nepal. a

Table 6. Long description
The table presents data on farmers’ weed management practices in Jhenaidah and Rajbari in Bangladesh, and Bardiya and Dang in Nepal for the years 2016, 2017, and 2019. The table has 12 columns and 11 rows, including headers and row labels. The columns are labeled with the years and regions: 2016 Jhenaidah, 2016 Rajbari, 2017 Jhenaidah, 2017 Rajbari, 2019 Jhenaidah, 2019 Rajbari, 2019 Bardiya, and 2019 Dang. The rows are labeled with different parameters such as HW (%), One time HW (%), Two times HW (%), Three times HW (%), First HW (DATr), Second HW (DATr), Third HW (DATr), HW cost with herbicide (US$ ha⁻1), HW cost without herbicide (US$ ha⁻1), Postemergence herbicide (% farmers), Preemergence herbicide (DATr), Postemergence herbicide (DATr), and Herbicide application method. Each cell contains specific values related to the parameters and regions. Notable trends include variations in the percentage of farmers performing one, two, or three hand weedings, the days after transplanting for each hand weeding, the costs associated with hand weeding with and without herbicide, and the methods of herbicide application.
a The number of farmers is 60 for each location.
b DATr, days after transplanting; HW, hand weeding.
Our results indicate substantial gaps in farmer knowledge related to improved weed management in both countries. Many farmers continue to rely on labor-intensive manual weeding and commonly apply preemergence herbicides by hand broadcasting rather than spraying, which is associated with lower control efficiency (Ahmed and Alam Reference Ahmed and Alam2024). Preemergence herbicides applied before weed seed germination can be effective during early rice growth stages when crops are most sensitive to competition (Ahmed and Chauhan Reference Ahmed and Chauhan2014), yet improper application may lead to poor control, crop injury, or environmental risks (Beckie Reference Beckie2006). Weed control outcomes also reflect the interaction of herbicide mode of action, target species, application timing and dosage, and environmental conditions, and inadequate alignment of these factors often results in high costs and inconsistent control (Ahmed and Alam Reference Ahmed and Alam2024; Kudsk and Streibig Reference Kudsk and Streibig2003). Combining chemical approaches with complementary cultural, mechanical, or preventive practices is therefore more commonly associated with more reliable management outcomes (Ahmed et al. Reference Ahmed, Kumar, Alam, Dewan, Bhuiyan, Miajy, Saha, Singh, Timsina and Krupnik2021b; Chikowo et al. Reference Chikowo, Faloya, Petit and Munier-Jolain2009).
This study provided a comparative, field-based assessment of weed community composition, diversity, and dominance in rice-based cropping systems of Bangladesh and Nepal using ecological measurements and farmer diagnostics. In Bangladesh, weed species richness, diversity, and evenness varied with cropping system, land type, and weed management regime. In Nepal, weed community structure was shaped mainly by site-specific field conditions rather than by crop rotation alone. Across both countries, the CCA analysis indicated that land type, soil texture, and water stagnation were consistently associated with species distribution, underscoring the role of hydrological and edaphic controls in weed community assembly.
Clear patterns of dominant weed species emerged by location and country. In Bangladesh, species such as C. rotundus, C. dactylon, E. crus-galli, M. vaginalis, B. fluviatilis, and Paspalum spp. dominated depending on site, land type, and water regime. In Nepal, weed communities were characterized by recurring dominance of F. littoralis, C. iria, C. dactylon, E. colona, Lindernia spp., and Alternanthera spp., with shifts in relative abundance across sites rather than complete species turnover. Farmer identification of troublesome weeds closely matched measured dominance patterns, reinforcing the ecological relevance of these species under prevailing management practices.
Weed management regimes had a strong influence on ecological outcomes. Herbicide use was associated with lower weed density, biomass, richness, and evenness, whereas fields managed without herbicides showed stronger negative relationships between weed biomass and rice biomass, highlighting the effect of competition on crop performance. Reduced diversity in herbicide-treated fields suggested selection toward a narrower set of tolerant or escape species. Survey data also showed widespread reliance on broadcast applications of preemergence herbicides, a practice linked with variable control across sites and seasons, indicating that application method and product choice interacted with environmental conditions to shape weed community responses.
Overall, the findings indicated that weed community dynamics in rice-based systems arose from interacting effects of cropping system, hydrology, soil characteristics, and weed management practices rather than from a single driver. The persistence of dominant and problematic species across sites, despite herbicide use, pointed to ecological limits of reliance on chemical control alone. Linking species–environment relationships with farmer knowledge of management constraints provided a sound basis for refining integrated weed management approaches aligned with local field conditions, cropping patterns, and long-term system sustainability in South Asian rice systems.
Supplementary material
To view supplementary material for this article, please visit https://doi.org/10.1017/wsc.2026.10124
Acknowledgments
We are thankful for the support of the donors contributing to the CGIAR Trust Fund (https://www.cgiar.org/funders). The authors would like to thank all the farmers and field technicians who participated in this study.
Funding statement
This study was conducted as part of the Cereal Systems Initiative for South Asia program (https://csisa.org), which is funded by the U.S. Agency for International Development (USAID). Write-up and publication of the paper has been made possible by the CGIAR Scaling for Impact Program (https://www.cgiar.org/cgiar-research-portfolio-2025-2030/scaling-impact). The views expressed in this study are those of the author(s) and do not necessarily reflect the opinions of USAID, CGIAR, or its donors.
Competing interests
The authors declare no conflicts of interest.


 Open access

