Classic studies on electoral participation reported that women were less likely to turn out to vote compared to men (Almond and Verba Reference Almond and Verba1963; Tingsten Reference Tingsten1937; Verba and Nie Reference Verba and Nie1972). Lower turnout rates among women were interpreted as a logical consequence of late female enfranchisement and inequalities in resources (Verba and Nie Reference Verba and Nie1972; Schlozman, Burns and Verba Reference Schlozman, Burns and Verba1994; Norris Reference Norris2002; Mayer Reference Mayer2010). However, gender patterns in voter turnout in established democracies seem to have changed in recent decades. More recent studies (for example, Inglehart and Norris Reference Inglehart and Norris2003; Mayer Reference Mayer2010; Beauregard Reference Beauregard2018) argue either that there are no observable differences in men's and women's likelihood of turning out or that women are slightly more likely to vote than men. A traditional gender gap in voter turnout is still observed in new democracies (Córdova and Rangel Reference Córdova and Rangel2017; Desposato and Norrander Reference Desposato and Norrander2009) and also in Switzerland (Engeli, Ballmer-Cao and Giugni Reference Engeli, Ballmer-Cao and Giugni2006; Stadelmann-Steffen and Koller, Reference Stadelmann-Steffen and Koller2014), where women were enfranchised at the federal level as late as 1971.
Smets and van Ham (Reference Smets and van Ham2013) conducted a meta-analysis of published articles on the individual-level determinants of turnout, and concluded that the effect of gender on the vote is mostly not significant and close to zero. In addition, they find that ‘when gender is found to be significant it is usually women that turn out at higher rates, not men’ (Smets and van Ham Reference Smets and van Ham2013, 348). The current scientific consensus thus holds that men and women turn out to about the same extent.
In this article, we refine these findings and show that it is too early to conclude that the traditional gender gap in voter turnout has vanished. Employing hierarchical regression models and an original dataset integrating individual-level data from the European Election Studies (EES) project, which covers all elections to the European Parliament (EP) that have been held to date, we make three important contributions to the literature.
First, we show the presence of a traditional gender gap in EP elections. This gap has passed largely unnoticed in the scientific literature, even though we show that it has been systematically present and fairly stable since the first direct elections to the EP in 1979.
Secondly, to explain the presence of this gender gap, we draw on classic political science theories that underline the importance of psychological engagement in politics for participation in less mobilizing contexts (Campbell et al. Reference Campbell1960; Campbell Reference Campbell1960; Kostelka, Blais and Gidengil Reference Kostelka, Blais and Gidengil2019). EP elections are typical low-turnout second-order contests (Reif and Schmitt Reference Reif and Schmitt1980) in the sense that they are not held for the main political arena in a country, and ‘Less is at stake’. In such low-stakes elections, turnout is lower, and electoral participation requires higher levels of political interest. We find that when we control for the well-established finding that women are less interested in politics (Thomas Reference Thomas2012), the gender gap in EP turnout even reverses.
Thirdly, having identified political interest as the main culprit, we focus on variation in this – causally proximate – factor to investigate the deep causes of the persistent gender gap in participation in EP elections. Exploring country-level variation in the gender gap in political interest, we find that women's political representation may somewhat reduce the differences between men and women. However, a more powerful predictor of gender differences in political interest is a country's gender culture, which we demonstrate using evidence from two distinct and independent sources. These results have important implications for a better understanding of gender inequalities in political participation.
Gender, Turnout and Second-Order Elections
The earliest publications on gender differences in voter turnout found that women are less likely to vote than men (Almond and Verba Reference Almond and Verba1963; Duverger Reference Duverger1955; Verba and Nie Reference Verba and Nie1972). This finding has been referred to as ‘the traditional gender gap’. This gender gap, however, is by no means conventional wisdom among scholars of turnout and gender. For several decades it has been argued that the gender gap in turnout should not be exaggerated (Norris Reference Norris1991), that the gender gap has diminished or is absent (Bennett and Bennett Reference Bennett and Bennett1991), or that women vote more than men (Inglehart and Norris Reference Inglehart and Norris2003). Summarizing the state of the art on the individual-level determinants of voter turnout, Smets and van Ham (Reference Smets and van Ham2013) conclude that gender differences are essentially zero.
The absence of a gender gap in turnout – or a reversal of the traditional gap (that is, women voting more) – is surprising, because it contrasts with two patterns of persistent gender differences for other variables. First, when studying political interest, political knowledge or other precursors of voter turnout, scholars find that the gender gap in these motivational factors for participation has persisted (Dassonneville and McAllister Reference Dassonneville and McAllister2018; Fraile and Gomez Reference Fraile and Gomez2015; Thomas Reference Thomas2012). Secondly, there is substantial evidence of a gender gap in other institutionalized forms of political participation, such as campaign activities, working for a party or being a member of a party (Beauregard Reference Beauregard2014; Carreras Reference Carreras2017; Marien, Hooghe and Quintelier Reference Marien, Hooghe and Quintelier2010). In summary, while women's position in society has improved – as demonstrated by the growth in women's employment (Fagan, Rubery and Smith Reference Fagan, Rubery and Smith2003) and a reversal of the gender gap in higher education (Schwartz and Han Reference Schwartz and Han2014) – they are still consistently found to be less politically engaged and to participate less in non-institutionalized ways.
We argue here that the gender gap in voter turnout persists, even in established European democracies where gender equality is fairly high. However, the size of the gender gap in voter turnout will depend on the overall level of turnout and the election type (that is, the importance of the election). Building on the work of Kostelka, Blais and Gidengil (Reference Kostelka, Blais and Gidengil2019), we expect to find that women participate less than men in second-order elections, such as EP elections, at which there is ‘less at stake’ (Reif and Schmitt Reference Reif and Schmitt1980, 9) and turnout is generally rather low. When turnout is low, psychological involvement in politics matters more for participation (Campbell et al. Reference Campbell1960; Campbell Reference Campbell1960) and inequalities in voter turnout are stronger. Several studies have reported that social inequalities in participation are greater under low turnout (Armingeon and Schädel Reference Armingeon and Schädel2015; Dassonneville and Hooghe Reference Dassonneville and Hooghe2017; Gallego Reference Gallego2009), which is in line with Tingsten's (Reference Tingsten1937) law of dispersion. Focusing on EP elections, we therefore expect to find indications of a traditional gender gap, with women voting less than men.
Hypothesis 1 Women vote significantly less than men in EP elections.
Further, we expect that the gender gap in EP turnout will be driven by varying degrees of psychological involvement in politics among women and men, which can be captured by their level of interest in politics.
Hypothesis 2 The gender gap in EP elections turnout is driven by different levels of interest in politics.
While the traditional gender gap in political interest remains quite large on average, its magnitude varies across European democracies (Fraile and Gomez Reference Fraile and Gomez2017). If Hypothesis 2 is correct, this should also be reflected in the variation in the magnitude of the gender gap in voter turnout. In countries where the traditional gender gap in political interest is strong, we should observe a large gender gap in voter turnout. Conversely, in countries with a weak traditional gender gap in political interest, the gap in voter turnout is likely to be small to insignificant or, if there are other personality or attitudinal differences between men and women, even reversed.Footnote 1
Political, Societal and Cultural Gender Inequalities
Psychological involvement in politics is, of course, a causally proximate factor to political behaviour. To provide a causally deeper explanation of the potential gender differences in electoral participation, it is necessary to look further in the chain of causality and investigate the sources of the gender differences in political interest. Building on the existing literature, this section examines three possible competing explanations in turn: women's representation in politics, the overall degree of gender equality in society and cultural gender inequalities. A fourth possible explanation pertains to gender inequality in resources such as education or workforce participation (Norris Reference Norris1991; Verba and Nie Reference Verba and Nie1972). However, a number of authors have recently noted that a reduction in these inequalities did not diminish the gender gap in political engagement (for example, Fraile and Gomez Reference Fraile and Gomez2017; Kittilson Reference Kittilson2016). We thus include education and employment status only as control variables in all of our analyses.
The first potential alternative account is that women's representation in politics explains gender differences in voter turnout. Indeed, a number of recent studies argue that an increased representation of women in elected offices has strong effects on women's political engagement, interest and knowledge (Campbell and Wolbrecht Reference Campbell and Wolbrecht2006; Carreras Reference Carreras2017; Dassonneville and McAllister Reference Dassonneville and McAllister2018; Fraile and Gomez Reference Fraile and Gomez2015). The effects of women's descriptive representation on women's political attitudes and behavior appear to be especially strong among adolescents and young adults (Campbell and Wolbrecht Reference Campbell and Wolbrecht2006; Dassonneville and McAllister Reference Dassonneville and McAllister2018; Wolbrecht and Campbell Reference Wolbrecht and Campbell2007), which Dassonneville and McAllister (Reference Dassonneville and McAllister2018) have argued is because contextual effects are most important during the formative years, when political attitudes are formed.
Several mechanisms have been proposed to establish a causal link between the presence of women in politics and women's political engagement. Female politicians and political leaders can serve as role models for other women. Their presence could thus be symbolic, weakening the stereotype that politics is a masculine domain (Karp and Banducci Reference Karp and Banducci2008) and increasing the legitimacy of the political system for women (Mansbridge Reference Mansbridge1999). A number of publications have offered suggestive evidence of the important role of symbolic representation for women. For instance, the political engagement of adolescent girls is positively affected by an increased representation of women in politics (Campbell and Wolbrecht Reference Campbell and Wolbrecht2006; Wolbrecht and Campbell Reference Wolbrecht and Campbell2007), and women are more likely to enter into politics when more women are elected to high-profile offices (Ladam, Harden and Windett Reference Ladam, Harden and Windett2018). Women's political representation could also be important for substantive reasons, if female politicians pay greater attention to issues that improve women's equality in society (Greene and O'Brien Reference Greene and O'Brien2016; Lovenduski and Norris Reference Lovenduski and Norris2003). For all these reasons, we expect that gender differences in political interest will be smaller in settings with a stronger political representation of women.
Hypothesis 3 The gender gap in political interest reflects the extent to which women are represented in elected offices.
The second competing explanation posits that the gender differences in political engagement reflect broader (and not exclusively political) social patterns. From this perspective, gender inequality in the political sphere results from inequalities in other areas. For instance, the more women have to bear the burden of household and family life, the less likely they are to have time and energy for politics (Fraile and Gomez Reference Fraile and Gomez2017). By contrast, the more that traditional gender inequalities are attenuated or even eliminated through public policies, the smaller the gender gap in political engagement. In line with this interpretation, Fraile and Gomez (Reference Fraile and Gomez2017) have recently found that an index measuring gender equality across a broad range of areas is positively associated with weaker gender differences in political interest.
Hypothesis 4 The gender gap in political interest reflects the effective overall level of gender equality.
Finally, the third account is similar to the second in that it does not consider the gender gap in political engagement to be a specifically political phenomenon. However, instead of public policies, it focuses on socialization processes that reproduce traditional gender roles and stereotypes (Bennett and Bennett Reference Bennett and Earl Bennett1989; Norris and Inglehart Reference Norris and Inglehart2001; Inglehart and Norris Reference Inglehart and Norris2003; Paxton and Kunovich Reference Paxton and Kunovich2003). From this perspective, several studies found that cultural obstacles are the main causes of women's under-representation in elected offices (Bennett and Bennett Reference Bennett and Earl Bennett1989; Paxton and Kunovich Reference Paxton and Kunovich2003; Glatte and de Vries Reference Glatte and de Vries2015). Sartori, Tuorto and Ghigi (Reference Sartori, Tuorto and Ghigi2017) study a massive dataset of Italian households and find that the gender gap in political participation – in contrast to social and leisure activities – persists even when contributions to domestic work are controlled for. They attribute this result to cultural barriers. As regards political interest, Bennett and Bennett (Reference Bennett and Earl Bennett1989) found that general sex role socialization better explains the gender gap than situational or structural accounts.
We build on these findings and suggest that what matters for gender equality in political interest is general cultural perceptions of men's and women's social roles. The more society adheres to traditional norms and stereotypes, the more politics is considered to be the domain of men. According to this interpretation, the elite level (for example, women's political representation) and public policies (for example, availability of childcare facilities) are only some of the factors that may gradually affect society's cultural norms. And it is, in fine, these general cultural norms that drive men's and women's everyday behaviour and attitudes. The less individuals' social roles are predetermined by their sex, the weaker should be the traditional gender gap in political interest and, by the same token, in political participation.
Hypothesis 5 The gender gap in political interest reflects cultural norms and stereotypes.
Hypotheses 4 and 5 are inspired by a rich literature that has highlighted the important roles of gender equality and sex role socialization in explaining gender differences in attitudes and behaviour. However, recent studies seemingly challenge such work, and find that in more gender-equal societies, men and women differ more strongly in terms of personality traits than in less gender-equal societies (Falk and Hermle Reference Falk and Hermle2018; Giolla and Kajonius Reference Giolla and Kajonius2019). While these findings are important, they do not rule out the potentially positive effect that gender equality may have on reducing the gender gap in political interest (and participation) for two reasons. First, previous studies have found only a weak association between personality traits and political interest. The only personality trait that is consistently related to political interest is openness: more open individuals tend to be more interested in politics.Footnote 2 Secondly, women are, on average, more open than men, and this difference is stronger in more gender-equal societies (Giolla and Kajonius Reference Giolla and Kajonius2019). It is therefore very unlikely that the traditional gender gap in political interest is a result of gender differences in personality. If anything, the impact of other factors such as gender-unequal policies (Hypothesis 4) or gender-unequal social norms (Hypothesis 5) on political interest is probably attenuated by their effect on personality traits.
Data and Methods
We first explore variation in the gender gap over time and across countries via a series of regressions of individual voter turnout on a dummy variable Female and year and country control dummies. Subsequently, we analyse this variation by incorporating individual-level variables. These comprise classic predictors of voter turnout (Blais Reference Blais2000; Geys Reference Geys2006; Smets and van Ham Reference Smets and van Ham2013; Stockemer Reference Stockemer2017): socio-demographic indicators of resources (continuous age and dummies for education, employment status and perceived class status), correlates of political mobilization (dummies for closeness to a political party, trade union membership and weekly attendance of religious services) and an indicator of psychological involvement in politics (four-point scale of political interest).Footnote 3 Given the specific nature of EP elections (Flickinger and Studlar Reference Flickinger and Studlar2007), we also include a measure of support for European integration (dummies for considering EU membership as a good, neither good nor bad, or bad).
We use survey data, with self-reported turnout rates, to study the determinants of electoral participation. We acknowledge that this type of data has been shown to overestimate actual turnout rates, both because voters tend to be over-represented in surveys and because non-voters misreport having voted (Selb and Munzert Reference Selb and Munzert2013). Yet we have no reason to believe that this over-reporting is systematically correlated with gender. Karp and Brockington (Reference Karp and Brockington2005) studied over-reporting in five countries and found no differences between men and women. More recently, Morin-Chassé et al. (Reference Morin-Chassé2017) conducted an experimental study on the consequences of using a face-saving option to measure turnout. They found that men and women respond similarly to this option, suggesting that they are roughly equally likely to over-report turnout when such an option is not available.
To quantify the contributions to the gender gap in voter turnout more explicitly, we complement the regression analyses with a linear decomposition (Oaxaca Reference Oaxaca1973; Blinder Reference Blinder1973). For consistency with the rest of the analysis (that is, the use of linear probability models, see below), we apply a linear decomposition technique. The use of a non-linear decomposition (Fairlie Reference Fairlie2005) leads to similar substantive results, which we display in the Appendix. We executed the two decompositions using software developed by Jann (Reference Jann2006, Reference Jann2008). The decomposition technique is a standard method of studying differences and inequalities in gender or race (Dow Reference Dow2009; Kim Reference Kim2010). It decomposes the effect of a binary variable in a regression analysis (that is, the difference in an outcome variable between two groups) into two parts: explained and unexplained (see Equation 1). The explained part refers to the group difference in endowments with the independent variables (for example, educational attainment) and the unexplained part to the group differences in the effects of these endowments (for example, a different regression coefficient of education for each group) and, more generally, to unobserved factors.
 $$\eqalignno{\hbox{Gender gap in turnout} = &\underbrace{{[ E( X_M) -E{( X_W) }^{\prime}\beta ^\ast ) ] }}_{{{\rm Explained\ part}}} \cr & + \underbrace{{[ E{( X_M) }^{\prime}( \beta _M-\beta ^\ast ) -E( X_W{) }^{\prime}( \beta _W-\beta ^\ast ) ] }}_{{{\rm Unexplained\ part}}}} $$
Note: XM and XW denote vectors with men's and women's endowments in terms of independent variables. β*, βM, and βW are regression coefficients for the pooled sample, men and women respectively.
The decomposition analysis allows us to more directly test whether the gender gap in voter turnout in European elections is, in line with Hypothesis 2, mostly driven by a gender gap in political interest. The explained and unexplained components that the decomposition technique estimates are, in fact, simple aggregates of the contributions of individual factors (such as political interest). The explained part is the sum of the differences in individual endowments multiplied by the associated regression coefficients (see Equation 2). Importantly, the individual contributions can be expressed as shares of the estimated total gender gap (see Equation 3).Footnote 4
 $$\eqalign{{\rm Explained\ part} & = \;( {\bar{X}}_M-{\bar{X}}_W) ^{\prime}\hat{\beta } = \underbrace{{( {\bar{X}}_{{\rm Ag}{\rm e}_M}-{\bar{X}}_{{\rm Ag}{\rm e}_W}) {\hat{\beta }}_{{\rm Age}}}}_{{{\rm Contribution}\colon \; {\rm Age}}} \cr & \quad + \underbrace{{( {\bar{X}}_{{\rm Postsecondar}{\rm y}_M}-{\bar{X}}_{{\rm Postsecondar}{\rm y}_W}) {\hat{\beta }}_{{\rm Postsecondary}}}}_{{{\rm Contribution}\colon \; {\rm Postsecondary \ education}}} \cr & \quad + \underbrace{{( {\bar{X}}_{{\rm Unemploye}{\rm d}_M}-{\bar{X}}_{{\rm Unemploye}{\rm d}_W}) {\hat{\beta }}_{{\rm Unemployed}}}}_{{{\rm Contribution}\colon \; {\rm Unemployment}}} \cr & \quad + \underbrace{{( {\bar{X}}_{{\rm Not\ workin}{\rm g}_M}-{\bar{X}}_{{\rm Not\ workin}{\rm g}_W}) {\hat{\beta }}_{{\rm Not\ working}}}}_{{{\rm Contribution}\colon \; {\rm No \ formal \ employment}}} \cr & \quad + \underbrace{{( {\bar{X}}_{{\rm Middle\ clas}{\rm s}_M}-{\bar{X}}_{{\rm Middle\ clas}{\rm s}_W}) {\hat{\beta }}_{{\rm Middle\ class}}}}_{{{\rm Contribution}\colon \; {\rm Share \ of\ Middle \ Class}}} \cr & \quad + \underbrace{{( {\bar{X}}_{{\rm Upper\ clas}{\rm s}_M}-{\bar{X}}_{{\rm Upper\ clas}{\rm s}_W}) {\hat{\beta }}_{{\rm Upper\ class}}}}_{{{\rm Contribution}\colon \; {\rm Share \ of \ Upper \ Class}}} \cr & \quad + \underbrace{{( {\bar{X}}_{{\rm EU\ neithe}{\rm r}_M}-{\bar{X}}_{{\rm EU\ neithe}{\rm r}_W}) {\hat{\beta }}_{{\rm EU\ neither}}}}_{{{\rm Contribution}\colon \; {\rm Indifferent \ attitude \ to \ EU \ membership}}} \cr & \quad + \underbrace{{( {\bar{X}}_{{\rm EU\ goo}{\rm d}_M}-{\bar{X}}_{{\rm EU\ goo}{\rm d}_W}) {\hat{\beta }}_{{\rm EU\ good}}}}_{{{\rm Contribution}\colon \; {\rm Positive \ attitude \ to \ EU \ membership}}} \cr & \quad + \underbrace{{( {\bar{X}}_{{\rm Trade\ unio}{\rm n}_M}-{\bar{X}}_{{\rm Trade\ unio}{\rm n}_W}) {\hat{\beta }}_{{\rm Trade\ union}}}}_{{{\rm Contribution}\colon \; {\rm Trade \ union \ membership}}} \cr & \quad + \underbrace{{( {\bar{X}}_{{\rm Religiou}{\rm s}_M}-{\bar{X}}_{{\rm Religiou}{\rm s}_W}) {\hat{\beta }}_{{\rm Religious}}}}_{{{\rm Contribution}\colon \; {\rm Attendance \ of \ religious \ services}}} \cr & \quad + \underbrace{{( {\bar{X}}_{{\rm Part}{\rm y}_M}-{\bar{X}}_{{\rm Part}{\rm y}_W}) {\hat{\beta }}_{{\rm Party}}}}_{{{\rm Contribution}\colon \; {\rm Closeness \ to \ a \ party}}} \cr & \quad + \underbrace{{( {\bar{X}}_{{\rm Interes}{\rm t}_M}-{\bar{X}}_{{\rm Interes}{\rm t}_W}) {\hat{\beta }}_{{\rm Interest}}}}_{{\bf { \vector Contribution}\colon \; {\vector Interest \ in \ politics}}} \cr & \quad + \underbrace{{( {\bar{X}}_{{\rm Country}i_{\rm M}}-{\bar{X}}_{{\rm Country}i_{\rm W}}) {\hat{\beta }}_{{\rm Country}i}}}_{{{\rm Contribution}\colon \; {\rm Country \ dummies\ ( }i = 1, \ldots , I) }} \cr & \quad + \underbrace{{( {\bar{X}}_{{\rm Election}j_{\rm M}}-{\bar{X}}_{{\rm Election}j_{\rm W}}) {\hat{\beta }}_{{\rm Election}j}}}_{{{\rm Contribution}\colon \; {\rm Election \ dummies\ }( j{\rm =\ 1}, \ldots , J) }}} $$
Note: The group means  $\bar{X}_M$ and
 $\bar{X}_W$ are used as estimates of the endowments E(XM) and E(XW) from Equation 1.
 $\widehat{\beta }$ are estimates of the pooled regression coefficients
 $\hat{\beta }$.
 ${\rm Contribution\ of\ political\ interest\ as\ share\ of\ the\ gender\ gap} = {{( {\bar{X}}_{{\rm Interes}{\rm t}_M}-{\bar{X}}_{{\rm Interes}{\rm t}_W}) {\hat{\beta }}_{{\rm Interest}}} \over {( {\bar{X}}_{{\rm Voter\ turnou}{\rm t}_M}-{\bar{X}}_{{\rm Voter\ turnou}{\rm t}_W}) }}$
Note:  $\bar{X}_{{\rm Voter\ turnou}{\rm t}_M}$ and
 $\bar{X}_{{\rm Voter\ turnou}{\rm t}_W}$ are men's and women's average voting rates, respectively.
We subsequently explore the cross-country variation in the gender gap in political interest. We employ three sets of macro-level indicators. The first set captures the impact of women's political representation (Hypothesis 3). We test the impact of the percentage of women in the legislature – likely the most common indicator used in research on the effects of women's political representation (Beauregard Reference Beauregard2018; Fortin-Rittberger Reference Fortin-Rittberger2016; Fraile Reference Fraile2014; Karp and Banducci Reference Karp and Banducci2008). Information on the percent of women in parliament comes from Paxton, Green and Hughes (Reference Paxton, Green and Hughes2008) and has been updated with data from the Inter-Parliamentary Union website (IPU 2016). In addition, we verify the impact of the percent of women in parliament when a citizen reached voting age to account for the possibility that women's descriptive representation has a long-term impact (Dassonneville and McAllister Reference Dassonneville and McAllister2018).
Secondly, to measure a society's overall level of gender inequality (Hypothesis 4), we follow Fraile and Gomez (Reference Fraile and Gomez2017) and employ an index produced by the European Institute for Gender Equality (EIGE).Footnote 5 The EIGE's gender equality index draws on thirty-seven indicators and spans six areas: work, money, knowledge, time, power and health. The index is available between 2005 and 2015 and ranges from 0 (full gender inequality) to 100 (full gender inequality). We enter it in our analyses in two versions. The variable EIGE corresponds to a time-series indicator available for the EP elections in 2004, 2009 and 2014. We use the values of the index from the most proximate available years: 2005, 2010 and 2015, respectively. The variable EIGE (2005–2015 average) contains a time-invariant average for the 2005–2015 period.
Thirdly, to operationalize the degree of cultural gender inequality in society (Hypothesis 5), we do not rely on explicit survey data because responses to these items tend to be strongly affected by social desirability bias (Setzler Reference Setzlerforthcoming; Streb et al. Reference Streb2008; Walter Reference Walter2018). Scholars who specialize in gender and survey methodology even argue that it is almost impossible to assess respondents’ true gender role attitudes (Walter Reference Walter2018). When performing a cross-national comparison, the use of survey items on gender attitudes is particularly problematic as, especially among men, attitudes on gender tend to follow elites' cues (Morgan and Buice Reference Morgan and Buice2013). Consequently, survey responses may conform to incumbent (liberal or conservative) elites' expectations and only weakly reflect cultural norms and mass behaviour that characterize the population at large. Furthermore, in face-to-face surveys, which are the best means to reach a representative sample of the population (Baker et al. Reference Baker2010; Malhotra and Krosnick Reference Malhotra and Krosnick2007), desirability bias is also influenced by the interviewer's gender (Huddy et al. Reference Huddy1997). Finally, in addition to the external pressure to give socially desirable responses, there is typically even a gap between sincere conscious attitudes on gender roles, on the one hand, and (partly) unconscious, real-world patterns of thought and behaviour on the other hand (Chiao, Bowman and Gill Reference Chiao, Bowman and Gill2008; Mo Reference Mo2015). In sum, explicit survey items on gender roles are fragile tools, and in many situations it may be preferable to employ suitable alternatives.
We instead use mathematical scores to capture cultural gender differences. However, maths scores correlate with survey-based measures of cultural gender differences in society, suggesting that both tap into the same latent construct. We also show in the Appendix that using explicit survey data from the European Values Survey instead leads to similar results. That is, the results of these analyses still support Hypothesis 5. A large number of studies have shown that this indicator is positively associated with explicit survey measures of gender inequality (Dickerson, McIntosh and Valente Reference Dickerson, McIntosh and Valente2015; Guiso et al. Reference Guiso2008; Hyde and Mertz Reference Hyde and Mertz2009; Nollenberger, Rodrìguez-Planas and Sevilla Reference Nollenberger, Rodrìguez-Planas and Sevilla2016; Nosek et al. Reference Nosek2009; Rai Reference Rai2018). Therefore, in countries where women are the most emancipated, young female students perform as well or even better than men in maths. By contrast, in societies where respondents adhere to traditional gender roles, boys perform significantly better in maths than girls.
We use data from two distinct cross-national studies: the Program for International Student Assessment (PISA) and the Trends in International Mathematics and Science Study (TIMSS). Both studies provide a comprehensive assessment of mathematical skills: the PISA data for 15-year-old students and the TIMSS study for approximately 10-year-old students. In both cases, we calculated the gender gap for country i as the difference between women's and men's average scores, standardized by the country's average score (see Equation 4). These data are available only for 2000–2015 (PISA)Footnote 6 and 1995–2015 (TIMSS).Footnote 7 During these periods, neither measure exhibits a time trend and the country-level differences remain stable. This supports the idea, suggested in the aforementioned studies, that the gap in mathematical performance reflects long-term and durable cultural traits that pertain to gender. In the following analyses, we thus enter the PISA and TIMSS measures as time-invariant country-level averages. This produces more reliable measures (that is, measures less affected by idiosyncratic measurement errors) and allows us to cover the whole study period.Footnote 8
 $$ {\rm Gender\ gap\ in\ math}{\rm s}_i = \displaystyle{{{\rm Women \apos s} {\rm \ average \ scor}{\rm e}_i \, {-} \, {\rm Men \apos s} {\rm \ average \ scor}{\rm e}_i} \over {{\rm Country\ averag}{\rm e}_i}}$$
Descriptive statistics of all variables included in the analyses are reported in the Appendix.
The EES data have a nested structure, with individual respondents nested in election years and in countries. In addition, we are interested in analysing how contextual-level variables (indicators of political, societal and cultural gender inequalities) moderate individual-level differences in political interest. We take into account the data structure and estimate hierarchical random intercept models. We also specify random slopes for gender (Gelman and Hill Reference Gelman and Hill2007). To ease the interpretation of the effects (and the estimation), we present the results of linear probability models.
Results
Tenacity of the Traditional Gender Gap in Voter Turnout
Figure 1 displays the over-time evolution of the gender gap in voter turnout in supranational elections. We distinguish two groups of countries. The first comprises only countries that had become EU member states by 1979 and, therefore, the related estimates are not affected by successive EU enlargements. The other group includes all EU member states in the given election year; its estimates thus indicate an average value of the gender gap for the whole EU.
Evolution of gender gap in voter turnout
Note: the figure draws on average marginal effects from linear probability models of voter turnout and includes the dummy variable Female and country controls as predictors negative values mean that women participate at lower rates. 90 per cent confidence intervals. EES data 1979–2014. The 2004 estimate does not include Belgium and Lithuania for which the voter turnout variable is not available.

The two types of indicators point systematically in the same direction. In line with Hypothesis 1, they confirm that women tend to vote at lower rates than men in EP elections. This inequality in electoral participation is strikingly stable over time and generally oscillates between 2 and 3 percentage points. The effect of EU enlargement on the overall magnitude of the gender gap appears to be negligible.
Although the gender gap in voter turnout remains stable over time, it varies strongly between countries. This is shown in Figure 2, which plots the gender gap by country in both EP and national elections. The traditional gender gap in EP elections can be observed in approximately two-thirds of EU member states and reaches almost 7 percentage points in Poland and Croatia. By contrast, in mostly North European countries (but also Malta), the gap is reversed and women vote at higher rates than men by up to 5 percentage points. In nearly all cases, the traditional gap is weaker (that is, less unfavorable to women) in national elections than in EP elections. There are a few exceptions, but these are probably the result of a less accurate estimation for national elections as the question on national turnout was asked in only three EES waves (1989, 1994 and 2014). Most of the countries for which the national gap appears stronger than the EP gap joined the EU only in 2004; the participation rates in national elections hence draw on a single EES sample (from 2014).
Gender gap in voter turnout by country
Note: the figure displays average marginal effects from country-specific regressions including year dummies. negative values mean that women participate at lower rates. 90 per cent confidence intervals. EES data 1979–2014. Information on national elections is available only for 1989, 1994 and 2014.

On average, women do not vote less than men in national elections. This discrepancy between EP elections and national elections corroborates the findings of Kostelka, Blais and Gidengil (Reference Kostelka, Blais and Gidengil2019). However, it should be noted that, although the sex differences in participation vary in magnitude, they are correlated across election types. In countries where the EP gap is reversed, women also participate at higher rates than men in national elections. Conversely, where the traditional gap is strong in EP elections, there also seems to be a mild gap in national elections. This suggests that sex differences in voting rates reflect more general societal patterns that are unrelated to the specificity of supranational elections.
Explaining The Gender Gap in Voter Turnout
Having shown indications of a traditional gender gap – with women turning out at lower rates than men – in a large majority of countries in the EES dataset, we now investigate the sources of the gender gap in voter turnout in EP elections.
In a first step, we examine which individual-level factors account for this gender gap in voter turnout. In Table 1, we present the estimates of a series of five hierarchical models explaining turnout in EP elections. The first is a baseline model in which we only control for respondents' gender. In Models 2 and 3 we add the socio-demographic variables and attitudes towards the EU, respectively. In a fourth model, we also control for correlates of political mobilization, while the fifth and final model also accounts for the role of political interest.
Explaining turnout in EP elections, individual-level determinants

Note: coefficients of random intercept linear probability models, random slope specified for gender. Standard errors in parentheses. *p < 0.05, ** p < 0.01, *** p < 0.001
The results of Model 1 in Table 1 offer evidence of a significant gender gap in turnout in the pooled dataset. The effect of gender, which is estimated to be about 1.7 percentage points, appears to be largely unaffected by the addition of socio-demographic control variables in Model 2. Even though each of these control variables is significantly – and in expected ways – related to turnout in EP elections, these variables do not seem to account for gender differences in this sample of elections.
Additionally controlling for respondents' attitudes towards the EU (in Model 3) somewhat reduces the estimated gender gap in EU turnout. Though women are still estimated to turn out less than men.
In Model 4 we add a set of variables that captures the impact of mobilization agents on turnout. The estimates of this model confirm the impact of mobilization, as trade union members, those who regularly attend religious service and individuals who are close to a party are all more likely to turn out to vote. Accounting for these variables, however, only marginally affects the gender gap.
The picture radically changes when we also control for respondents' reported level of interest in politics (Model 5). A higher level of interest in politics is positively and significantly associated with the probability of participation in EP elections. Importantly, adding political interest to the model leads to a reversal of the gender gap in turnout (the coefficient for female is now positive and significant). These results suggest that when we account for the fact that women are generally less interested in politics (Thomas Reference Thomas2012; Kostelka, Blais and Gidengil Reference Kostelka, Blais and Gidengil2019), women appear to turn out more than men. This reversed gender gap may be due to other persisting personality and/or attitudinal differences between men and women, as documented by recent research (Falk and Hermle Reference Falk and Hermle2018; Giolla and Kajonius Reference Giolla and Kajonius2019). Caution is, of course, needed in the interpretation of this result, as it is to some extent based on an extrapolation. Yet Figure 2 shows that, at least in some North European countries, the reversed gender gap is real. One factor that might motivate women to turn out more is civic duty. Indeed, Carreras (2018) has found that women have a stronger feeling that voting is a civic duty (but see Galais and Blais Reference Galais and Blais2018 for a critical assessment).
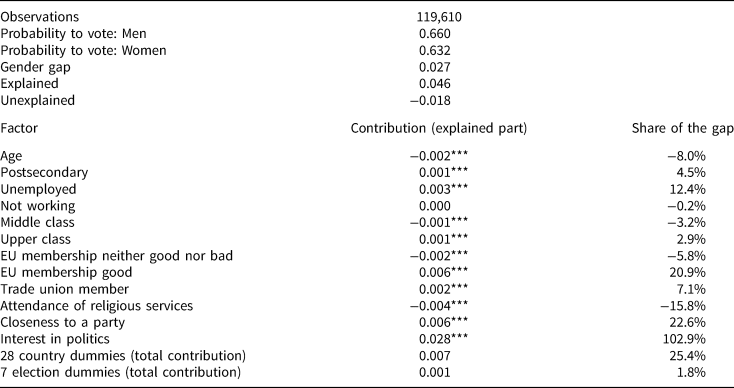
To investigate the contributions to the gender gap in voter turnout more explicitly, Table 2 displays the results of the linear decomposition. It reveals that the gap is entirely due to differences in the levels of the independent variables (that is, the explained part). In fact, differences in regression coefficients (and unobserved factors, that is, the unexplained part) moderate the gap; without them, the gap is nearly 1.8 percentage points larger. In Table 2, the magnitude of the gender gap appears larger than in Table 1. This is because, in the estimation procedure, the initial regression of turnout on gender does not control for country and year dummies. These controls are incorporated only in the decomposition stage and their contributions jointly account for the difference between Tables 2 and 1.
Linear decomposition of the gender gap in voter turnout

*p < 0.05, **p < 0.01, ***p < 0.001
Political interest represents by far the strongest contribution; on its own, it accounts for the observed gap. The other, significantly weaker, contributions largely cancel each other out. Moreover, the two strongest of these contributions – closeness to a party (22.6 per cent) and considering EU membership to be a good thing (20.9 per cent) – are themselves strongly associated with political interest and, therefore, their contributions may partly reflect the indirect effects of political interest. In additional analyses, we found that of the variables included in our data set, political interest is the strongest predictor of closeness to a political party and of considering EU membership as a good thing. Of course, our data do not allow us to establish the direction of causality in these cases. However, it is likely that, at least in some instances, interest in politics caused respondents to adhere to a political party or appreciate the benefits of European integration. In short, the decomposition analysis provides strong support for Hypothesis 2.
Summarizing the results from this section, we find evidence of a traditional gender gap in turnout for EP elections. This gap appears to largely reflect women's lower level of interest in politics. When we account for differential levels of political interest, women turn out more than men.
These results align well with our expectations; not only is there evidence that women turn out less than men in EP elections (Hypothesis 1), we also find that political interest is the main cause of this gender gap in EP turnout (Hypothesis 2). In the next section we investigate what leads women to be less interested in politics – paying particular attention to the role of contextual factors.
Explaining The Gender Gap in Political Interest
To explore the origins of the gender gap in voter turnout, we leverage over-time and cross-country variation in political interest. We aim to identify factors that may explain why, in some countries, women are more interested in politics and, thereby, participate at higher rates in European elections.
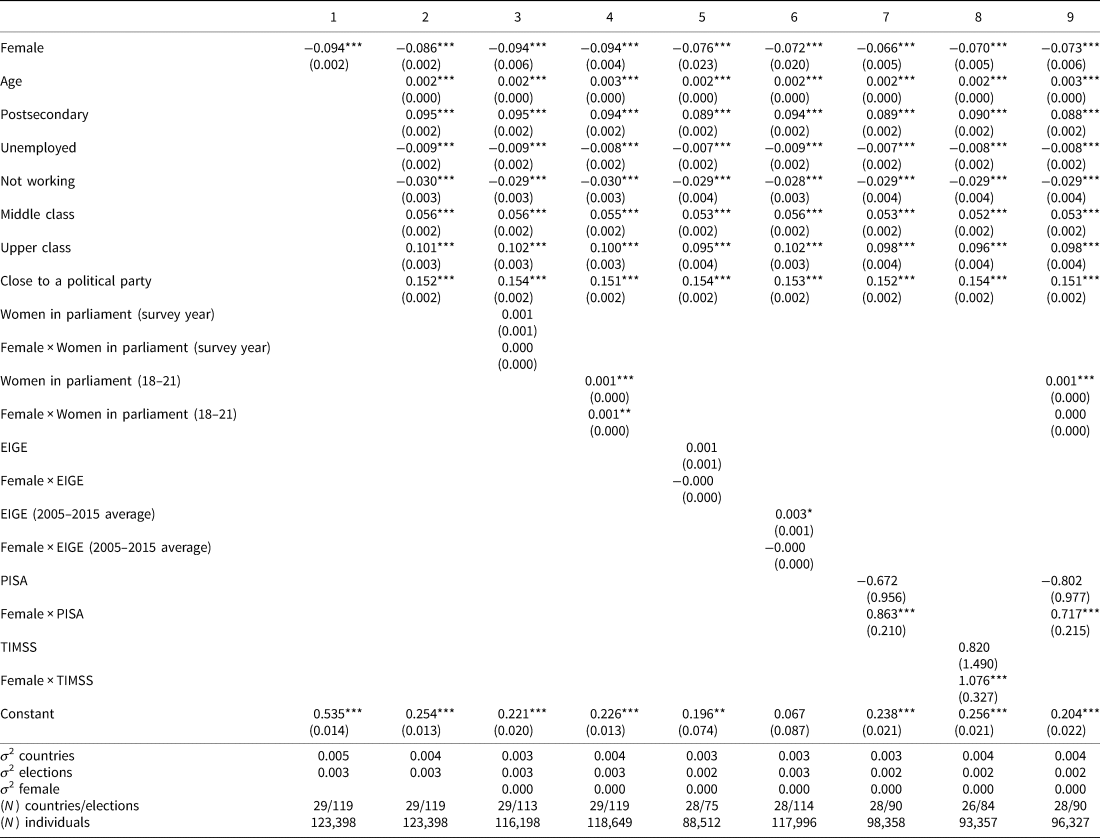
In Table 3, we present the results of a series of mixed linear regression models to explain political interest. Additional results reported in the Appendix show that our results are substantively the same when we estimate ordered logit models to take into account the categorical nature of the dependent variable (with four answer options). In a first step, we explicitly demonstrate the presence of a gender gap in political interest. The results confirm that in our EU-wide 1979–2014 dataset, women are, on average, significantly less interested in politics than men even when accounting for a set of individual-level predictors of political interest. The effects of these individual-level variables are largely in line with theoretical expectations: being older, more educated, employed, a member of a higher social class and feeling close to a party all increase reported levels of political interest.
Explaining political interest, contextual-level factors

Note: coefficients of random intercept linear regression models, random slope specified for gender. Standard errors in parentheses. * p < 0.05, ** p < 0.01, *** p < 0.001
The main goal of the analyses reported in Table 3, however, is to explain between-country variation in the gender gap in political interest, which we found to be the key to understanding the presence of a traditional gender gap in EP turnout. To do so, in Models 3 to 8 in Table 3 we include interactions between respondents' sex and six different macro variables. We investigate the role of women's political representation (the percent of women in parliament at the time of the survey, and when the respondent was 18–21 years old), societal gender equality (EIGE and EIGE (2005–2015 average)) and cultural gender equality (by means of differences between boys' and girls' maths scores according to PISA and TIMSS).
First, a stream of recent publications has argued that women's descriptive representation can play a crucial role in increasing their political engagement, which reduces gender gaps. Models 3 and 4 test these claims for political interest. The results consistently show the expected positive interaction effect between women's political representation and respondent's gender. However, this effect falls short of significance when focusing on the percent of women in the legislature at the time of the survey. The results of Model 4 are more encouraging, as they suggest that a higher percentage of women in the legislature during respondents' formative years (18 to 21) is associated with a significantly smaller gender gap in political interest. These results are in line with earlier work, which has argued that if women's descriptive representation has an effect, it works through the mechanism of political socialization (Dassonneville and McAllister Reference Dassonneville and McAllister2018).
By contrast, the level of overall societal gender equality does not find support in our data (see Models 5 and 6). The interaction between the EIGE's index and Female (both the time-variant and time-invariant versions) does not have the expected sign and is statistically insignificant. This invalidates Hypothesis 4.
Finally, Models 7 and 8 in Table 3 test cultural explanations by interacting the respondent's sex with country-level differences in boys' and girls' maths scores. A different way of gauging the association between the gender gap in political interest and gender differences in math scores is to plot – in a bivariate way – the random effects of the Female coefficient over the maths score differentials. As evident from the Appendix, this simple graphical representation demonstrates a positive correlation between both. That is, settings in which girls do better than boys on maths tests also tend to report positive gender gaps in political interest and vice versa. The estimates in Table 3 suggest that cultural differences matter a great deal for explaining the gender gap in political interest. The effect of the two indicators is in the expected direction, highly significant, and of roughly the same size for both data sources.
Furthermore, the estimates of Model 9 indicate that when considering political and cultural factors simultaneously, the latter matter more. That is, when accounting for differences in boys' and girls' maths scores, the long-term impact of women's descriptive representation is no longer significant at conventional levels. The effect of culture, by contrast, seems largely unaffected when we account for the role of women's descriptive representation.
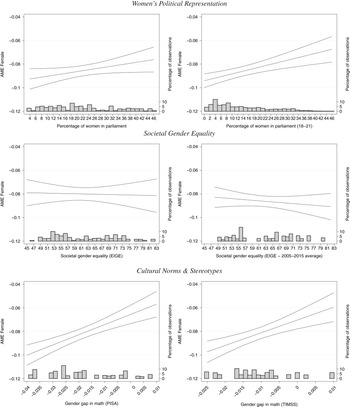
To ease the interpretation of the interaction effects in Table 3, in Figure 3 we present the average marginal effect of gender (using the observed values of the other variables) for different values of the macro indicators. Looking at the marginal effects plots clarifies that the political and cultural macro variables have the expected effect: as women's political representation (upper graphs) or cultural gender equality (bottom graphs) increases, the gender gap in political interest tends to be smaller. The strongest impact, however, and the only contextual factor that seems to have the potential to significantly reduce the gender gap in interest, is culture. For this factor, as the difference between boys' and girls' maths scores in the PISA tests moves from the minimum to the maximum value, the gender gap in political interest is nearly halved. This suggests that if societies curb stereotypical perceptions about gender-specific social roles – that is, if they stop assuming that maths and politics are more for boys than girls – this may reduce or even fully eliminate the traditional gender gap in voter turnout. Our first analysis demonstrates that women with the same level of political interest as men tend to vote more than men. Therefore, to eliminate the gender gap in voter turnout, the level of political interest does not even need to be the same. A substantial reduction in the difference between men and women may suffice. Of course, caution is needed in the extrapolation of these results as the variation we observe in our data is mostly cross-sectional.
Marginal effects of female on political interest, conditional on macro-level factor
Note: estimates and 90 per cent confidence intervals come from Models 3 to 8 in Table 3.

Discussion
The scientific literature on gender and turnout generally finds few indications of different turnout rates among men and women. In contrast to what holds for attitudinal variables such as political interest or non-institutional forms of participation, the gender gap in turnout appears to have diminished or even reversed.
As we have shown here, however, this conventional wisdom does not apply to low-turnout elections, such as elections to the EP. In a large majority of the countries in our dataset, women are less likely to turn out than men for EP elections, while there is no such a gap for elections to the national parliament. This gender gap is remarkably stable over time, despite patterns of growing gender equality in other domains.
Why is the gender gap in turnout for EP elections so persistent, while the traditional gender gap in national parliamentary elections has diminished or disappeared? Our results suggest that attitudinal factors, and political interest more specifically, are key. A large number of studies have shown that gender differences in such attitudinal variables are large and stable (Dassonneville and McAllister Reference Dassonneville and McAllister2018; Thomas Reference Thomas2012), and these indicators of psychological engagement with politics have even more weight in low-turnout elections (Kostelka, Blais and Gidengil Reference Kostelka, Blais and Gidengil2019). Hence, once we account for these attitudes, and women's overall lower level of interest in politics, women actually turn out more than men in EP elections.
Our results provide insights into the reasons for gendered patterns of political participation in EP elections. We focused on these elections because they are a textbook example of second-order elections, for which voters perceive there to be ‘less at stake’ (Reif and Schmitt Reference Reif and Schmitt1980). But to what extent do our results generalize to other low-turnout elections? First, regarding the presence of a gender gap in turnout, it is important to stress that not all sub- or supranational elections are truly second-order elections. On this topic, Kostelka, Blais and Gidengil (Reference Kostelka, Blais and Gidengil2019) have shown that its direction and size of the gender turnout gap varies depending on the second-order character of an election. For example, they find no evidence of a gender gap in turnout in subnational elections in Québec and Catalonia, because of the high saliency of these elections. Secondly, it is possible that the mechanisms we have identified do not apply to local elections, even when they are clearly low-turnout elections.Footnote 9 In particular, Coffé (Reference Coffé2013) has shown that – in contrast to what holds for national or international politics – there is no evidence of a gender gap in interest in local politics. In line with this finding, studies from the early 2000s (Childs Reference Childs2004, Norris and Inglehart Reference Norris and Inglehart2001) did not observe the traditional gender gap in voter turnout in British local elections. By contrast, Kostelka, Blais and Gidengil (Reference Kostelka, Blais and Gidengil2019) found the traditional gender gap in the 2014 French municipal elections. Unfortunately, the lack of a large comparative dataset of local election surveys prevents us from directly evaluating whether our results hold for local elections as well. We hope that our results spur further research on this topic, with specific attention to second-order elections of different degrees.
Our analyses suggest that the deep cause of the gender gap in voter turnout, acting through political interest, lies in the cultural perceptions of men's and women's roles. Full gender equality in voting – and, presumably, other forms of political participation – is likely to be achieved only when these resilient perceptions evolve. Our results support the idea that better women's representation in politics may help in this respect, but we do not find a direct link between overall gender equality in society and political interest. To be effective, public policies designed to increase gender equality in politics should thus more directly target cultural representations and stereotypes. Future research should help identify effective methods of overcoming these long-lasting impediments to genuinely gender-equal politics.
Supplementary material
Data replication sets are available in Harvard Dataverse at: https://doi.org/10.7910/DVN/V6HXIZ and online appendices at: https://doi.org/10.1017/S0007123419000644.
Acknowledgements
Both authors contributed to this manuscript equally. A previous draft of this manuscript received the 2019 Marian Irish Award from the Southern Political Science Association. Early versions of the manuscript benefited from comments and suggestions of the participants at the 2018 Annual Meeting of the Southern Political Science Association in New Orleans; the ‘Journée d’études de Sciences Po Quanti’ conference in Grenoble; the ‘Institutions in context: gender equality and policy’ conference at the University of Tampere; and the 2018 Annual Conference of the European Political Science Association in Vienna. We are particularly grateful to James Garand, Debra Leiter, Nicolas Sauger, and Mariken van der Velden for their feedback. We would also like to thank three anonymous reviewers and the BJPS editorial team for their constructive assessment and their guidance. Any remaining errors and imperfections are our own.