

1. Introduction
At the end of the nineteenth century, the majority of European countries formed a periphery of developing nations catching up with the developed core. Like today, the high volatility of foreign capital flows was a factor of instability for the ‘emerging economies’ of eastern and southern Europe and of Scandinavia. But unlike contemporary developing nations, which face restrictive immigration policies, pre-1914 European countries benefited from almost unfettered access to the international labour market. New World countries, which had a huge need for labour, acted as magnets for would-be migrants. As a result, movements of labour played a more significant role than today in terms of international convergence (Taylor and Williamson Reference Taylor and Williamson2006).
Migration flows were also at the origin of large money transfers that emigrants sent to their relatives or brought back with them when returning home. The contemporary and historical literature on remittances emphasizes their contribution to the consumption and investment decisions of families left behind and consequently to the catch-up process (Hatton and Williamson Reference Hatton and Williamson2005). Some authors focus on the role of remittances as a mechanism for international risk sharing in relation to the well-known paradox about consumption co-movements across nations (Backus et al. Reference Backus, Kehoe and Kydland1992). Thus, Fenoaltea (Reference Fenoaltea1988) argues that Italian remittances helped with financing current account deficits, especially after 1887, when international capital inflows began to decrease. In the same vein, Esteves and Khoudour-Castéras (Reference Esteves and Khoudour-Castéras2009) show that remittances reduced the incidence of financial disturbances (sudden stops and current account reversals) among peripheral European countries integrated in the gold standard.
This article takes a different perspective on the relevance of remittance flows before World War I by analysing their effects on financial development. Our working concept of financial development follows on the long tradition of identifying it with the change in financial structure, as inferred from consolidated balance sheets (Golsdmith Reference Goldsmith1969; Rajan and Zingales Reference Rajan and Zingales2003). Recent literature relates remittances to financial development in developing countries, finding that they are either substitutes (Calderón et al. Reference Calderón, Fajnzylber, López, Fajnzylber and López2007; Giuliano and Ruiz-Arranz Reference Giuliano and Ruiz-Arranz2009) or complements (Aggarwal et al. Reference Aggarwal, Demirgüç-Kunt and Martínez Pería2006; Martínez Pería et al. Reference Martínez Pería, Mascaró, Moizeszowicz, Fajnzylber and López2007).
Our purpose is to investigate the significance of remittances in promoting late nineteenth-century financial development in eight peripheral countries, with relatively limited access to international lending. Other than sharing the characteristics of emerging economies, these eight countries are singled out in this study because of their relevance in the context of European emigration. On average, they represented around 60 per cent of the total outflow of European migrants between 1880 and 1913 (data from Ferenczi and Willcox Reference Ferenczi and Willcox1929).
The historical literature provides estimates of remittances for four of these countries: Austria–Hungary, Italy, Portugal and Spain. The first contribution of this article is to estimate remittances for four additional countries (Finland, Greece, Norway and Sweden), based on indirect evidence from the emigration process itself and the economic conditions that emigrants encountered in destination countries.
We then investigate the statistical relation between remittance flows and standard measures of the development of the local financial institutions. Our findings imply that there is a complementary relation between remittances and financial development, as the size of remittances has a positive impact on our measures of financial development. This suggests that international migration contributed to the catch-up process before 1914, by means other than income convergence.
2. The interaction between remittances and financial development
2.1. Substitutes or complements?
Current discussions on the relation between remittances and financial development are based on the question of whether they are substitutes or complements. According to the substitutability hypothesis, remittances partially offset the lack of financial development in emigration countries by allowing poor people to invest in high-return projects. On the other hand, the complementarity hypothesis argues that there is a positive interaction between remittances and financial development. High levels of financial development help migrants send more money home and, in turn, a significant inflow of remittances stimulates the interest of financial institutions and public authorities. This brings about higher levels of competition between financial intermediaries, as well as institutional reforms aiming at channelling remittances towards productive investment.
The main arguments in favour of the substitutability hypothesis are presented by Giuliano and Ruiz-Arranz (Reference Giuliano and Ruiz-Arranz2009), who analyse the respective roles of remittances and the financial sector in promoting economic growth. They show, based on a data set of 73 developing countries over the period 1975–2002, that the impact of remittances on growth is stronger when financial markets are underdeveloped. Remittances are supposed to release credit constraints in countries where credit markets are imperfect. This result is confirmed by Calderón et al. (Reference Calderón, Fajnzylber, López, Fajnzylber and López2007), who find that the effect of remittances on growth is inversely related to financial depth in Latin America.
But there is also evidence of complementarity. Mundaca (Reference Mundaca2005) and Bettin and Zazarro (Reference Bettin and Zazzaro2008) find that the more developed the financial sector, the higher the impact of remittances on growth. They interpret the results as evidence that financial institutions help channel remittances towards productive investment projects, particularly in the case of small and medium-sized businesses. These studies also find that remittances have a higher impact when used as collateral for loans from financial intermediaries.
Most statistics on remittances underestimate the real value of money transfers to developing countries, either because they do not take into account money transfer operators, such as Western Union, or because they exclude informal channels (de Luna Martínez Reference de Luna Martínez2005). In this respect, countries with better financial development should receive – or at least measure – more (official) remittances. But beyond the mere accounting aspect, broad and deep financial markets contribute to reducing transfer costs, hence increasing remittance flows, while a stable and reliable banking system leads migrants to remit through formal channels (Aggarwal et al. Reference Aggarwal, Demirgüç-Kunt and Martínez Pería2006). By contrast, inefficiencies in the financial sector, expressed as delays in money transfers, high intermediation costs, or unfavourable exchange rates, tend to curb remittance inflows (Ratha Reference Ratha, Maimbo and Ratha2005).
Remittances also play a key role in strengthening financial institutions in developing countries. They contribute to increasing the demand for financial services, not only for deposit accounts, but also, as remittances exceed the immediate needs of families, for savings accounts. Such demand is met by new financial institutions through a double process of deepening and widening; banks and other money transfer operators open more branches in migration-intensive areas, and offer more services. This increase in competition for financial services decreases intermediation costs to the benefit of the recipients. The fact that migrants’ families receive stable and significant remittances also facilitates their access to loans, making possible the expansion of the domestic credit market.
Aggarwal et al. (Reference Aggarwal, Demirgüç-Kunt and Martínez Pería2006) use balance of payments data for 99 developing countries over the period 1975–2003 to show that remittances contribute to increasing the ratio of bank credit to the private sector and the share of bank deposits, as a percentage of GDP. In their estimates, an increase of remittances worth 1 per cent of GDP generates a rise in credit of around 0.3 per cent, and between 0.5 and 0.6 per cent in the deposits variable. Martínez Pería et al. (Reference Martínez Pería, Mascaró, Moizeszowicz, Fajnzylber and López2007) study 25 Latin American and Caribbean countries over the same period and similarly conclude that the impact of remittances is positive, although the effect is smaller than in other developing regions. An explanation is that recurrent crises in Latin America created a climate of distrust in the banking system, such that remitters were less prone to use the financial system than in other regions. Nevertheless, the same authors provide micro-level evidence from 19 household surveys conducted in 11 countries showing that the probability of using financial services, namely bank accounts and credit, is higher among households that receive remittances than in the rest of the population.
2.2. The impact of remittances on pre-1914 European financial development
Although there is very little literature on the effects of remittances on the nineteenth-century financial sector, the substantial amount of money sent by migrants to their families raises the question of whether the two were not related, at least in the European periphery. Informal channels were quite common during the nineteenth century. Migrants used to send banknotes or even coins through the ordinary mail (Semmingsen Reference Semmingsen1978). They also entrusted envelopes with money inside to acquaintances travelling back home, or carried their savings themselves when returning –temporarily or definitively (Douki Reference Douki2001; Magee and Thompson Reference Magee and Thompson2006a). But, as the migration phenomenon spread, remitters required more reliable transfer systems, and official intermediaries blossomed.
The Western Union Company, the quintessence of today's remittance business, began its money transfer activities in 1871. Several ethnic banks also appeared, like the Emigrant Industrial Savings Bank, oriented towards the Irish community in New York (Ó’Gráda Reference Ó’Gráda1998) or the Bank of Italy in San Francisco (Mittone Reference Mittone1984). The newly created intermediaries developed links with European financial institutions and extended their activities to the countries of emigration.
In Spain, due to the lack of banks outside Madrid and Barcelona, many mercantile houses began to offer remittance services, by setting up direct relations with trading partners overseas or by acting as local correspondents for national or even foreign banks. With time, these ‘merchant-bankers’ specialized in such operations and progressively turned into banking houses or became integrated into the branch network of larger banks (García López Reference García López1992). New banks also appeared and specialized in remittance activities, such as the Banco Hispano Americano and the Crédito Ibero Americano, which opened their doors in 1901 and 1903, respectively.Footnote 1 In other cases, foreign banks entered the domestic market in order to take advantage of the remittance business, such as the Banco Español del Río de la Plata, an Argentinian bank that opened several branches in Spain at the beginning of the twentieth century.
Financial reforms were sometimes encouraged by public authorities. In Italy, the 1901 law on emigration aimed at channelling remittances through official financial institutions to protect migrants and their families against untrustworthy intermediaries, and to use these funds to finance development projects. One significant measure was to expand the post office network in rural areas, so that migrants’ families could have closer access to financial services (Douki Reference Douki2001).
As recipients were able to save part of the additional income, the need for savings accounts rose in proportion. This was encouraged by the strategy of many European migrants to spend some years in the New World accumulating enough money to buy a farm or a small business when returning to their countries of origin (Magee and Thomson Reference Magee and Thompson2006b). In Portugal, the surge of new banking institutions was largely related to remittances, but also to so-called ‘Brazilians’, who returned with a large amount of capital (Alves Reference Alves1993).
In Italy too competition between financial institutions was raging, and local operators faced pressures from national banks (Douki Reference Douki2001). Savings banks adapted to this new clientele by offering attractive interest rates and the number of account owners consequently increased: the amount of postal accounts deposits went up from 323 m lire in 1890 to 2108 in 1913 (+553 per cent in 23 years). During the same period, the share of emigrants’ savings in total postal accounts went from 0.03 to 4.4 per cent (authors’ calculations based on ISTAT 1958).
Remittances also helped migrants’ families free themselves from usury, a common practice in rural Europe (Massulo Reference Massulo, de Bevilacqua, Clementi and Franzina2001). Remittances gave rise to an unusual availability of capital that contributed to reducing dependency in two ways. First, direct recipients could use this capital surplus to finance their investment projects, without getting into excessive debt. Second, some people used their new economic situation to lend money with lower interest rates than usurers. The result was a redistribution of economic power that changed local social structures.
3. Sending money home before World War I
3.1. Data
Quantitative information on remittances before World War I is fragmented, both in terms of countries and periods. The existence of micro-data, mainly coming from banks’ or post offices’ balance sheets, helps us to understand better the remitting patterns of emigrants in terms of transfer channels and periodicity. Yet the aggregation of micro-data into macro-series faces several pitfalls:
– First, many migrants remitted money through informal channels, or brought their savings with them when returning home (Wyman Reference Wyman1993). As today, these invisible transfers are difficult to estimate.
– Second, there is no precise information on the number of emigrants who sent money home and for how long.Footnote 2
– Third, not all migrants followed the same pattern when transferring money, which complicates the task of estimating the average amount of remittances by country. This depended, among other factors, on the country where migrants went, their professional activities, marital status and on who travelled with them. In addition, the average amount of remittances differed from one country of origin to another.Footnote 3
Despite these difficulties, several authors provide estimates for some European countries (Austria–Hungary, Italy, Portugal, Spain and the UK) using migration figures and contemporary information on average remittances sent by emigrants (see Appendix A). These studies vary in the amount of direct information extracted from archival sources that they bring to bear on the aggregation problems mentioned above.Footnote 4 Nevertheless, the partly unobservable nature of the transactions we try to measure implies that all estimates of remittances are really just approximations to the actual flows, even today (de Luna Martínez Reference de Luna Martínez2005). Moreover, for other countries there is very little available information and no published estimates. Fully aware of the pitfalls of such an exercise, we estimate new remittance series for four countries (Finland, Greece, Sweden and Norway), by using all available direct information and following, where possible, the methods used by our predecessors.
We can break down this exercise in two steps: first, the estimation of the stock of emigrants abroad likely to remit to country i in year t (Mit); second, the calculation of the average amount of remittances sent by each emigrant  . The total amount of remittances (remit) is then given by:

The stock of emigrants likely to remit money is based on cumulated past migrant inflows. We are aware that not all migrants sent money home, that a certain proportion of them came back after a few years or even months, and that the propensity to transfer remittances tended to decrease with the passing of time. In order to take heed of these facts we first assume that only male migrants between 14 and 44 years old sent remittances. In general, the youngest migrants came with their parents, while the oldest travelled with their children or joined them later thanks to pre-paid tickets (Jerome Reference Jerome1926). Most women who migrated were married or went to the New World to marry settled immigrants. Men were therefore mostly in charge of those left behind.Footnote 5
We then consider, following Morys (Reference Morys2005), Prados de la Escosura (Reference Prados de la Escosura2006) and Simon (Reference Simon and Parker1960), that most migrants sent money home only during the first five years of their stay. After that, they had either returned home or decided to settle permanently. We also take into consideration short-term migration by deducting from the stock of remitters the number of emigrants who had returned to their home countries in previous years. The number of remitters is therefore defined as follows:

where Eit is the annual number of emigrants from country i in year t, μit is the share of male migrants between 14 and 44 years old, and ρi the rate of return to country i.Footnote 6
Then, we calculate the annual level of remittances per remitter from contemporary sources. Since the United States was by far the main destination for the nationals of Greece, Finland, Norway and Sweden (around 95 per cent of Scandinavian emigrants went to the US before World War I), we concentrate on these four countries.
We base calculations on the figures given by different sources to set the total amount of remittances in one or more reference years (see Appendix A). We then use our estimate of the annual number of remitters to calculate the average amount of remittances in each country. We extrapolate these per capita values to other years by calculating an index of the expected nominal wages of immigrants from country i in the US (wit):

where, u it is the unemployment rate in the US, w ust is the nominal wage index in the US, and  is the exchange rate between the dollar and each domestic currency (see Appendix A).
As a result,
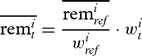
where  and w iref are, respectively, the average amount of remittances to country i and the expected nominal wage index of immigrants in the US in the reference years. In using a single national wage series for the US, we are abstracting from several sources of differentiation across immigrants, according to their education, occupation, country of origin and settlement patterns in the US (Dunlevy and Saba Reference Dunlevy and Saba1992). Although Hatton (Reference Hatton2000) and Hatton and Williamson (Reference Hatton and Williamson2005) provide information on the difference in productivity between native and foreign-born workers in the US, such a measure is only available for 1909 and therefore cannot be used.Footnote 7
As for regional differences, previous research concluded that a well-integrated labour market was already operating by 1880 in the north-east and north-central regions, which absorbed the vast majority of Scandinavian and Greek migrants to the US (Rosenbloom Reference Rosenbloom1996). Since our estimates of remittances depend on the changes in the wage index, differences in wage levels across regions are less of a concern.
Finally, the total amount of remittances in year t is estimated as:

The complete list of remittances series, together with our reconstruction of the stocks of remitters is available from Appendix B. It should be noted that the number of remitters is different from the stock of migrants in the US, as estimated by Hatton (Reference Hatton1995). If we follow his method to interpolate foreign-born populations between census years, we conclude that, on average, 12 per cent of Norwegians and Swedes living in the US remitted money home, compared to 33 per cent of Finns and 59 per cent of Greeks.Footnote 8 By using the 1909 survey of immigrant workers conducted by the US Immigration Commission (1911), we can also estimate the percentage of annual income sent by migrants to their home countries. The figures are: 27 per cent for Swedes, 23 per cent for Greeks, 22 per cent for Norwegians and only 13 per cent for Finns.Footnote 9
3.2. The stylized facts of pre-1914 remittances
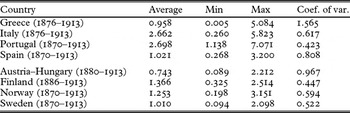
Table 1 contains the descriptive statistics of remittances as a share of GDP between 1870 and 1913 for, respectively, four southern European countries (Greece, Italy, Portugal and Spain) and three Scandinavian countries (Finland, Norway and Sweden) plus Austria–Hungary. In the former group of countries, in particular Greece, Portugal and Italy, the weight of remittances grew to very significant levels. By contrast, remittances had a lower contribution in the second group of countries, never reaching 3.5 per cent of GDP in any year. This happens to be the average estimate of contemporary remittances as a fraction of recipient nations’ GDP in 2006 (IFAD 2007).
Summary statistics of remittances

Note: Values are expressed as a share of GDP.
Source: See text and Appendix A.
The coefficient of variation shows that remittances were more stable in Scandinavia and Portugal than in other countries. Nonetheless, remittances were subject to fluctuations, mainly driven by the changes in the stock of remitters. For most countries this measure explains all the variation in total remittances or even over-explains it.Footnote 10 The exceptions are Norway and Spain, where wage movements explain about 12 per cent of the variation in remittances, and especially Portugal, whose remittance flows were dominated in this period by the swings in the Brazilian exchange rate. This dependence of remittances on migratory flows implies that the former were also generally related to the economic activity in immigration countries, as potential emigrants reacted to the conditions in the labour market in their countries of sojourn. For instance, the US downturn of 1908 brought about a strong increase in unemployment that negatively affected remittances to Europe: between 1907 and 1909, remittances dropped by 11 per cent to Italy, 25 per cent to Sweden, 26 per cent to Norway and 30 per cent to Finland. Similarly, the decrease in remittances to Portugal at the turn of the century (−65 per cent between 1898 and 1902) was largely due to the economic and political problems in Brazil.
Remittances also tended to exhibit a countercyclical role in European economies, which is suggestive of an international risk-sharing motive. A drop in domestic economic activity was sometimes accompanied by an increase in remittances, while faster economic growth at home could be followed by a reduction in flows – of emigrants, and remittances. Thus, the strong increase in GDP in Finland in 1897–8 (+10.4 and +10.1 per cent) came with a drop in remittances of 36 per cent between 1896 and 1898. By contrast, the economic recession of 1901–2 (−1.3 in 1901 and −2.5 per cent in 1902) was followed by an increase in remittances of 98 per cent between 1900 and 1902 (+58 per cent between 1901 and 1902). Likewise, after the depression of the Norwegian economy in 1878 (−11.4 per cent) and 1879 (−6.2 per cent), remittances doubled (1878–80), while the period of economic growth during the second half of the 1890s brought about a significant decrease in remittances. A similar pattern is also manifest in Spain, where the strong economic growth of 1877 (+10.3 per cent) entailed a drop in remittances by 19 per cent. By contrast, the crises of 1889 (−8.2 per cent) and 1910 (−4.9 per cent) were offset by an increase in remittances by 42 and 18 per cent, respectively.Footnote 11
4. Empirical model
We will approach our empirical question, that is, the impact of remittances on pre-1914 European financial development, by estimating variants of the following model:

in which F i,t stands for a measure of financial development of country i in year t, Remi, t is the amount of remittances received from abroad (normalized by GDP), X i, t is a vector of controls, and αi and ϕt are country and time effects, respectively. We lag all independent variables to minimize endogeneity concerns, although we will tackle this problem more fully below.
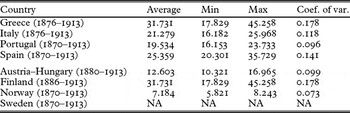
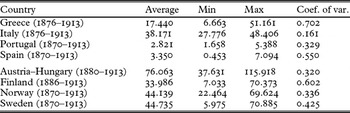
In computing financial development at a macro level, we followed two common measures in the literature on financial development: the ratio between narrow money (M1) and GDP and the ratio between total deposits in the banking system and GDP (King and Levine Reference King and Levine1993; Rajan and Zingales Reference Rajan and Zingales2003). By using measures reflecting the size of the liabilities of the consolidated banking system, we implicitly take the view that banks were the main source of financial development in the eight countries in our sample. This is warranted by the traditional contrast in the literature between the bank-based model of financial development, prevalent on the European ‘Continent’, and the market-based ‘Anglo-Saxon’ financial system (Gerschenkron Reference Gerschenkron1962; Goldsmith Reference Goldsmith1969). To be sure, recent literature has questioned this simple division of financial systems (Fohlin Reference Fohlin2007), but data limitations prevented us from exploring the development of securities markets in the countries included in our sample.Footnote 12 Similarly, we lack data on banking assets (credit) for all but two of the countries. Nevertheless, there is considerable variation in time and, especially, across countries in the two variables we use, of which summary statistics by country are available in Tables 2 and 3. The sources for these and all other variables can be found in Appendix A.
Summary statistics of financial development (M1)

Note: Values are expressed as a share of GDP.
Source: See Appendix A.
Summary statistics of financial development (deposits)

Note: Values are expressed as a share of GDP.
Source: See Appendix A.
Both indicators aim at measuring the penetration of financial services in the economy. Ideally, we would like to further disaggregate our results by the type of financial instruments available to potential remitters, e.g. savings vs demand or time deposits. For some countries we could separate between types of banking institutions (deposits in commercial and savings banks), but not for others.Footnote 13 As a result, we use here an aggregate measure of total deposits – in commercial and savings banks – as a proxy for financial development.
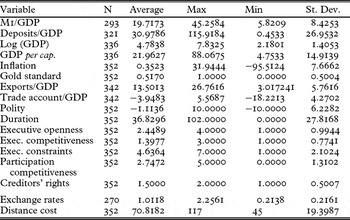
As mentioned, we normalize our principal right-hand side variable of interest, the level of remittances (as estimated in Section 3), by recipient nations’ GDP. In our base model, we consider three groups of controls. First, we control for country size and economic development, the former proxied by the natural log of GDP expressed in pounds sterling, and the latter by per capita GDP, also in sterling. Both variables are included to capture the presumption that the development of financial services has fixed costs, which are more easily defrayed in larger and/or richer nations. The level of per capita GDP may also perhaps account for a time-varying component of domestic institutional quality (not captured by country-fixed effects). We will return to this question in more detail later. A second group of variables controls for the degrees of trade and financial openness. Recent literature has emphasized the positive effects of openness on the development of local financial sectors that can tap into larger pools of savings and acquire superior technology and know-how via FDI (Chinn and Ito Reference Chinn and Ito2002; Errunza Reference Errunza2001; Levine Reference Levine2001). We measure trade openness as the export share of GDP and financial openness by the trade account, also normalized by the recipient country's GDP.Footnote 14 Finally, we include a third group of variables that account for the well-known negative link between monetary instability (domestic and external) and financial development (Boyd et al. Reference Boyd, Levine and Smith2001). Participation in the gold standard and inflation rates are the indicators used for this purpose (Battilossi Reference Battilossi2006; Carosso and Sylla Reference Carosso, Sylla, Carmeron and Bovykin1991). The summary statistics of the covariates are reported in Table 4. As we do not have information on all variables for all countries over the whole period, our estimation will be based on unbalanced panels.Footnote 15
Summary statistics of covariates and instruments

Notes: Exchange rates are a weighted index of exchange rates of destination currencies against sterling, used as instrument (base 1913 = 1). The distance cost is Isserlis's (Reference Isserlis1938) index of tramp shipping freight, also used as instrument (base 1869 = 100).
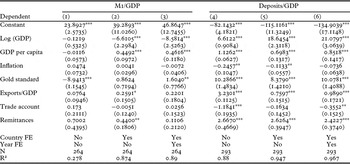
The first set of results for this model can be read from Table 5. The estimation method is pooled OLS with robust standard errors. We also adjusted the model using panel techniques (within estimators) but the point estimates (and significance levels) of the coefficients were virtually identical to the pooled model because the panel variance component was consistently insignificant.
Results (base model)

Notes: Robust standard errors in parentheses. ***indicates significance at 1%, **at 5%, *at 10%.
The control variables generally behave as expected. Richer nations exhibit higher levels of financial development. The size of the economy also has the expected positive impact, except when we measure financial development by narrow money, which, however, is probably not the best proxy, as it excludes some of the sources of longer-term financing by banks (time and savings accounts). Inflation is detrimental to financial development, but loses significance once we introduce country and time effects. Monetary stability, proxied by the participation in the gold standard, does have the predicted (and sometimes very strong) positive effect on financial development. Openness also shows up with the expected sign, both when measured by export intensity and the trade account. The estimated effect is again weaker in specifications that use M1 as dependent variable.
The size of remittances has a clear impact on financial development with some revealing patterns. The size of the coefficient is much larger when using total deposits as the left-hand side variable than M1. This implies that emigrant money was channelled into the financial sector primarily through longer-maturity accounts. Interestingly, the size of the coefficient of remittances is consistently larger than the estimated impact of aggregate capital flows, as measured by the trade account balance. Although it is difficult to distinguish between remittances (an item of the current account) and the items of the financial account, the smaller coefficient of the latter implies that other capital inflows (portfolio or FDI) contributed less to the development of the domestic financial sector than remittances. These estimates are also larger than the evidence on contemporary trends. Indeed, we estimate a marginal effect of the ratio deposits/GDP to remittances of about 2.4 to 2.7, while Aggarwal et al. (Reference Aggarwal, Demirgüç-Kunt and Martínez Pería2006), using a sample of 99 developing nations between 1975 and 2003, find an effect of only 0.5 to 0.6.
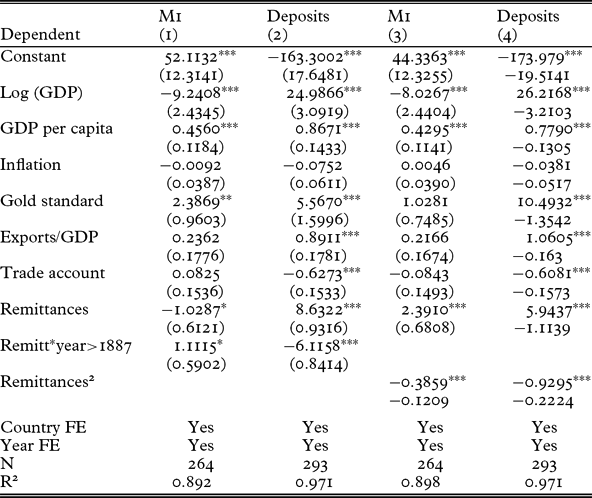
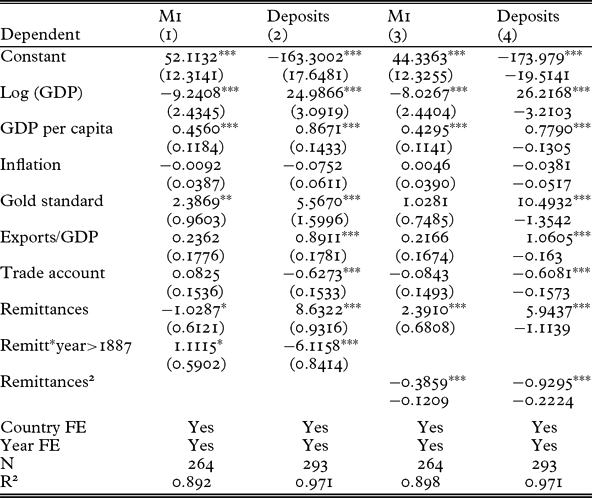
We now consider two variations on this model. The first one explores the possibility that the effect of remittances on financial development may be non-linear. Table 6 re-estimates the full model with country and time effects for two alternative non-linear specifications. In columns (1)–(2) we introduced an interaction term for the level of remittances to mark the period when this level rose above 1 per cent of GDP in our sample of countries (1888 onwards). Some evidence of threshold effects for the impact of remittances is found in contemporary and historical literature (Bugamelli and Paternò Reference Bugamelli and Paterno2006; Esteves and Khoudour-Castéras Reference Esteves and Khoudour-Castéras2009). In columns (3)–(4) we simply added a quadratic remittances term.
Results (nonlinearities)
Notes: Robust standard errors in parentheses. ***indicates significance at 1%, **at 5%, *at 10%.
Both variants testify to substantial nonlinearities whereby the impact of remittances on financial development abated over time or as the country became richer. Irrespective of the choice of dependent variable (M1 or total deposits), the results in columns (3) and (4) imply a maximum impact of remittances on financial development when they are in the proximity of 3 per cent of GDP. The results for the remaining controls are not qualitatively changed.
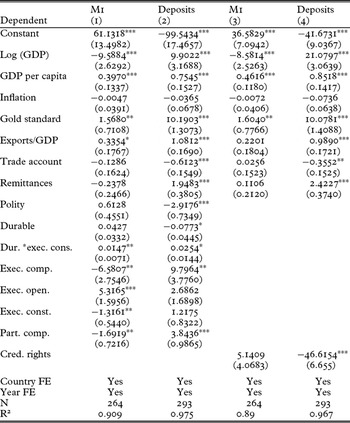
The second variation extends the base model by directly including indicators of local institutional quality. In so doing we are once more limited by the availability of data, in this case, by the relative difficulty in finding historical measures of the quality of economic institutions. Consequently, the bulk of variables added to the models of columns (1)–(2) in Table 7 refer to political institutions. We extracted six variables from the Polity IV database: the polity democracy score; the durability of political regimes (in years since last change); three scores referring to the executive power – constraints (Exec. const.) on the exercise of this power, competitiveness (Exec. comp.) and openness of nomination (Exec. open.); and a final score for the degree of competitiveness in political participation (Part. comp.). One would expect a positive association between the five scores and measures of financial development, along the lines of the political economy of financial regimes (Haber et al. Reference Haber, Razo and Maurer2003). Because the relation between tenure and institutional quality is unclear, we also interacted the duration of the political regimes with the measure of executive constraints.
Results (political and economic institutions)

Notes: Robust standard errors in parentheses. ***indicates significance at 1%, **at 5%, *at 10%.
In Table 7, the coefficient of remittances is still strongly significant and has a size very similar to Table 5. The political markers generally have correct signs. Stability of political regimes also shows up as having a negative impact on its own on financial development. However, when interacted with the index of constraints on the executive it is marginally positive, which suggests that except with the worst possible political institutions, the tenure of political regimes did affect the levels of financial development.Footnote 16 The only counterintuitive results are those of the model for M1, which reinforces our doubts about the usefulness of this variable as an indicator of financial development.
In the last two columns we experimented with a model controlling for the quality of economic institutions. Since we do not have historical measures, we included a popular contemporary measure of economic institutions – the index of creditors' rights compiled by Djankov et al. (Reference Djankov, McLiesh and Shleifer2006). Given that all nations in our sample come from a civil law tradition, we cannot investigate the related hypothesis about the persistence of ‘legal origins’ (La Porta et al. Reference La Porta, Lopez de Silanes, Shleifer and Vishny1997). Nonetheless, if we are to interpret the results of the coefficient on creditors' rights based on information collected almost a century after our sample period, we need to assume a remarkable degree of persistence in the quality of legal orderings dealing with economic activity. Since this is not the topic of this article, we only notice the very large estimates for this coefficient, which, however, do not affect the direct impact of remittances on financial development. The sign of the coefficient on contemporary creditors' rights is also counterintuitive in the case of the regression for deposits.
4.1. Outliers and endogeneity
There are two main concerns to address in running our model. First, with a small sample in the cross-section dimension we need to worry about the possibility that the results are driven by outlier observations. We took this into consideration by using Li's (Reference Li, Hoaglin, Mosteller and Tukey1985) robust estimation method. The results (unreported here) are virtually similar to the base estimates of Table 5. We also tried excluding countries (one at a time), without affecting the tenor of the results
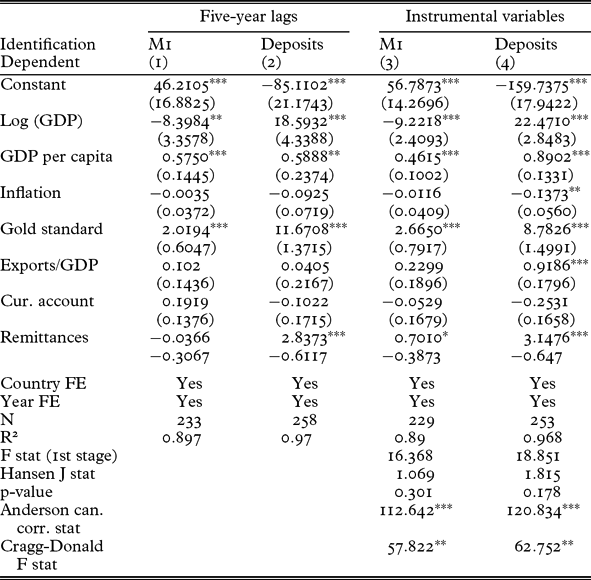
A more significant concern has to do with the potential for reverse causality and measurement error. Better domestic financial institutions might actually attract more remittances. As already mentioned, many specialized banks were created in this period to attract or improve the efficiency in money transfer. Measurement error could have been introduced by the method used to estimate four of the remittances series, as described in Section 3. It can also follow from the hypothesized reverse causality, as it is not clear whether better financial institutions actually increased the volume of remittances or just diverted a greater share from informal conduits (hard to estimate accurately) to formal and more quantifiable channels. We take heed of these joint concerns through two methods. We initially lag all independent variables by five years, hoping that the passage of time allows us to identify the correct direction of causality. Because the relation between independent and dependent variables may act with some lag, we confirm our results by using instrumental variable estimation.
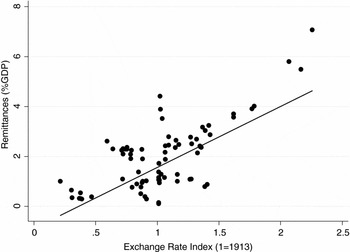
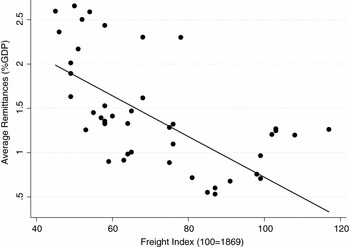
In this specification, remittances are instrumented with measures of economic opportunities in the countries of destination and a proxy for the costs of emigration. The first instrument is an index of the exchange rate of the recipient countries’ currencies against sterling. The rationale for this variable is that emigrants sometimes postponed sending money when the currency of their country of adoption depreciated significantly – in expectation of a future recovery (Esteves and Khoudour-Castéras Reference Esteves and Khoudour-Castéras2009). In a world increasingly dominated by the gold standard (a regime with mean-reverting exchange rates), such expectations were probably rational in the context of an inter-temporal decision-making process. As a matter of fact, Figure 1 suggests a strong relation between exchange rate movements and remittance flows. We weight the currencies comprised in this index by the share of the main destination countries in each nation's emigration flows, as gathered by Ferenczi and Wilcox (Reference Ferenczi and Willcox1929). The second instrument is a measure of the cost of distance, namely an index of tramp shipping freights compiled by Isserlis (Reference Isserlis1938). As imperfect a proxy of the costs of transatlantic migration as this may be, it has a strong and negative relation with remittances (Figure 2).
Remittances (share of GDP) and weighted exchange rate indices, 1870–1913

Remittances (share of GDP) and freight index, 1870–1913

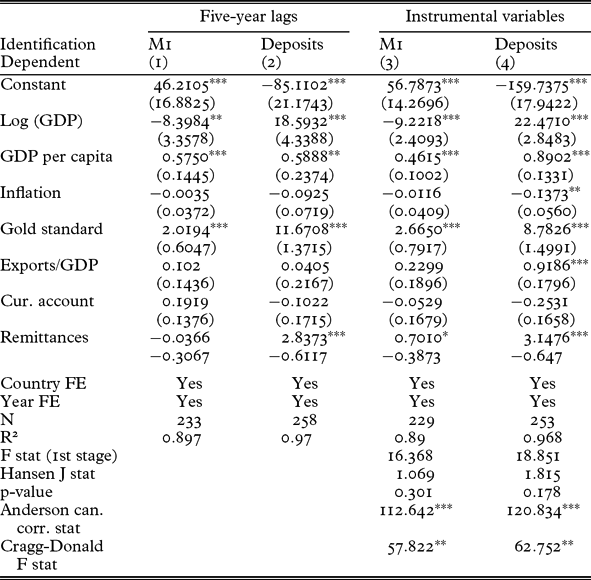
Table 8 reports the results for this model adding five lines – for R2 of the first stage regression, Hansen's J statistic of overidentification, Anderson's canonical correlation statistic (relevance of instruments), and for the Cragg–Donald test of weak instruments. Our instruments pass the tests of exogeneity, relevance and weak instruments.Footnote 17
Results (causality)
Notes: Robust standard errors in parentheses. ***indicates significance at 1%, **at 5%, *at 10%.
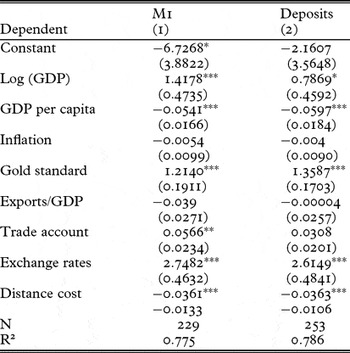
Both identification methodologies sustain the positive and significant impact of remittances on measures of financial development, with the coefficients rising in value and significance relative to the base model. Table 9 details the first stage results of the IV estimation, which confirm the strong relation between the remittance level and our instruments. Furthermore, the fact that the IV estimate of the remittances effect is larger than the OLS also provides some evidence in favour of the substitution hypothesis between remittances and local financial development. According to these results, the real causal effect of remittances on financial development is underestimated by OLS due to the negative partial reverse effect of financial and economic development on the flow of remittances. In any case, the complementarity between remittance flows and local financial development clearly outweighs the substitution effect.
First stage results of IV estimation

Notes: Robust standard errors in parentheses. ***indicates significance at 1%, **at 5%, *at 10%. Exchange rates are a weighted index of exchange rates of destination currencies against sterling, used as instrument (base 1913 = 1). The distance cost is Isserlis's (Reference Isserlis1938) index of tramp shipping freight (base 1869 = 100).
5. Conclusion
The evidence in this article furthers our understanding of the economic role of remittances during the age of mass migration. Other than the effects on the demographic composition of the labour force, wage convergence, consumption and savings patterns, and financial stability, we confirm the positive influence of remittances on domestic financial development. The more-than-proportional estimate of their impact on measures of the penetration of financial services also underscores the relative size of this impact, as compared with the (less-than-proportional) effect from other foreign financial flows. This result is remarkably stable across alternative modelling scenarios and when controlling for potential endogeneity and measurement error in our estimates of aggregate remittances.
Our measured results are also larger than the best estimates for the contemporary effect of remittances. The marginal effect of the ratio deposits/GDP hovers between 2 and 3 in our sample, compared to 0.5/0.6 in Aggarwal et al. (Reference Aggarwal, Demirgüç-Kunt and Martínez Pería2006), despite the fact that the ‘emerging economies’ of the nineteenth century started the build-up of their financial sectors from levels of development similar to present-day large recipients of remittances.Footnote 18 Part of the difference may be due to sample composition effects, as the recent study includes emerging economies but also less-developed nations that have had a harder time at building up their financial sectors and are less open to foreign capital.
But it is likely that the potential for positive spillovers is limited today by restrictive immigration policies, which pre-1914 peripheral European nations (unlike Asian countries) were relatively spared. Our findings suggest that public authorities in today's developing countries should try to maximize the impact of remittances by adopting policies aiming at promoting financial democracy, that is, policies that facilitate the access to bank services, provide information about the remittance market, and ensure greater transparency in the financial system (Orozco and Fedewa Reference Orozco and Fedewa2006; Terry and Wilson Reference Terry and Wilson2005). Insofar as financial development has positive repercussions in terms of economic growth, such policies should also contribute to accelerating the catch-up process of emigration countries.
Acknowledgements
The opinions expressed and arguments employed in this article are the sole responsibility of the authors and do not necessarily reflect those of the OECD or of the governments of its member countries. The authors would like to thank the editors, two anonymous referees, and the participants at the 24th Annual Congress of the European Economic Association, Barcelona, the 8th Conference of the European Historical Economics Society, Geneva, the 58th Meeting of the French Association of Economic Sciences (AFSE), Nanterre, and at seminars in the Universities of Geneva and Lille for helpful comments. The authors are also grateful to Agnès Bénassy-Quéré, Martine Carré-Tallon, Marc Flandreau, Olena Havrylchyk and Marc Weidenmier for valuable comments on previous drafts; and to Rita Hjerppe, George Kostelenos and Ilkka Lavonius for generous sharing of data. The usual disclaimer applies.
Appendix A: Data sources
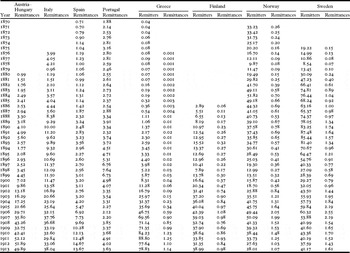
Remittances series were already available for four countries in our sample: Austria–Hungary and Italy (Morys Reference Morys2005), Portugal (Mata Reference Mata and Matos Campos2002) and Spain (Prados de la Escosura Reference Prados de la Escosura2006). The series for Finland, Greece, Norway and Sweden were estimated from information on stocks of remitters in the US, the amounts sent per remitter from the US in reference years, and on US wages converted to local currencies. The information on emigration flows to build up the stocks comes from Ferenczi and Wilcox (1929) for all countries except Greece (Carter et al. 2006). The reference values for the average amount of money sent per remitter were established from the following sources:
– For Greece, Mears (Reference Mears1923) estimates that in 1913 29 m drachmae entered the country as remittances. To recover the per remitter amount, we divided this value by our estimate of the stock of Greek remitters in 1913.
– For Finland, Bärlund (Reference Bärlund1992), based on information from Hoppu (Reference Hoppu1920), gives figures of remittances sent, both formally and informally, by Finnish emigrants from Canada and the United States between 1909 and 1913. The average annual amount of remittances was 21.9 m markkaa during this period and we extrapolated this average to the years before 1908.
– For Norway and Sweden, we used information on two reference years. The US Immigration Commission (1911, vol. 37) contains an estimate of the total remittances sent by ‘Scandinavians’ in 1907 (25 m dollars). The same source breaks down this amount by banks, international money orders, and an adjustment based on extra ‘figures obtained from reliable sources’ (p. 276). In apportioning this total amount by the emigrants of the two countries, we followed three steps. (1) We divided the common value of banking remittances according to information on the per remitter amount of banking transfers gathered by the Commission from a sample of banks. This amount is practically identical for the two nationalities: $29.77 for the Norwegians and $25.03 for the Swedes. (2) We added up the values of international money orders, which were reported by country instead of ‘race’. (3) We applied the same proportional adjustment used by the reporters of the Commission to convert the visible amounts to the total remittances. Lastly, Beckman (Reference Beckman1883; quoted by Hovde Reference Hovde1934) estimates, using data from American banks, that Sweden received around 3 m dollars (11.2 m kronor) in 1882. Given the similarity in the per remitter amounts in 1912 between Norway and Sweden, we used the same imputed per remitter amount in 1882 for Norway.
Data on US wages come from Williamson (Reference Williamson1995), adjusted by unemployment rates from Romer (Reference Romer1986) and Vernon (Reference Vernon1994).
Exchange rates (number of local currency units per pound sterling) were calculated from Schneider et al. (Reference Schneider, Schwarzer and Zellfelder1991) and Flandreau and Zumer (Reference Flandreau and Zumer2004), with the following exceptions: Autio (Reference Autio1992) for Finland; Lazaretou (Reference Lazaretou1993) for Greece; Eitrheim et al. (Reference Eitrheim, Klovland and Qvigstad2004) for Norway; and Carreras and Tafunel (Reference Carreras and Tafunel2005) for Spain. For Sweden we used the series prepared by Håkan Lobell and available from the Bank of Sweden website at: www.riksbank.se/templates/Page.aspx?id=27402
Money supply (M1) series (m of local currency units) were obtained from Komlos (Reference Komlos1987) for Austria–Hungary; Kostelenos et al. (Reference Kostelenos, Vasiliou, Kounaris, Petmezas and Sfakianakis2007) for Greece; Reis (Reference Reis1990) for Portugal; Carreras and Tafunel (Reference Carreras and Tafunel2005) for Spain. Data for Finland were kindly provided by Jaakko Autio. For Norway we used the M0 series listed in Eitrheim et al. (Reference Eitrheim, Klovland and Qvigstad2004) since the authors comment that demand deposits were but a small portion of the total money stock (around 2 per cent of M2) before 1914. De Mattia (Reference De Mattia1990) follows similar arguments in applying a definition of M1 that is actually closer to M0. We use his series for Italy. We were not able to find a M1 series for Sweden.
Deposits in commercial banks (m of local currency units) were collected from Komlos (Reference Komlos1987) for Austria–Hungary; Mitchell (Reference Mitchell2003) for Finland, Spain and Sweden; Kostelenos et al. (Reference Kostelenos, Vasiliou, Kounaris, Petmezas and Sfakianakis2007) for Greece; Cotula (Reference Cotula1996) for Italy; Eitrheim et al. (Reference Eitrheim, Klovland and Qvigstad2004) for Norway; and Reis (Reference Reis1990) for Portugal.
Deposits in savings banks (m of local currency units) have the same sources except for Austria–Hungary (Mitchell Reference Mitchell2003) and Finland, for which we used statistics kindly communicated by Risto Herrala and Vappu Ikonen. There is also no series for Portugal.
Nominal GDP figures (in m local currency units) were gathered from Flandreau and Zumer (Reference Flandreau and Zumer2004) for Austria–Hungary; Hjerppe (Reference Hjerppe1989) for Finland; Kostelenos et al. (Reference Kostelenos, Vasiliou, Kounaris, Petmezas and Sfakianakis2007) for Greece; ISTAT (1957) for Italy; Mitchell (Reference Mitchell2003) for Norway; Nunes et al. (Reference Nunes, Mata and Valério1989) for Portugal; Carreras and Tafunel (Reference Carreras and Tafunel2005) for Spain; and Johansson (Reference Johansson1967) for Sweden.
Population series (thousands) were taken from Mitchell (Reference Mitchell2003) for Austria–Hungary; Maddison (Reference Maddison2003) for Finland, Italy, Norway and Sweden; Kostelenos et al. (Reference Kostelenos, Vasiliou, Kounaris, Petmezas and Sfakianakis2007) for Greece; Valério (2001) for Portugal; and Carreras and Tafunel (Reference Carreras and Tafunel2005) for Spain.
Foreign trade statistics (in m local currency units) were taken from Mitchell (Reference Mitchell2003) with the following exceptions: Finland (Hjerppe Reference Hjerppe1989); Portugal (Valério 2001); and Spain (Carreras and Tafunel Reference Carreras and Tafunel2005).
Inflation was calculated from price series (usually GDP deflators) taken from Flandreau and Zumer (Reference Flandreau and Zumer2004) for Austria–Hungary; Hjerppe (Reference Hjerppe1989) for Finland; Kostelenos et al. (Reference Kostelenos, Vasiliou, Kounaris, Petmezas and Sfakianakis2007) for Greece; ISTAT (1957) for Italy; Michell (2003) for Norway; Valério (2001) for Portugal; Carreras and Tafunel (Reference Carreras and Tafunel2005) for Spain; and Johansson (Reference Johansson1967) for Sweden.
Gold standard participation was coded from Flandreau and Zumer (Reference Flandreau and Zumer2004) and Meissner (Reference Meissner2005).
Political variables were taken from the database of the Polity IV project available at: www.systemicpeace.org/polity/polity4.htm
Creditors rights is an index compiled by Djankov et al. (Reference Djankov, McLiesh and Shleifer2006) available at: www.economics.harvard.edu/faculty/shleifer/dataset
Exchange rates (instruments) for the USA, France, Austria–Hungary, Argentina and Brazil were taken from Flandreau and Zumer (Reference Flandreau and Zumer2004).
Remittances and number of remitters, by nationality

Notes: Remittances in m pounds sterling; remitters in thousands. The Greek remittance series is shorter than the stock of remitters because we only have drachmae exchange rates after 1875 from Lazaretou (Reference Lazaretou1993).
Sources: See Appendix A.