Implications
The vocalisation sounds in broiler chickens, reared under intensive farm conditions, may have potential to be used as a tool to improve their health and welfare status. Precision livestock farming (PLF) develops management tools aimed at continuous automatic monitoring of animal welfare, health, environmental impact and production in real-time. Audio analysis, decision making informed by audio information and prediction and avoidance of health, welfare and disease through use of automated measures in PLF may have the potential to have positive effects on animal health and welfare and consequently on public opinion with regard to maintenance of animal health and welfare in poultry farming systems.
Introduction
Farming systems for rearing chickens for meat have changed significantly during the last 40 years. Broiler chickens now have a very rapid growth rate, high feed conversion efficiency and high processing yields. Commercial production birds are created through the use of hybrid genotypes (Rizzi et al., Reference Rizzi, Contiero and Cassandro2013); and genetic selection has led to progressively reduced slaughter age and higher final weight (Rauw et al., Reference Rauw, Kanis, Noordhuizen-Stassen and Grommers1998; Aerts et al., Reference Aerts, Van Buggenhout, Vranken, Lippens, Buyse, Decuypere and Berckmans2003).
The global production of broiler chickens is estimated to be of the order of 61 billion animal slaughtered per year according to FAOSTAT 2015; 70% of world production of broiler chickens is ‘industrialised’ (Steinfeld et al., Reference Steinfeld, Gerber, Wassenaar, Castel, Rosales and de Haan2006; Tefera, Reference Tefera2012), that is, reared in closed housing systems provided with artificial lighting and under a timed lighting programme (Appleby et al., Reference Appleby, Hughes and Elson1992; Weeks and Butterworth, Reference Weeks and Butterworth2004). Chicken health, welfare and growth performance is dependent on human management, environmental management, genetics, nutritional and disease factors (Yahav et al., Reference Yahav, Shinder, Tanny and Cohen2005; Buijs et al., Reference Buijs, Keeling, Rettenbacher, Van Poucke and Tuyttens2009; Kenny et al., Reference Kenny, Corkery and Ward2012). Progress has been made in the last 10 years to develop indices and potential on-farm measures of animal welfare, for example, the AWIN (2015) and Welfare Quality (2009) protocols. It is apparent that no one single measure sufices animal health and welfare and is currently common to use a number of different indicators of health, welfare and animal experience to provide a ‘holistic’ assessment of animal welfafe (de Jong et al., Reference de Jong, Berg, Butterworth and Estevéz2012). Assessment of animal behaviours may be one of the measures used in these multi aspect assessments of welfare. Assessment of behaviours may provide indirect evidence of how an animal ‘feels’ (Dawkins, Reference Dawkins2004). Animals use vocalisations to express different conditions such as: warning, alarm, social contact, territorial, laying, nesting, mating, threat, submissive, distress, fear, contentment, food, dust bathing, perching, battle cries, privacy, dominance and time calls (Manteuffel et al., Reference Manteuffel, Puppe and Schön2004; Tefera, Reference Tefera2012; Vandermeulen et al., Reference Vandermeulen, Bahr, Tullo, Fontana, Ott, Kashiha, Guarino, Moons, Tuyttens, Niewold and Berckmans2015). One of the potential ways to assess an animal’s health and welfare status is the analysis of audio and video to identify behaviours, vocal and other sound producing behaviours.
Hearing is an important sense for birds; they are sensitive to a frequency range of about 60 to 11 950 Hz (Appleby et al., Reference Appleby, Hughes and Elson1992; Tefera, Reference Tefera2012).
In the wild, chicks which have just hatched are able to identify their mother and their siblings (Appleby et al., Reference Appleby, Hughes and Elson1992; Nakamori et al., Reference Nakamori, Maekawa, Sato, Tanaka and Ohki-Hamazaki2013); 1-day-old chicks can recognise and discriminate maternal vocalisations from sounds emitted by other conspecifics (Ferrante and Lolli, Reference Ferrante and Lolli2009; Tefera, Reference Tefera2012). Social behaviour is the behaviour displayed by animals in relation to other animals, and social interaction in chicks is likely to be important for group development. The first days of a chick’s life are likely to be an important period for the development and the acquisition of a correct behavioural pattern (Ferrante and Lolli, Reference Ferrante and Lolli2009). Vocalisation is strongly dependent on social context in chicks; they vocalise at the very beginning of their life in the hatchery, and there is evidence that this vocalisation (from within the egg) is linked to acceleration of the physical development of other chicks, in order to synchronise hatching (Ferrante and Lolli, Reference Ferrante and Lolli2009).
Principal objectives of precision livestock farming (PLF) include the development of automatic on-line monitoring tools (Guarino et al., Reference Guarino, Jans, Costa, Aerts and Berckmans2008) to monitor animals’ behaviours and their biological responses to external stimuli such as changes in house environment conditions, or to occurrence of disease (Tefera, Reference Tefera2012). The analysis of images and sound, can be carried out in comparatively non-invasive ways using PLF methods, and, when compared to direct human visual observation, may be less time consuming (Aydin et al., Reference Aydin, Bahr, Viazzi, Exadaktylos, Buyse and Berckmans2014; Fontana et al., Reference Fontana, Tullo, Butterworth and Guarino2014). Camera and microphone systems could result in innovative ways to monitor farm animals, and may eventually become quite low in cost as the trend is for electronic devices to become more cost effective with time. Automated animal monitoring with images or sounds could potentially be used to support farmers in achieving farm production, and animal health and welfare goals (Costa et al., Reference Costa, Ismayilova, Borgonovo, Leroy, Berckmans and Guarino2013) and have potential for wide application in animal husbandry (Halachmi et al., Reference Halachmi, Metz, Van’t Land, Halachmi and Kleijnen2002; Ismayilova et al., Reference Ismayilova, Costa, Fontana, Berckmans and Guarino2013). The PLF approach has potential to be applied at different scales, from the individual animal, to the entire flock/herd, and to assess environmental and animal health, welfare and management (Wathes, Reference Wathes, Aland and Madec2009).
A potential added value of PLF may be the capability to provide ‘prediction’ (such as health and welfare status, production, growth trend); integrated systems might help the farmer in taking positive action in response to warnings. Monitoring equipment (cameras, microphone, feed and water monitors, environment monitors) associated with predictive algorithms could be part of a management tool used by the producer to detect, and improve, health and welfare issues. In this study, sound analysis techniques are explored as a PLF application (Manteuffel et al., Reference Manteuffel, Puppe and Schön2004; De Moura et al., Reference De Moura, Nääs, ECDS, De Carvalho, Do Vale and De Lima2008) and are used to measure and analyse animal sounds in order to discriminate and classify specific vocalisation in poultry houses. The objectives of this study were (a) the identification and characterisation of vocalisations emitted by chicks during their first 5 days of life under normal farm conditions; (b) examination of the possible connections between specific individual sounds and social behaviours and (c) characterisation of possible vocalisation changes in terms of frequency and type of sound emitted with increasing age.
Material and methods
Two experimental trials were carried out at an indoor reared broiler farm; the first took place in June and July 2013 (trial 1) and the second in August and September 2013 (trial 2). The farm where the experimental trials took place was an indoor broiler farm rearing birds to the UK Red Tractor Farm Assured (ACP) standard. The house dimensions were 61×21 m and the total floor area available to the birds was 1130 m2. Inside the house 2340 nipple drinkers and 385 feed pans were available to the birds, and 27 940 1-day-old chicks were placed in the house in both trials.
Animal sounds were recorded for 1 h, at intervals of 2 days, from day 1 to day 38 of the chick’s life (from the beginning to the end of the cycle of production), using a handheld solid state audio recorder Marantz PMD 661 MK II (Hampshire, UK). The device was connected to two directional microphones placed at a variable height of between 0.4 and 0.8 m (depending on the height of the animals during growth in order to keep the same distance – ~0.3 m – between the animals and the microphones throughout the data-collection process). Recordings were made with the same positioning of the microphones in both trials. The Marantz PMD 661 MK II recorder has a large range of potential recording settings. The settings found to give the most sensitivity to bird sounds in the poultry house environment were: Rec. Format: PCM-16, Stereo Sample Rate: 44.1 k; Level Control: Manual; Low Cut: Off; High Cut: Off.
Microphone 1 (MIC 1) was a supercardioid/lobe microphone (Sennheiser K6/ME66 – frequency response: 40 to 20 000 Hz±2.5 dB) (Sennheiser Elecronic Corporation, USA) and this was supported on a short tripod microphone stand Quiklok A341 (U.S. Music Corp., Buffalo Grove, USA) above the feeder. Microphone 2 (MIC 2) was a more diffusely focussed Sennheiser K6/ME64 (frequency response: 40 to 20 000 Hz±2.5 dB) (Sennheiser Elecronic Corporation, USA) and was placed on a long tripod arm, Quiklok A492 Heavy-Duty Boom Mic Stand (U.S. Music Corp.) directly above the drinkers. Both the microphones were slightly inclined toward the floor in order to capture preferentially the sounds coming from birds in front of the microphone axis. The recordings provided both a localised sound picture (MIC 1) and a more generalised sound including background noise (MIC 2), and this combination of microphones was found to provide the best results in capturing sounds within the broiler house where the chicks tended to cluster ‘in groups’ classified as house sounds (HS). At the same time as the sound recordings were being made, video recordings were acquired by placing a digital video camera on a low-level tripod focussed on the area where the birds were most active and in the locality of the microphones. After each period of continuous recording, three chicks, chosen at random, were moved into an enclosed ‘shielded recording area’ (30 cm high box with an area of 0.8 m2), in order to collect individual bird sounds of ‘isolated’ chicks by shielding the microphone from background environmental noise. The chicks were individually placed into the separation box at times 0 (chick 1), 1 min later (chick 2) and 2 min later (chick 3); 5 min of recording box sounds (BS) were initiated when the first chick was placed in the box. Simultaneously with the BS audio recordings video recordings were made, positioning the video of the chicks inside the box, and also of chicks in the area just outside the box. After 5 min of recording, the barrier was removed and the chicks were returned to the flock.
The final sound ‘library’ consisted of 27 h 24 min of sound recordings for trial 1 and 27 h 56 min of sound recordings for trial 2. It was decided to analyse and manually label the vocalisations recorded with MIC 1 (bird focussed) due to the higher quality of the sounds compared with the ones recorded with MIC 2 (background focussed). In this study, the sounds (HS and BS) recorded during Day 1 and Day 5 in both trials have been analysed. Day 1 and Day 5 were chosen in order to provide a time interval appropriate to examine the difference of the sounds emitted within the first week of the birds life.
Sound and image analysis
Sound recordings were manually analysed offline and labelled using sound analysis software: Adobe® AuditionTM CS6. Sound labelling involved the extraction and classification of both individual ‘isolated’ animal sounds (BS) and general sounds coming from the whole flock (HS). Analysis examined amplitude and frequency of the sound signals in audio files, each file being manually labelled using a procedure based on acoustic analysis combined with visual spectral analysis, used to extract recognisably distinct and characteristic sound patterns from the entire recording file.
Every hour long digital recording was cut in shorter labelled files of 10 min duration in order to facilitate the sound analysis and the labelling procedure. The sound analysis was divided into two different phases. First, the file was examined (listened to with high frequency response headphones) in its entirety in order to recognise the regions of the recording with the clearest sounds. During the ‘listen through’, the regions of the recording with the clearest sounds were then digitally marked (flagged) in order to classify different types of sound. The methodology for the labelling procedure and the sound analysis is that described by (Marx et al., Reference Marx, Leppelt and Ellendorff2001).
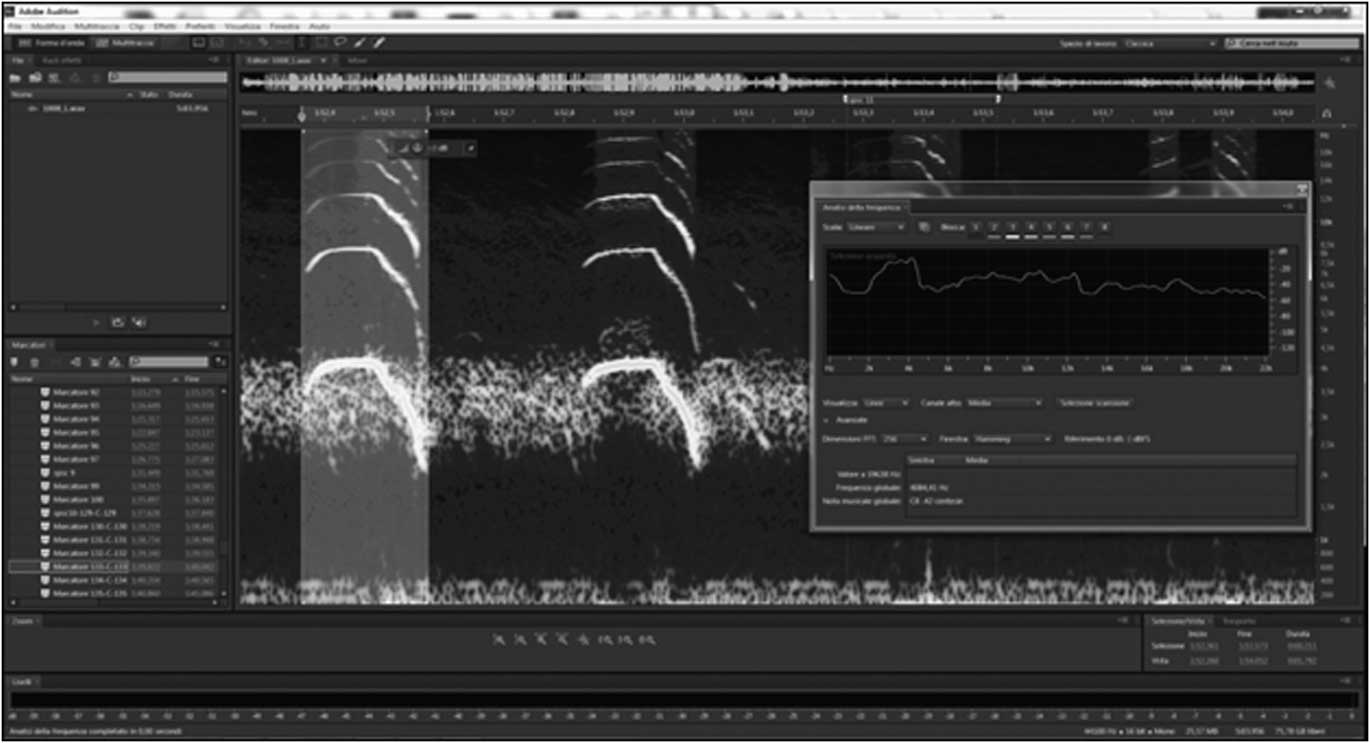
The labelling procedure was carried out offline, identifying those sounds that the operator classified as significant vocalisation sounds through the combination of auditive analysis (listening with headphones) and the visual observation of the spectrogram of the sounds corresponding to each sound ‘group’ (Ferrari et al., Reference Ferrari, Silva, Guarino, Aerts and Berckmans2008). Through Adobe® AuditionTM CS6, a number of discrete sound ‘groups’ were identified and analysed using time (x-axis) and frequency (y-axis) for further statistical comparisons. A fast fourier transform (FFT) was used to perform the frequency analyses using a Hamming window with a FFT dimension of 256 (Figure 1).
Screenshot of Adobe® AuditionTM CS6 software. Spectrograms and frequency analysis of an extracted sound.

Figure 1 shows the spectrogram of a labelled vocalisation. The time is reported on the x-axis and the frequency on the y-axis. Bright areas indicate sounds with high energy. The small box on the right shows the frequency analysis of the marked sound on the left.
The mean duration, the mean interval and the number of repetitions of each kind of vocalisation were collected. For both HS and BS, the peak frequency (PF=representing the frequency of maximum power) was manually extracted. The frequency range was band pass filtered between 1000 and 13 000 Hz. The lower frequency limit was set at 1000 Hz to remove the low frequency background noise and the upper limit was set at 13 000 Hz to cut off high frequency noise and also because broilers are sensitive to a frequency range of about 60 to 11 950 (Appleby et al., Reference Appleby, Hughes and Elson1992; Tefera, Reference Tefera2012).
Video and sound recordings were synchronised during the labelling procedure in order to link the behaviours to the sounds emitted by the animals.
Statistical analysis
Statistical analysis was performed using statistical software SAS 9.3. The difference in PF of HS and BS recorded during Day 1 and Day 5 were tested using a paired t-test in order to evaluate whether there were statistically significant changes in vocalisation PF related to different days and situations (isolated/in group).
Paired sample t-tests were made to compare the PF of vocalisations emitted by the chicks in six specific situations:
-
a) BS collected in Day 1 and in Day 5 (BS1-BS5).
-
b) HS collected in Day 1 and in Day 5 (HS1-HS5).
-
c) BS and HS collected in Day 1 (BS1-HS1).
-
d) BS and HS collected in Day 5 (BS5-HS5).
-
e) BS collected in Day 1 and HS collected in Day 5 (BS1-HS5).
-
f) BS collected in Day 5 and HS collected in Day 1 (BS5-HS1).
Statistical analysis of sounds was performed using the clearest vocalisations (the loudest, the ‘clearest’ and with the highest energy) found during the labelling procedure of recordings made on Day 1 and Day 5. The final dataset consisted of 60 BS (isolated chicks) sound files, and 136 sound files from HS.
The correlations between BS and HS were evaluated to identify whether chicks emitted specific sounds on a specific day (1 or 5) or specific sounds during a stress situation (isolated or in group). A further comparison among the different BS sounds was first performed analysing the spectrogram of each sounds (visual analysis) and then using the PDIFF (differences between least squares means) option in the GLM procedure of SAS to verify their similarity/dissimilarity (SAS User’s Guide, 2010).
The differences between the PF of the vocalisations emitted by the birds were tested using the proc TTEST (SAS 9.3). The t-test and the PROC LOGISTIC (SAS 9.3) were also used to explore potential associations between the isolation sounds (BS) and the vocal behaviour of the chicks outside the box in response to the vocalisations of chicks within the box. The contrast statement in PROC LOGISTIC was used to determine which isolation BS sounds had most affect on the response of the chicks outside the box.
Logistic regression was considered an appropriate analysis, because the chicks’ response in this study consisted of dichotomous, categorical variables, for example, presence or absence around the box. It should also be noted that logistic regression makes no assumption about the distribution (normal or otherwise) or the equality of variances within each group of independent variables. The results from the logistic regression are presented as odds ratios (OR) for the predictors. The P-values were calculated based on Wald χ 2 and 95% Wald confidence limits were used.
Results and discussion
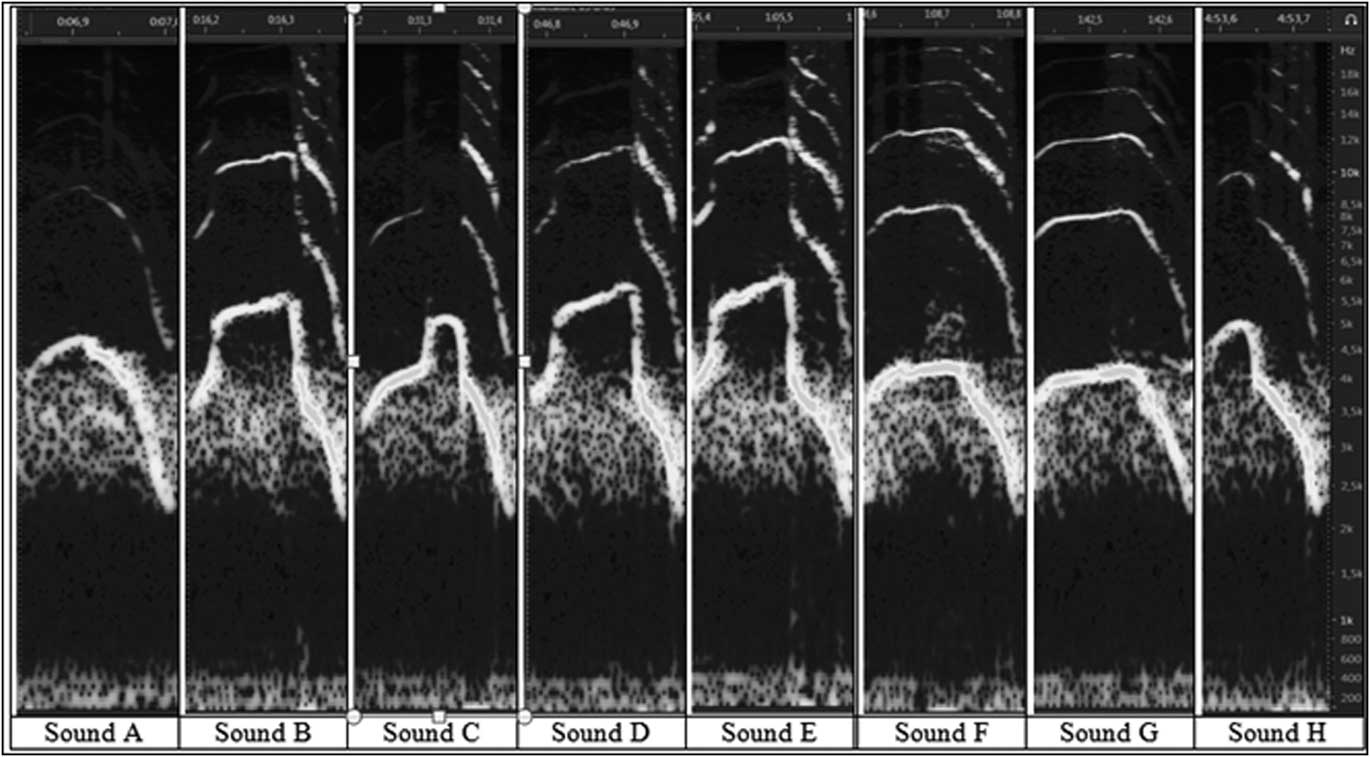
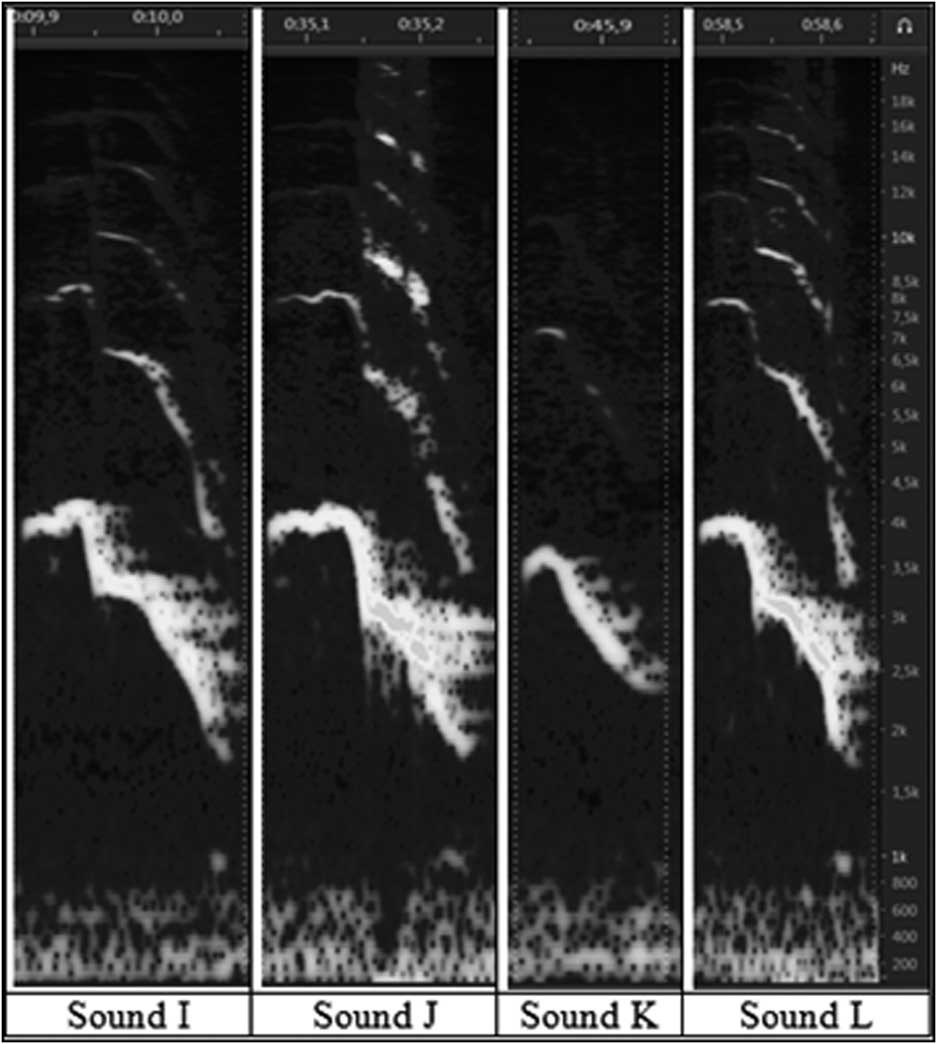
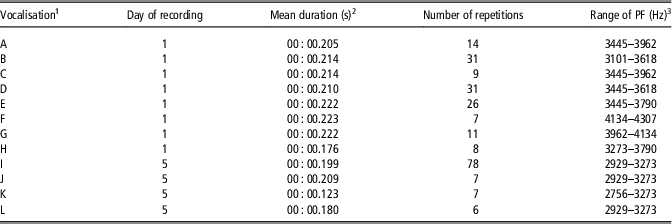
During the analysis of BS, 12 discrete and frequent types of vocalisations sounds were audio and visually identified and labelled as A, B, C, D, E, F, G, H, I, J, K, L. Sounds were grouped based on the frequency analysis that permitted differentiation between similar sounds. Eight types of BS with markers from A to H (Figure 2) were found only during the first day of recording (Day 1), while four types of BS marked from I to L (Figure 3) were found only during the fifth day of chicks’ life (Day 5). This led us to consider that the pattern of vocalisations changes with increasing age of the birds. The duration, the number of repetitions and the PF of each kind of BS are reported in Table 1.
Screenshot of the Adobe® AuditionTM CS6 software. Spectrograms of the eight types of sounds recognised with the manual labelling of sounds collected during Day 1 of recordings.

Screenshot of the Adobe® AuditionTM CS6 software. Spectrograms of the four types of sounds recognised with the manual labelling of sounds collected during Day 5 of recordings.

Mean duration, number of repetitions and PF ranges of the 12 different types of vocalisation sounds emitted by isolated broiler chicks collected in Day 1 and Day 5

PF=peak frequencies.
1 Type of vocalisation emitted by isolated broiler chicks.
2 Mean duration (s) of each kind of vocalisation.
3 Range of frequency associated to the highest level of energy of each sound.
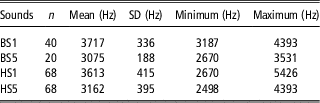
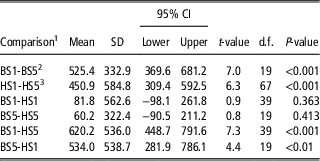
The frequency of sounds emitted during Day 1 was higher than the ones emitted by 5-day-old chicks. The PF of the sounds emitted by the birds decreased by about 500 Hz in 5 days (Table 2) showing a significant difference (P<0.001) among sounds emitted by the animals during Day 1 and Day 5 (Table 3), while no significant differences were found between PF recorded during the same day. The correlations between BS and HS (table not shown) were evaluated to verify if the chicks create specific sounds (A to L) on a specific day (1 or 5) or during a stress situation (isolated or ‘in a group’). A significant positive correlation was found between sounds emitted during the same day (Day 1 and Day 5) of recordings (BS1-HS1; average r>0.75; P<0.001; BS5-HS5; average r>0.70; P<0.001), while sounds collected during different days of recordings had low correlation (BS1-BS5; average r<0.50; P<0.001; HS1-HS5; r<0.50; P<0.001). The low correlations within BS and HS collected on different days of recording (Day 1 and Day 5), may also explain the reduced correlation between BS1 and HS5 and BS5 and HS1 (P<0.001). Video analysis showed that, during the recording procedure of BS1, there were a large number of chicks around the box responding to the vocalisations emitted by the animals inside. The same video recording procedure was adopted during Day 5; in this case, chicks outside the box did not respond in such a clear and apparently coordinated way to the vocalisations emitted by the animals inside the box (BS5).
Mean, standard deviation, minimum and maximum value of the peak frequency (Hz) of vocalisations emitted by broiler chicks

BS1=sounds emitted by the isolated broiler chicks on Day 1; BS5=sounds emitted by the isolated broiler chicks on Day 5; HS1=sounds emitted by the broiler chicks in the house on Day 1; HS5=sounds emitted by the broiler chicks in the house on Day 5.
Statistical difference in peak frequency (Hz), among sounds emitted by broiler chicks, in both isolated and in group situations

95% CI=95% confidence interval; BS1=sounds emitted by the isolated broiler chicks on Day 1; BS5=sounds emitted by the isolated broiler chicks on Day 5; HS1=sounds emitted by the broiler chicks in the house on Day 1; HS5=sounds emitted by the broiler chicks in the house on Day 5.
1 Paired sample t-tests were made to compare the peak frequency of vocalisations emitted by the chicks in six specific situations.
2 Sounds emitted by isolated chicks inside the box; 1 and 5 are referred to the day of recordings.
3 Sounds emitted by chicks in group; 1 and 5 are referred to the day of recordings.
As soon as the first chick was moved into the enclosed box, the vocalisations immediately increased in repetition rate, both inside and outside the box, showing that social isolation in chicks led to an increase in rate of vocalisation. Indeed, when other chicks were introduced into the box, the vocalisation sounds were less frequently emitted by the animals. These findings are consistent with studies on social-separation stress effects on vocalisation (Montevecchi et al., Reference Montevecchi, Gallup and Dunlap1973; Marx et al., Reference Marx, Leppelt and Ellendorff2001; Feltenstein et al., Reference Feltenstein, Ford, Freeman and Sufka2002). These authors classified these particular vocalisations as sounds induced by stress situations such as social isolation, and they defined them as distress calls.
As reported by Marx et al. (Reference Marx, Leppelt and Ellendorff2001) the occurrence of distress calls is higher when a group of isolated chicks is smaller than three animals. The presence of chicks around the box during Day 1 led to surmise that BS emitted by 1-day-old chick were more likely to be classifiable as calling sounds towards conspecifics. Whereas, BS emitted by 5-day-old chicks were more likely to be classified as distress calls resulting from social isolation.
This proposed classification of calling and distress vocalisation may also be supported by the low correlation obtained within BS and HS recorded in different days (Day 1 and Day 5). The 0.70 and 0.75 correlation coefficients obtained for sounds emitted during the same day (Day 1 and Day 5, respectively) indicate that, the sounds had a typical PF in relation to the age of the birds. Moreover, isolation from the flock strongly affected the nature of vocalisations emitted by chicks inside the box; these findings support those made by Montevecchi et al. (Reference Montevecchi, Gallup and Dunlap1973) and Feltenstein et al. (Reference Feltenstein, Ford, Freeman and Sufka2002). By analysing the correlation table and the spectrogram of each sounds it was seen that, based on the frequency level, some sounds were more similar than others. For this reason, 12 types of vocalisations sounds were compared using PDIFF option to verify their similarity and dissimilarity. No significant frequency pattern difference was found between sounds B and D, B and E, A and H, J and I, I and L (data not shown) confirming what emerged from the spectral analysis and correlations.
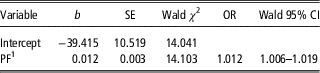
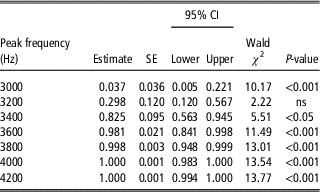
The histogram shown in Figure 4 indicates the difference in the response of the chicks outside the box in relation to the PF level of vocalisations emitted by isolated chicks. The y-axis (Figure 4) indicates the PF of the vocalisation (Hz) emitted by isolated chicks. The white area represents the absence of chicks around the box while the isolated chicks were vocalising (negative response). The positive response (dotted area), represents the presence of chicks outside the box when the isolated chicks were vocalising. Both responses were a function of PF of the vocalisation emitted, and it is noted that chicks outside the box reacted more to high frequency vocalisations emitted by isolated chicks during Day 1 than during Day 5. This response is probably linked to the combination of two different key factors: (1) the frequency of the sounds and (2) the specific ‘meaning’ of the vocalisations created. Indeed, chicks appear to have been more likely to respond to ‘calling sounds’ of the type typically emitted by very young isolated chicks (OR=1.012; Wald CL 95%=1.006 to 1.019) reinforcing the proposition that this kind of vocalisation acts in social interaction signalling (Marx et al., Reference Marx, Leppelt and Ellendorff2001). Furthermore, the reduced response to BS at Day 5 (when the group structure has been already established) led us to classify these sounds as ‘distress sounds’, as reported by (Marx et al., Reference Marx, Leppelt and Ellendorff2001; Feltenstein et al., Reference Feltenstein, Ford, Freeman and Sufka2002) (Table 4). According to the results reported in Table 5 the probability of a positive behavioural response of the chicks outside the box is 0.037 when the PF is 3000 Hz but it rises to 0.82 when the PF reaches 3400 Hz (P<0.001). When the PF is 3600 Hz the probability of a positive response of the chicks outside the box is higher than 0.98 (P<0.001). These findings are consistent with the findings of Montevecchi et al. and Marx et al (Montevecchi et al., Reference Montevecchi, Gallup and Dunlap1973; Marx et al., Reference Marx, Leppelt and Ellendorff2001; Feltenstein et al., Reference Feltenstein, Ford, Freeman and Sufka2002) in which the important effect of social isolation on vocalisation emitted by chicks is described.
Stacked histogram of the response of the chicks outside the box in relation to peak frequency of vocalisations emitted by isolated chicks (P<0.01). The positive response is represented by the dotted part. Error bars represent SE.

Results from the logistic regression on the risk of a positive response of chicks outside the box, in relation to PF (Hz) of vocalisation emitted by isolated chicks

OR=odds ratio; PF=peak frequency.
1 Peak frequency of the sounds emitted by the broiler chicks.
Results from the logistic regression on the risk of a positive response of chicks outside the box, in relation to changes in peak frequency (Hz) of vocalisation emitted by isolated chicks

95% CI=95% confidence interval.
Conclusions
The behaviour of chicks around the isolation box, apparently responding to the sounds of isolated chicks is more readily identified in younger chicks and less in older birds. The presence of the birds around the enclosed box leads us to surmise that the sounds emitted by 1-day-old chicks isolated from the group were mostly classifiable as ‘calling sounds’ directed towards their conspecifics; whereas sounds emitted by 5-day-old chicks might be better classified as ‘distress calls’ due to social (and physical) isolation. The results of the present study led us to conclude that ‘calling sounds’ are vocalisations emitted by very young chicks during the imprinting phase (first 2 days of life), when birds usually learn fundamental behaviours related to social interaction and vocal communication.
The results also shown that the PF of the sounds emitted by the birds is inversely proportional to the age and the weight of the broilers; specifically, the more they grew, the lower the frequency of the sounds emitted by the animals.
Acknowledgements
We acknowledge the support of the University of Bristol and the University of Milan for funding the secondment in the UK.