Implications
Fractional passage of feed determines the time feed is retained in the digestive tract of an animal and is essential to predict absorption and excretion of nutrients and waste products and nutrition-related disorders. Fractional passage is therefore a fundamental part of modern feed evaluation models, which most often assume fixed fractional passage rates for different feed types and components. This study shows that the stable isotope 13C can be used to trace feed components of concentrates passing through the digestive tract of dairy cows and that 13C determined fractional passage rates differ between feed components.
Introduction
Fractional passage of feed determines the time feed is retained in the digestive tract. More importantly, fractional passage specifies the site and extent of degradation of feed particles and the efficiency of microbial protein synthesis (Dijkstra et al., Reference Dijkstra, Kebreab, Mills, Pellikaan, López, Bannink and France2007). Knowledge on fractional passage rates is therefore essential to predict the amount of volatile fatty acids (VFA) and microbial protein synthesised in the rumen, which are the major sources of absorbed energy and protein, respectively. Protein supply and VFA production predictions were found to be very sensitive to changes in fractional passage rates (Bannink et al., Reference Bannink, de Visser, Dijkstra and France1997; Seo et al., Reference Seo, Tedeschi, Schwab, Garthwalte and Fox2006), emphasising the need of an accurate estimation of fractional passage of concentrates.
Accuracy of passage rate estimation can vary considerably with marker choice. Predominantly, studies on passage dynamics have employed external digesta markers although their use has been criticised for their representativeness (Tamminga et al., Reference Tamminga, Robinson, Vogt and Boer1989; Owens and Hanson, Reference Owens and Hanson1992; Pellikaan et al., Reference Pellikaan, Verstegen, Tamminga, Dijkstra and Hendriks2013). In contrast, internal markers would be preferred as they undergo the same biological processes to which the feed fractions under investigation are exposed to. Stable isotopes are present in low amounts in feedstuffs and can be used as an internal marker. Differences in natural abundance of the stable isotope 13C relative to the major carbon isotope 12C, as occurs between carbon-fixating C3 and C4 plant species (Boutton et al., Reference Boutton, Tyrrell, Patterson, Varga and Klein1988), can be used to determine fractional passage rates (Südekum et al., Reference Südekum, Ziggers, Roos, Sick, Tamminga and Stangassinger1995; Sponheimer et al., Reference Sponheimer, Robinson, Roeder, Hammer, Ayliffe, Passey, Cerling, Dearing and Ehleringer2003). Recent studies further emphasised the advantages of stable isotopes in estimating feed-specific fractional passage rates (Huhtanen and Hristov, Reference Huhtanen and Hristov2001; Pellikaan et al., Reference Pellikaan, Verstegen, Tamminga, Dijkstra and Hendriks2013). In the latter study, 13C-labelled grass silage yielded lower fractional rumen passage rates compared to the external marker chromium-mordanted fibre (Cr-NDF), likely because the latter marker typically associates to the small indigestible rumen particle pool (Bosch and Bruining, Reference Bosch and Bruining1995). Such marker discrepancies were also reported between Cr-NDF and the internal marker NDF following rumen evacuations (Robinson et al., Reference Robinson, Tamminga and Van Vuuren1987). However, it is not known whether differences among small-particle external markers and internal markers persist for concentrates, which are typically provided as relatively fine material.
Passage of feed particles has been found to be feed and animal specific (e.g. Colucci et al., Reference Colucci, MacLeod, Grovum, McMillan and Barney1990; Lund et al., Reference Lund, Weisbjerg and Hvelplund2006; Ahvenjärvi et al., Reference Ahvenjärvi, Rinne, Heikkilä and Huhtanen2010) but effects of concentrate level in the diet on passage of feed are less clear. For instance, fractional passage of protein and starch in roughage and concentrates are fixed in the Dutch protein evaluation system for ruminants, whereas that for NDF is estimated from the fractional NDF degradation rate (Van Duinkerken et al., Reference Van Duinkerken, Blok, Bannink, Cone, Dijkstra, Van Vuuren and Tamminga2011). However, fractional passage rate of forages was found to increase with an increasing concentrate proportion in the diet (review of Offer and Dixon, Reference Offer and Dixon2000). Similarly, fractional passage of concentrates was reported to increase from 0.050 to 0.069/h when concentrate levels increased from <20% up to 50% in the diet, whilst a further increase in concentrate level up to 80% gave a decrease in the fractional rate of passage to 0.034/h (Owens and Goetsch, Reference Owens and Goetsch1986). Colucci et al. (Reference Colucci, MacLeod, Grovum, McMillan and Barney1990) observed decreased fractional rumen passage rates of a Cr-mordanted concentrate meal with increasing levels of concentrates in the diet with this relationship depending strongly on feed intake. Ahvenjärvi et al. (Reference Ahvenjärvi, Rinne, Heikkilä and Huhtanen2010) further reported a significant effect of the type of diet on fractional rumen passage of forage but not on that of a concentrate meal based on the external marker lanthanum.
The aim of this study was to determine feed component-specific fractional passage rates for concentrates provided to dairy cows at low and high levels. In this study, the principle of higher 13C abundance in C4 plants as compared to C3 plants was used. A shift in 13C-enrichment was created by exchanging part of the C3 basal concentrates by a pulse dose of C4 maize bran in the diet. Passage kinetics of concentrates were then quantified from changes in the 13C : 12C ratio in different feed components in faeces.
Material and methods
Animals, diet, and experimental design
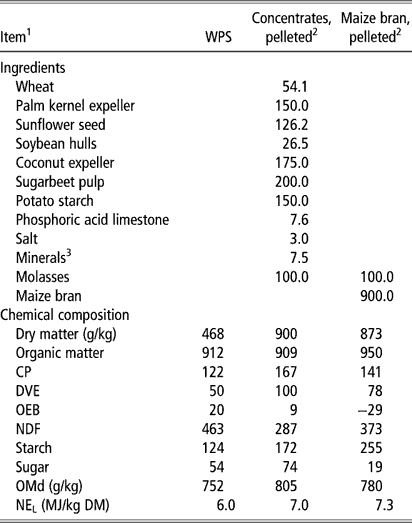
The experiment was approved by the Institutional Animal Care and Use Committee of Wageningen University and executed in accordance with the Dutch legislation on the use of experimental animals. Six Holstein-Friesian dairy cows in their second to third lactation, fitted with a permanent rumen cannula (10 cm i.d., Type 1C; Bar Diamond, Parma, ID, USA), were individually housed in tie stalls. After an initial adaptation period to the experimental diet, one animal was excluded from the experiment because of general health issues. At the onset of the experiment, cows were 267±8 days in milk (mean±s.e.), averaged 574±9 kg in body weight and produced 14.6±0.96 kg milk/day. Animals received a basal diet (Table 1) containing whole-plant silage and concentrates. Whole-plant silage was prepared from ensiled barley and grass silage as a 1 : 1 (w/w) mixture on product basis. Concentrates were prepared from C3 and C4 plant ingredients (60 : 40; w/w), selected to achieve low natural level of 13C abundance (Table 1), and fed at two levels to obtain concentrate levels of 230 g/kg dry matter (DM) (low concentrate level; LC) and 520 g/kg DM (high concentrate level; HC) in the diet. Concentrates were provided on top of the roughage to ensure that all concentrates were eaten. Animals were paired based on parity and milk production and among pairs animals were randomly assigned to receive either an LC or an HC diet over two experimental periods in a crossover design. Both experimental periods consisted of an adaptation period of 15 days and a measuring period of 5 days. Animals were fed three times per day at 0615, 1415 and 2115 h. Feed intake for all animals was restricted based on the animal with the lowest individual feed intake, thereby minimising feed residues and ensuring equal concentrate and nutrient uptake. Animals had constant access to water and minerals (KNZ, AkzoNobel, Hengelo, the Netherlands). Animals were milked twice daily at 0615 and 1645 h.
Ingredients and chemical composition of the experimental diet fed to dairy cows

WPS=whole-plant silage (1 : 1 mixture, w/w, of barley and grass silage); determined by near-infrared spectroscopy (Blgg AgroXpertus, Wageningen, the Netherlands); DVE=intestinal digestible protein; OEB=rumen-degraded protein balance; OMd=organic matter digestibility; all units in the Dutch protein evaluation system (Van Duinkerken et al., Reference Van Duinkerken, Blok, Bannink, Cone, Dijkstra, Van Vuuren and Tamminga2011); NEL=net energy lactation (calculated as described by Van Es, Reference Van Es1975).
1 Values in g/kg dry matter, unless mentioned otherwise.
2 Ingredients and chemical composition determined through linear programming based on table values from CVB (2000).
3 Mineral premix on basis of limestone (Mervit Rundvee 31, Pre-Mervo, Utrecht, the Netherlands).
Markers
Fractional passage rates of carbon-stable isotopes (13C) and chromium-mordanted fibre (Cr-NDF) were determined from their faecal excretion patterns following a pulse dose on day 16. The 13C pulse dose consisted of 9.0 kg pelleted maize bran-based concentrates (ground to 2.75 mm; Table 1) fed to animals in two equal portions. The first 13C portion (4.5 kg maize bran) was administered orally at 0600 h and after 30 min non-ingested pelleted maize bran was quantitatively administered intra-ruminally via the cannula. At the same moment, 90 g Cr-NDF (45.9 g Cr/kg Cr-NDF; 0.5 mm) was pulse-dosed intra-ruminally. Thereafter, the second 13C portion (4.5 kg maize bran) was administered the same way as described above. Feeding time was postponed to 0700 h on the day of pulse dose administration. To ensure equal concentrate uptake after adding additional DM from the maize bran bulk to the rumen DM pool through the maize bran pulse dose, the LC group did not receive concentrates during the morning and afternoon feeding, and the HC group did not receive concentrates during the morning feeding. Rumen pH measurements were regularly taken over a 72-h cycle after pulse dosing at faecal sampling times (18 measurements per animal) to have some indication of rumen fermentation during passage kinetics measurements.
Feed digestibility was determined by applying the continuous infusion method (Faichney, Reference Faichney1975), employing a continuous infusion of cobalt ethylenediamine tetraacetic acid (Co-EDTA) in the rumen. Starting at day 7, Co-EDTA (1.14 g Co/day) was dissolved in 12 l water and infused into the rumen at a constant rate (0.5 l/h). The Cr-NDF and Co-EDTA were prepared as described by Udén et al. (Reference Udén, Colucci and Van Soest1980); Cr-NDF was prepared from wheat straw, thoroughly washed, dried and ground to pass a 0.5-mm screen.
Measurements and chemical analyses
Milk samples were taken twice daily during the measurement period and pooled per day. Milk composition was analysed by mid-infrared spectroscopy and pooled per animal over each sampling period (Milk Control Station, Zutphen, the Netherlands).
Feed residues were collected daily before the morning feeding, oven-dried at 70°C and ground over a hammer mill to pass a 1-mm screen (100 AN; Peppink, Olst, the Netherlands). Feed samples and residues were pooled per animal over each sampling period. Contents of DM and ash were determined gravimetrically after 4 h drying in a forced air stove at 103°C (ISO 6496) and after incineration for 3 h in an oven at 550°C (ISO 5984), respectively. Nitrogen was determined using the Kjeldahl method with copper(II) sulphate as catalyst (ISO 5983) and CP was calculated as 6.25×N. Starch content was determined enzymatically according to the method of Brunt et al. (Reference Brunt, Sanders and Rozema1998). Ash-free neutral detergent fibre (NDF) was determined by a modified method of Van Soest et al. (1991) with the use of heat-stable amylase but without sodium sulphite (ISO 16472).
Directly after administration of markers into the rumen, 20 spot samples of faeces were collected after defecation in sampling blocks of 3 h each to determine fractional passage rates. Faecal samples were collected at average times t=0, 4, 5, 7, 9, 11, 13, 16, 17, 20, 23, 31, 35, 41, 48, 53, 60, 72, 83 and 99 h after pulse dose administration. For an optimal curve fit, the interval between collection times during the first 24 h after pulse dose administration were shortened to ensure that sufficient data points were obtained before the anticipated marker peak concentrations time (PCT). Faeces were weighed, homogenised and a representative sample (300 g) taken. Samples were stored at −20°C, freeze-dried, ground (<1 mm, 100 AN; Peppink) and stored at 4°C pending analyses. Feed digestibility was determined by collecting faeces in sampling blocks of 3 h each over 3 sampling days, thereby covering a 24-h period, which was representative for an entire feeding cycle. Samples were processed as described above.
Faecal marker excretion patterns were established for Cr-NDF and for 13C in the DM fraction (13C-DM), NDF fraction (13C-NDF) and neutral detergent soluble fraction (13C-NDS). All fractions, including Cr and Co concentrations, were analysed as described in detail by Pellikaan et al. (Reference Pellikaan, Verstegen, Tamminga, Dijkstra and Hendriks2013). The NDS fraction was obtained by calculating the difference between the DM and NDF. The relative 13C-enrichment is expressed as the 13C : 12C ratio in the samples relative to the 13C : 12C ratio of the international Vienna Pee Dee Belemnite standard. After correction for natural 13C abundance, faecal excretion patterns of excess 13C were established.
Curve fitting and statistical analyses
Fractional passage rates were derived from faecal excretion patterns of 13C-DM, 13C-NDF, 13C-NDS and Cr-NDF, fitted iteratively with non-linear compartmental models. These models were two-compartmental models with progressively higher orders of age dependency (GnG1; Matis, Reference Matis1972) and a multicompartmental age-independent model (Dhanoa et al., Reference Dhanoa, Siddons, France and Gale1985). Model accuracy was assessed by comparing observed to predicted marker concentrations using the root mean square prediction error, which was decomposed into errors due to overall bias of prediction, errors due to deviation of the regression slope from unity, and errors due to random variation (Bibby and Toutenberg, Reference Bibby and Toutenburg1977), and scaled to the observed mean (mean prediction error, MPE).
The multicompartmental model gave overall the best fit between observed and predicted faecal marker concentrations as shown by its low MPE (13.3±0.85% across markers) and high coefficient of determination (R 2=0.977 across markers), and all 40 curves converged. The higher-order GnG1 (n=3–5) models had overall higher MPE values (ranging from 26.7±1.50% for the G3G1 model to 19.9±1.09% for the G5G1 model), a lower R 2 (ranging from 0.915 for the G3G1 model to 0.953 for the G5G1 model) and curves had a poorer convergence ranging from a total of eight non-converged curves (G3G1) to one non-converged curve (G5G1). The multicompartmental model was therefore selected as the most suitable model to derive passage kinetics in this study and was defined as (Equation (1)):
 $$\eqalignno{C_{t} =&A{\times}{\rm exp}\,({\minus}K_{{\rm 1}} {\times}t){\times}{\rm exp}[{\minus}\left( {N{\minus}{\rm 2}} \right)\cr &{\times}{\rm exp}\,({\minus}(K_{{\rm 2}} {\minus}K_{{\rm 1}} ){\times}t)]$$
where C t denotes the faecal marker concentration at time t (h); t is the average time span of collection after marker administration; K 1 and K 2 (/h) refer to the fractional rate constants for the compartment with the longest (reticulorumen) and the second longest retention time (large intestine) in the digestive tract, respectively; N refers to the model-derived number of mixing compartments; and A forms a scalable parameter dependent on K 1, K 2 and N. Before curve fitting, faecal marker concentrations were scaled to the marker peak concentration, following the procedure of Sponheimer et al. (Reference Sponheimer, Robinson, Roeder, Hammer, Ayliffe, Passey, Cerling, Dearing and Ehleringer2003). Curve fitting was performed using non-linear least squares regression procedures of SAS (version 9.2; SAS, Cary, NC, USA) based on the least square Levenberg-Marquardt algorithm. Initial values for the iterative procedure were obtained through a grid search and curve fits were normally solved after 6 to 10 iterations.
Transit time (TT) and moment of PCT were derived from the estimated parameters based on Equation (1) as described by Dhanoa et al. (Reference Dhanoa, Siddons, France and Gale1985). TMRT in the gastro-intestinal tract was calculated as the sum of the reciprocals of K 1 and K 2 including retention times associated to the remaining compartments (assumed to be TT).
All model parameters were log-transformed by taking the natural logarithm due to asymmetrical distribution patterns of residuals. Log-transformed values were tested by analyses of variance as a split plot with a crossover arrangement of treatments for main plots with mixed model procedures of SAS (version 9.2; SAS), according to the model (Equation (2)):
 $$\eqalignno {Y_{{ijkm}} =&\mu {\plus}A_{i} {\plus}P_{j} {\plus}D_{k} {\plus}\left( {A{\times}P{\times}D} \right)_{{ijk}} \cr &{\plus}M_{m} {\plus}\left( {D{\times}M} \right)_{{km}} {\plus}{\varepsilon}_{{ijkm}} $$
where Y ijkm is the dependent variable; μ is the overall mean; A i (animal effect; i=5), P j (period effect; j=2) and D k (effect for concentrate level in the diet; k=2) represent effects related to the main plots; M m (marker effect; m=4) and the interaction term (D×M)km represent effects related to the subplots. Main plot variables were tested against the interaction term (A×P×D)ijk and subplot variables were tested against the pooled residual error (ε ijkm). Covariance parameters were estimated using the residual maximum likelihood method and denominator degrees of freedom were estimated using the Satterthwaite approximation. Differences between marker types were assessed using orthogonal contrasts. Tables show back-transformed values (geometric means). The standard error of the mean (s.e.) was calculated by multiplying the log-transformed s.e. by its geometric mean. Animal performance data were statistically analysed as crossover arrangement of treatments as outlined in Equation (2), but omitting subplots for marker effects.
Results
Feed intake and animal performance
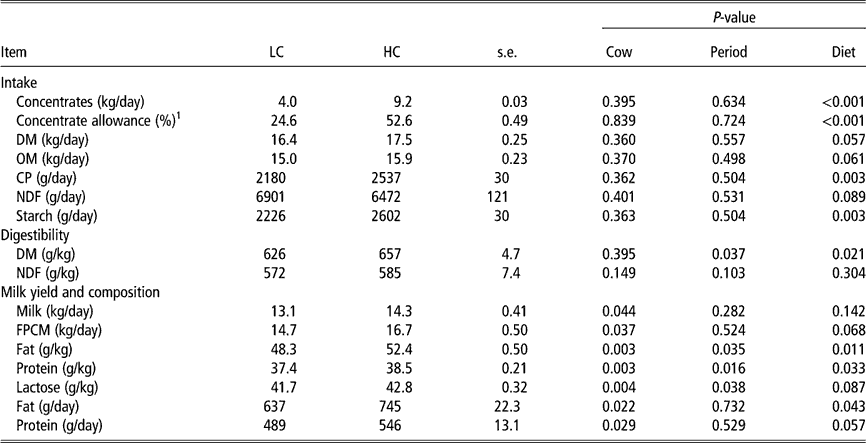
Feed intake, digestibility and milk production data are given in Table 2. Passage kinetics were studied for diets fed to dairy cows in the LC and HC treatment groups. The final concentrate intake levels on DM basis were 4.0 kg/day (24.6% of total DM intake) for LC diets and 9.2 kg/day (52.6%) for HC diets. Animals receiving an HC diet realised a slightly higher daily DM intake (17.5 kg DM/day) compared to the LC-fed group (16.4 kg DM/day; P=0.057). The difference in DM intake was mainly because of two animals in the LC treatment group that had somewhat higher feed residues (2.3±0.23 kg product per day) after pulse dosing maize bran than during other days. However, feed residues did not include concentrates as these were provided on top of the roughage. Intake of crude protein and starch were higher with HC diets (P=0.003), and intake of NDF tended to differ (P=0.089) between diets. DM digestibility was 3% units higher (P=0.021) for HC than LC diets whereas NDF digestibility remained similar across treatments.
Animal performance of dairy cows fed a mixture of whole-plant barley and grass silage at low levels (LC) and high levels of concentrates (HC) in the diet
DM=dry matter; OM=organic matter; FPCM=fat and protein corrected. milk.
1 % of total DM intake.
Fat and protein corrected milk (FPCM) production tended to be higher (2.0 kg/day; P=0.068) for animals fed an HC diet. Milk fat and protein concentrations were higher (P=0.011 and 0.033, respectively) in the HC group, resulting in somewhat higher absolute fat and protein yields for the HC group (P=0.043 and 0.057, respectively).
Passage kinetics
Fractional passage rates were estimated for 13C-DM, 13C-NDF, 13C-NDS and Cr-NDF based on faecal marker excretion curves following a pulse dose of maize bran and Cr-NDF into the rumen. Among markers, the MPE was highest for 13C-NDS (17.8–21.3%; P<0.001) but comparable between Cr-NDF and 13C-DM and 13C-NDF (9.9–13.9%; results not shown). The largest proportion of the MPE was due to random variation (94.6%) and only a minor part was explained by an error in the overall mean (2.7%) or regression bias (2.8%) (results not shown).
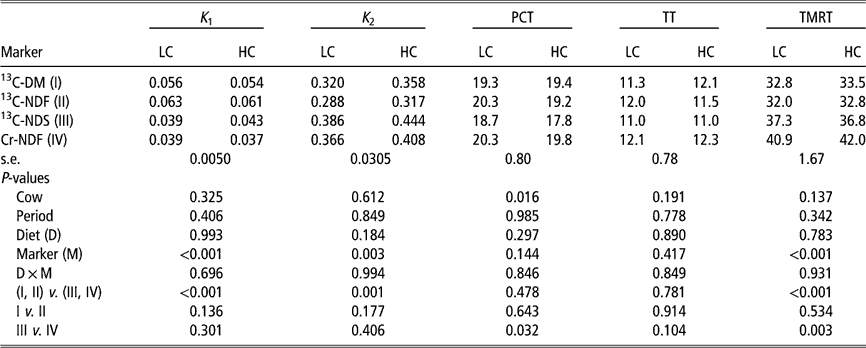
Concentrate level in the diet did not affect any model fit parameter. On the other hand, marker choice affected fractional passage rates from the reticulorumen (K 1; P<0.001), and from the large intestine (K 2; P=0.003) (Table 3). The 13C-DM and 13C-NDF gave considerably higher K 1 estimates than 13C-NDS and Cr-NDF (P<0.001). In contrast, K 2 estimates were lower when measured with 13C-DM and 13C-NDF than 13C-NDS and Cr-NDF (P=0.001). Model parameters A and N as estimated by the multicompartmental model were on average 3.3 (s.e.m. 0.54; P<0.001) and 70 (s.e.m. 16.0; P<0.001) across markers, respectively (results not shown).
Passage kinetics of different markers in dairy cows fed low levels (LC) and high levels of concentrates (HC) in the diet
K 1=fractional passage rate constant (/h) for the reticulorumen; K 2=fractional passage rate constant (/h) for the large intestine; PCT=peak concentration time (h); TT=transit time (h); TMRT=total mean retention time (h); 13C-DM=13C-labelled dry matter (I); 13C-NDF=13C-labelled neutral detergent fibre (II); 13C-NDS=13C-labelled neutral detergent soluble (III); Cr-NDF=chromium-mordanted NDF (IV). Analyses of variance based on log-transformed means.
Marker PCT and marker TT were not significantly different among markers and among diets (Table 3). The TMRT in the gastro-intestinal tract (TMRT) was therefore highly variable among markers (P<0.001) and was on average 8.2 h longer for Cr-NDF than for 13C-DM and 13C-NDF. Among 13C-marked feed components the 13C-NDS had the highest TMRT (on average, 3.5 h longer).
Mean rumen pH values of 180 measurements taken over 72 h after pulse dosing maize bran were 6.66 (s.d. 0.37) for the LC diet and 6.61 (s.d. 0.38) for the HC diet. No effect of concentrate level in the diet on pH was observed. Hours below pH 6.2, the critical level for depression of fibrolytic bacteria activity (Mould et al., Reference Mould, Ørskov and Mann1983), were on average 2.6 (s.d. 1.61) for the LC diet and 3.3 (s.d. 1.84) for the HC diet per 72 h. It can be therefore assumed that the maize bran pulse dose did not adversely affect rumen fermentation kinetics.
Discussion
Accuracy of curve fits
The present study quantifies fractional passage rates based on the faecal excretion patterns of Cr-NDF and 13C isotopes in the DM, NDF and NDS fractions. The approach used in this study is a relatively inexpensive marker technique to determine digesta passage kinetics in dairy cows. By switching from C3 concentrates to C4 concentrates with a different natural 13C-enrichment level, the often laborious and expensive preparation of external markers or isotope-labelled plant material above natural enrichment can be evaded. Costs of the latter techniques can be high, particularly for large ruminants requiring an accordingly large marker dosage. However, the approach used in this study is only suitable for testing comparable diets with a sufficiently large difference in their natural carbon isotope enrichment.
Passage kinetics of Cr-NDF from wheat straw was chosen as a point of reference as it has been widely used in passage studies. Differences in marker type material and preparation, especially with regard to particle size and density and possible migration of particulate marker to particles not originally labelled, may influence rate constants (Owens and Hanson, Reference Owens and Hanson1992). These limitations need to be considered in passage studies using different types of markers as well as when rate constants among studies are compared. Passage kinetics of 13C isotopes were determined from the specific carbon isotope ratio (13C : 12C ratio) at several time intervals after marker dosage. Pellikaan et al. (Reference Pellikaan, Verstegen, Tamminga, Dijkstra and Hendriks2013) showed that the 13C : 12C ratio did not change with fermentative degradation in the rumen and, therefore, can be used to assess feed-specific and feed component-specific passage kinetics.
A pulse dose of naturally enriched 13C feed source maize bran was offered orally and non-ingested portions were injected into the rumen. The intra-ruminally administered dose was on average 1.98 kg product (s.e. 0.57) or 22% of the total pulse-dosed maize bran. Although this relatively minor part of the maize bran was not subject to the normal chewing during eating, this is not expected to significantly affect passage behaviour of maize bran since the bran was pelleted. The total pulse dose time was on average 94 min (s.e. 9). Marker excretion curves for individual animals and markers (Figure 1) were characterised by a sharply ascending curve phase, a distinct peak at 20 h after marker dosage and a slowly descending curve phase. Marker excretion patterns were comparable to studies in dairy cattle in which a 13C pulse dose was mixed with previously fully evacuated rumen content (Pellikaan et al., Reference Pellikaan, Verstegen, Tamminga, Dijkstra and Hendriks2013). The different routes of marker administration need to be considered when comparing markers. Compared to intra-ruminal marker administration, oral administration might slow down the marker accumulation in the rumen and markers might require more mixing time before reaching the respective peak concentration, thereby affecting the shape of the curve peak. Figure 1 suggests that this was not the case in the present study as pelleted maize bran of fine particle size was used.
Faecal mean marker concentrations relative to the marker peak concentration with model fits in dairy cows fed a diet with low (LC) and high levels (HC) of concentrates for chromium-mordanted NDF (Cr-NDF; ▴) and 13C-labelled NDF (13C-NDF; ▵). NDF=neutral detergent fibre.
The MPE provides the goodness of fit of the model describing the observed faecal marker excretion patterns. Accuracy of curve fits was similar among the markers Cr-NDF, 13C-DM and 13C-NDF with rather low MPE values of 8.9–13.9%. Somewhat higher MPE values were obtained for 13C-NDS (17.8–21.3%). The latter was calculated as the difference between 13C concentration in the DM and NDF, which may have contributed to the larger MPE values of 13C-NDS since any measurement errors may accumulate in the 13C-NDS fraction.
Passage kinetics of concentrates
Fractional passage rates were derived from faecal marker excretion patterns for the compartment with the longest (K 1; reticulorumen) and second longest retention time (K 2; large intestine). Estimates for K 1 based on Cr-NDF are in the range of rate constants reported by Colucci et al. (Reference Colucci, MacLeod, Grovum, McMillan and Barney1990) for dairy cows fed a lucerne-based diet at maintenance level and receiving comparable levels of concentrates. They reported fractional passage rates of 0.046 and 0.031/h for inclusion levels of 20% and 45% concentrates in the diet, respectively. For animals fed ad libitum at a comparable feed intake as in our study, rumen fractional passage was more than doubled (on average, 0.083/h) and considerably higher than our observed K 1 estimates. Colucci et al. (Reference Colucci, MacLeod, Grovum, McMillan and Barney1990) used Cr-mordanted soybean meal as compared to Cr-mordanted wheat straw in our study. Possible difference in particle size, shape and density, especially when compared to the ingested 13C maize bran, might explain some of the observed discrepancies in fractional passage rates.
In the present study, the 13C markers were introduced by replacing part of the concentrates with maize bran originating from C4 carbon-fixating plants, which have a higher natural 13C-enrichment than the concentrates originating from C3 plants. It is assumed that no preferential disappearance of 13C or 12C from the rumen pool occurs; hence, the isotopic ratio (13C : 12C) does not change with fermentative degradation in the rumen (Pellikaan et al., Reference Pellikaan, Verstegen, Tamminga, Dijkstra and Hendriks2013). The dilution of faecal 13C after reaching the peak concentration represents then passage of the respective isotopic-labelled dietary component. The cell wall fractions (13C-NDF) of the maize bran passed out quicker from the reticulorumen than Cr-NDF and non-cell wall fractions (13C-NDS) and slightly quicker than 13C-DM, which is in contrast to passage studies on grass silages (Pellikaan et al., Reference Pellikaan, Verstegen, Tamminga, Dijkstra and Hendriks2013). In contrast to K 1, estimates for K 2 were higher for Cr-NDF than 13C-DM and 13C-NDF. This is in disagreement to findings on roughages using similar markers (Pellikaan et al., Reference Pellikaan, Verstegen, Tamminga, Dijkstra and Hendriks2013) as well as to findings on concentrates using external markers (Colucci et al., Reference Colucci, MacLeod, Grovum, McMillan and Barney1990). These differences may partly result from a differential passage behaviour of fibres originating from different feed source, although possible differences in particle size and density between Cr-NDF and 13C-NDF originating from ingested maize bran pellets might be confounding factors in the present study.
As to the lower K 1 estimates for 13C-DM as compared to 13C-NDF in the present concentrate diets, a contribution of 13C-loaded microbial biomass in the rumen to faecal DM cannot be excluded. Rumen bacteria might incorporate some of the 13C added to the rumen DM and NDS pool and eventually exit the reticulorumen at different flow rates depending on the digesta phase they are associated with. Furthermore, Brito et al. (Reference Brito, Broderick and Reynal2006) observed different isotopic enrichment levels for liquid- and solid-associated bacteria, with the latter being lower enriched in 15N isotopes. If the same can be assumed for 13C isotopes, this 13C recycling by rumen bacteria in combination with a differential passage of the rumen bacteria and a potentially substantial contribution of microbial biomass in faeces (Van Vliet et al., Reference Van Vliet, Reijs, Bloem, Dijkstra and de Goede2007), might influence the 13C : 12C ratio in the faecal DM to some degree. In contrast, passage of 13C-NDF will not be affected by microbial 13C recycling as shown by Pellikaan et al. (Reference Pellikaan, Verstegen, Tamminga, Dijkstra and Hendriks2013) as NDF is not part of microbial matter. Future research should address the potential effect of bacterial incorporation of isotopes on their passage kinetics; for instance, by quantifying the faecal bacterial biomass in dairy cows fed similar concentrate levels, or by assessing the passage behaviour of labelled plant components, such as cuticular alkanes which are components typically not degraded in the rumen and known to associate well to the rumen particulate DM pool (Mayes et al., Reference Mayes, Giráldez and Lamb1997).
Estimates of TMRT of Cr-NDF for our concentrate mixture (40.9 and 42.0 h for LC and HC, respectively) were comparable to Cr-mordanted soybean meal for dairy cows of a similar DM intake and fed concentrate levels similar to our LC and HC treatment (Colucci et al., Reference Colucci, MacLeod, Grovum, McMillan and Barney1990; 35.0–35.9 h). Ahvenjärvi et al. (Reference Ahvenjärvi, Rinne, Heikkilä and Huhtanen2010) reported a considerably lower TMRT of 24.7 h for lanthanum-labelled rapeseed meal for dairy cows of a similar DM intake fed 40% concentrates in silage-based diets. The internal markers 13C-DM and 13C-NDF had a lower TMRT than the external marker Cr-NDF. In general, the TMRT of the 13C markers were considerably lower for maize bran in the present study compared to roughage from previous 13C passage studies: on average, TMRT for maize bran was 31 h faster than grass silage and 40 h faster than fresh grass (Pellikaan, Reference Pellikaan2004). However, TMRT of Cr-NDF was comparable throughout all passage studies cited despite qualitative contrasts of the diets used. These results suggest that Cr-NDF is less sensitive to dietary changes than 13C. This is in line with Bosch and Bruining (Reference Bosch and Bruining1995) who concluded that Cr-NDF ground to 0.2–1.0 mm associates to the small indigestible rumen particle pool and can be considered to be only representative of that specific pool. In contrast, 13C isotopes, incorporated as natural components in all plant components, represent the entire fraction in which they are analytically recovered and better suitable to measure differences between diets.
Levels of concentrates in the diet (24.6% v. 52.5% concentrate proportion) did not influence fractional passage rates and kinetics of concentrates. Our findings agree with studies on ruminants based on external markers. Colucci et al. (Reference Colucci, MacLeod, Grovum, McMillan and Barney1990) found no differences of fractional passage rates and TMRT of Cr-mordanted soybean meal particles between 20% and 45% concentrates in the diet, comparable to our LC and HC treatments, for animals fed comparable amounts of DM. Poore et al. (Reference Poore, Moore and Swingle1990) confirmed these findings with rare earth element-labelled sorghum grain in steers receiving concentrate levels comparable to our LC and HC treatments. They reported fractional rumen passage rates of 0.053 and 0.051/h for 30% and 60% concentrate diets, respectively. In contrast to the absence of effect of concentrate level on fractional passage rate, roughage characteristics may well affect fractional passage rate. Ahvenjärvi et al. (Reference Ahvenjärvi, Rinne, Heikkilä and Huhtanen2010) observed no differences in fractional passage rates of lanthanum-labelled rapeseed meal for dairy cows receiving a 40% concentrate allowance. They reported rumen fractional passage rates for rapeseed meal ranging from 0.057 to 0.061/h for different silages that were prepared either from early or late cut grass, or red clover, or whole barley. These results suggest that passage of concentrates is considerably less sensitive to changes in diet than forage for dairy cows with high feed intake. Furthermore, passage kinetics based on 13C-NDF across studies suggest that fibres show a different passage behaviour depending on the feed source. Hence, feed source and feed component-specific fractional passage rate constants determined with stable isotopes might considerably enhance the accuracy of effective fibre degradability.
Isotope determined passage of fibres across studies suggest that is possible to discriminate between fibres from roughage and fibres from technologically treated compound feed. Further research based on isotope-labelled cell walls, either determined as fibre fractions of common gravimetric fibre analysis methods or preferably as isolated individual structural polysaccharides will provide a better understanding of the differential passage behaviour of fibres from different feed sources. The use of stable isotopes as a digesta passage marker should be further developed to analytically determine the fractional passage of the non-cell wall components, in particular starch and protein fractions.
Conclusions
Fractional rumen passage rates of concentrates determined with the external marker Cr-NDF were lower as compared with the internal marker 13C measured both in the DM or in the NDF. An increase in the concentrate proportion from 24.6% to 52.6% did not influence fractional passage rates in the digestive tract of dairy cows. Our results suggest that stable isotopes can estimate feed component-specific fractional passage rates of concentrates providing new insight into fractional passage of concentrates as compared to when external markers are used.
Acknowledgments
This work was co-financed by the Dutch Commodity Board of Feedstuffs (The Hague, the Netherlands), which is gratefully acknowledged. The authors kindly acknowledge contributions of B. Tas and H. Boer to the manuscript and the technical assistance of the people from the experimental facilities, A. van Dool and I. van den Anker. Assistance from P. Gregorini, C. in ‘t Anker and S. Nicolasen is highly acknowledged.