I. INTRODUCTION
Additive manufacturing (AM) has attracted considerable interest in the public and industrial sector over the past decades. Reference Hopkinson, Hague and Dickens1 AM allows to produce complex geometries that cannot be accomplished with standard manufacturing techniques like casting or forming. In contrast to established processes, in AM, no expensive molds or dies are necessary for fabrication, opening a potential for cost reduction in small runs. Since AM is a layer-by-layer technique, it can fulfill society's wish for customization of components and products.
Among AM techniques, selective laser melting (SLM) is the one researched most extensively. The present paper will investigate an alternative heat source, namely selective electron beam melting (SEBM). SEBM possesses a number of potential advantages over SLM. First, heat input is more effective as the electron beam is able to penetrate more deeply into the material and the evaporation limitation is averted. Second, the beam deflection speed in SEBM is much higher, as the beam is deflected by electromagnetic lenses rather than by mechanical mirrors and lenses in SLM.
In the present study, SEBM was used to process the nickel-based superalloy Inconel 718. With the aim to increase the build-up rate, beam deflection speeds up to 2200 mm s−1 are investigated. By the fabrication of simple cube-shaped test specimens, suitable processing parameters are identified. In the literature, several authors reported processing of IN718 with AM techniques. The focus was laid on the relation between microstructure and mechanical properties of additive manufactured IN718. Reference Blackwell2–Reference Wang, Guan, Gao, Li, Chen and Zeng7 In this study, the relationship between processing parameters and the microstructure was investigated on the basis of two process windows with a narrow and wide electron beam spot size.
II. EXPERIMENTAL PROCEDURE
A. SEBM processing method
An Arcam® A2 EBM system (Arcam, Mölndal, Sweden) with an acceleration voltage of 60 kV is being used to fabricate parts out of prealloyed metal powder. The process operates under a controlled vacuum of 2 × 10⁻³ mbar of He and begins on a starter or substrate plate, which is embedded in metal powder. Before the build-up process begins, the starter plate is heated to a temperature which is specific for each processed material and which is controlled by a thermocouple attached to the reverse side. In the first step of the process, the building platform is lowered according to the desired layer thickness and a thin powder layer is spread over the substrate by a rake. In the next step, the layer is preheated with a strongly defocused beam to pre-sinter the so far loose powder particles. In the third step, a selected area is molten with a focused beam according to the CAD model fed into the system. This procedure is repeated until the final 3D part is generated. Reference Heinl, Müller, Körner, Singer and Müller8 In each layer deposition, previously fabricated layers are partially remelted to assure a complete metallurgical bond between successive layers. Throughout the present investigation, a consolidated layer thickness of 50 µm was used.
B. Material
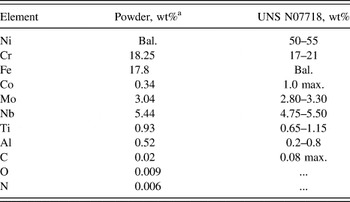
Argon gas atomized powder of Ni-based superalloy Inconel 718 was used. The material was supplied by a commercial vendor, TLS Technik GmbH, Bitterfeld. The nominal chemical composition is listed in Table I.
Nominal composition of gas atomized Inconel 718 powder and corresponding specification UNS N07718 (in wt%).

a Chemical analysis from powder supplier.
Particle size analysis performed on a Malvern Mastersizer 3000 (Malvern, Worcestershire, U.K.) shows a particle size distribution mostly between 45 and 105 µm with volume median diameter d V50 of 68.8 µm. As starter plate, a 10 mm-thick polycrystalline IN718 disk was used with a composition within the specification according to AMS 5662.
C. Experimental setup
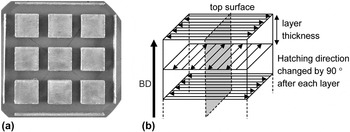
In the SEBM experiments, 9 cube-shaped samples (15 × 15 × 10 mm³) were built in one run, see Fig. 1. In the present investigation, beam parameters, i.e., deflection speed v and beam power P were varied while scanning parameters, i.e., hatching pattern and line offset were held constant.
Experimental setup for the IN718 test specimens. (a) Top surface view, (b) schematic illustrating hatching procedure. Specimens for microstructure evaluation were cut according to the plane shown in gray, i.e., with the plane of observation lying parallel to the BD and perpendicular to the hatching direction of the last layer.

In particular, a variety of beam power and deflection speed parameter sets were investigated to define a process window for fully dense parts (relative density >99.5%) with the top surfaces free from projections or unevenness. This was done for two beam geometries – for a more focused beam (spot size ∼400 µm) and for a less focused beam (spot size ∼500 µm). The hatching pattern defines the way the beam moves over the melting area. In this study, a back and forth hatching method was applied, which is indicated by the black scan vectors in Fig. 1(b). Additionally, the hatching direction was rotated by 90° after every layer. The distance between beam lines, i.e., the line distance was set to 0.2 mm. The preheating parameters were held constant over all build processes and lead to a build temperature of ∼900 °C.
D. Evaluation of sample density and top surface unevenness
After removal from the starter plate, the samples were cut with the cutting plane as indicated in gray in Fig. 1(b), i.e., parallel to the building direction (BD) and perpendicular to the hatching direction of the last layer. The mounted specimens were prepared with standard metallographic technique by grinding with SiC-paper with sizes ranging from 80 to 2400 grit, polishing with 3 µm and 1 µm diamond suspensions and polishing with an oxide polishing suspension on soft cloths.
The porosity of the polished samples was measured with a constant threshold on a light optical microscope by image analysis software Image C. A total area of 4.83 mm² was measured for each sample. A relative density of >99.5% was defined as dense and <99.5% as porous. The residual porosity of <0.5% left in dense parts is mainly attributed to trapped inert gas in the as-received gas atomized powder particles. Apparently, the corresponding gas bubbles do not reach the melt pool surface during melting and solidification and are therefore trapped inside the bulk. Trapped inert gas porosity was indeed observed in the starting powder. Our assumption is supported by the fact that residual porosity was found to be not related to any process parameters by other authors before. Reference Zhao, Chen, Lin and Huang9,Reference Qi, Azer and Ritter10
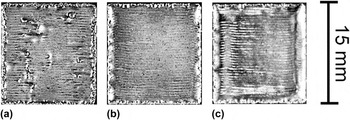
The top surface projections and unevenness are usually most prominent near edges and lead to a certain degree of waviness, see Fig. 2(c). The profile depth P t, i.e., the total height of the P-profile, was measured on the polished samples on a stereomicroscope by image analysis software. A profile depth of <200 µm was defined as even and >200 µm as uneven.
Examples of the top surface appearance of cube-shaped samples built in this investigation. (a) Sample with remaining porosity, (b) even top surface, (c) uneven top surface.

E. Evaluation of grain structure
The grain width in cubes that were dense and had smooth top surfaces was analyzed. The grain width was measured using an optical microscope on the longitudinally cut samples etched electrolytically with oxalic acid. Due to strongly elongated grains in all samples, the grain width rather than the grain diameter was investigated with the intercept method in a total area of 4.83 mm², plane of observation as explained above (Fig. 1). The measurements were taken at the same building height of the samples, i.e., 1 mm below the top surface, to assure the same degree of grain selection in every sample. In addition, the influence of the build height on the grain structure was investigated by measuring the mean grain width for one sample at five different build heights. Since samples were built directly on the starter plate, the microstructural evolution is influenced by the grain microstructure of the chosen substrate material. Here, a polycrystalline IN718 starter plate material was used which had a mean grain size of 19 µm (ASTM 8).
Grain orientation mappings of two exemplary samples were obtained by electron backscattered diffraction (EBSD) on an EDAX orientation imaging microscope system installed on a FEI scanning electron microscope Helius 600i (FEI, Hillsboro, OR), which uses a field emission gun, to analyze stray grains and misorientations of elongated grains. The step size was set to 2 µm.
III. RESULTS AND DISCUSSION
A. SEBM process parameter windows
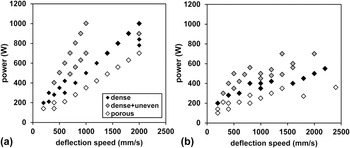
Cube-like samples of Ni-based superalloy IN718 were produced and evaluated for density and top surface unevenness. The results are plotted in Fig. 3 as a function of beam parameters, power P and speed v. Black symbols indicate suitable conditions where good samples are obtained, i.e., samples with no porosity (ρrel > 99.5%) and no top surface unevenness (P t < 200 µm).
Process parameter windows for IN718; suitable conditions resulting in dense samples with no top surface unevenness are indicated by black symbols. Process parameters varied are beam power and beam deflection speed. (a) Defocused beam (spot size = 500 µm) and (b) focused beam (spot size = 400 µm). Line distance is constant at 0.2 mm.

Porosity occurs in the present case due to insufficient melting, i.e., due to an insufficient melt pool depth or overlap. Therefore, porosity can be prevented either by increasing the power of the beam or by decreasing deflection speed to increase the melt pool volume. An alternative, not pursued in the present study, would consist in a reduction of the line distance to increase the overlap and the overall deposited energy.
Flat, smooth top surfaces are important in terms of reproducible production and consistent metallurgical bond formation. Unevenness of the top surface is a result of vigorous melt pool motion caused by high forces exerted on the melt pool and high mobility of the melt. In short, a large melt pool and high melt temperatures favor surface projections and unevenness. Forces on the melt are caused by temperature gradients, surface energy effects (Marangoni convection), and evaporation. Reference Klassen, Scharowsky and Körner11 A particular effect observed here is the mass transport to the corners of cube-shaped samples, as can be seen in Fig. 2(c). Surface unevenness, as shown in Fig. 3, occurs at high beam powers and low deflection speeds which are associated with large melt volumes and high temperatures.
A convenient measure for energy exposure per area E A (in J m−2) resulting from the electron beam is given by Eq. (1):
 $${E_{\rm{A}}} = {P \mathord{\left/ {\vphantom {P {(v \cdot l)\quad {\rm{,}}}}} \right. \kern-\nulldelimiterspace} {(v \cdot l)\quad {\rm{,}}}}$$
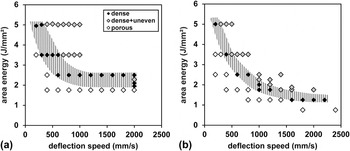
where P is the electron beam power (in J s−1), v is the deflection speed (in m s−1), and l is the line distance (in m), i.e., the distance between successive melt lines. In Fig. 4, the data from Fig. 3 are replotted using E A to characterize the processing conditions rather than P. It can be seen that the area energy E A necessary to realize dense parts decreases with increasing v. The reason is that less time for heat conduction is available, see further below for a detailed discussion. A consequence of the decrease of E A is that less specific energy is necessary to realize dense fabrication at high deflection speeds. Consequently, processing with high deflection speeds not only raises the build-up rate but also the overall energy yield.
Process parameter windows for IN718; suitable conditions resulting in dense samples with no top surface unevenness are indicated by black symbols and shaded area. Same data as in Fig. 3, but the beam energy per area E A [Eq. (1)] is being used to characterize processing conditions. (a) Defocused beam (spot size = 500 µm) and (b) focused beam (spot size = 400 µm). Line distance is constant at 0.2 mm. With higher deflection speeds, the area energy necessary to realize dense parts decreases. Higher deflection speeds lower the time available for heat loss by conduction. Focusing the beam lowers the area energy necessary even further. The more focused beam results in higher energy density, an effect which is not included in E A as defined by Eq. (1).

Comparing the process window for a defocused and a focused beam [Figs. 4(a) and 4(b), respectively], it can be seen that although there is a general similarity, there are important differences, too. For the focused beam, the process window is shifted to lower E A values and extends toward higher deflection speeds. It should be noted that the intensity profile is different in case of the focused beam and in consequence the energy density is higher. This effect is not considered in Eq. (1), i.e., for the same E A value, the energy intake and the temperatures are higher for the focused beam.
In the following, we want to discuss the effect of heat losses by conduction on the processing window. Fabrication is realized using a hatching process with an overlap between adjacent melt lines. Therefore, the melt pool geometry is strongly affected by the residual heat from the preceding line. In the time necessary for scanning, the heat of the former melt line diffuses into the substrate by heat conduction. To evaluate the time available for heat conduction, a so-called mean return time t return (in s) is calculated from the return line length s return (in m) and v (in m s−1):
 $${t_{{\rm{return}}}} = {{{s_{{\rm{return}}}}} \mathord{\left/ {\vphantom {{{s_{{\rm{return}}}}} v}} \right. \kern-\nulldelimiterspace} v}\quad {\rm{.}}$$
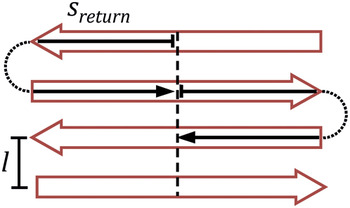
The mean return time describes the time to get from the middle of a melt line to the middle of the adjacent one. s return is indicated in Fig. 5 by a black arrow.
The red open arrows depict the standard hatching pattern in SEBM: back and forth; the black arrow indicates the middle return line length s return, for which the thermal diffusion length is calculated [Eq. (3)].

The described heat loss can be understood as a nonstationary heat conduction phenomenon and can be described by a characteristic length l th, also known as thermal diffusion length, which is an approximation of a solution of Fourier's law of heat conduction. This solution is valid for the used heating source and the examined axis of heat conduction perpendicular to the hatching lines, displayed in Fig. 5. The thermal diffusion length Reference Carslaw and Jaeger12 is calculated by the square root of the thermal diffusivity a (in m2 s−1) and the time of heat conduction t (in s), in this case t return:
 $${l_{{\rm{th}}}} = 2 \cdot {(a \cdot {t_{{\rm{return}}}})^{{1 \mathord{\left/ {\vphantom {1 2}} \right. \kern-\nulldelimiterspace} 2}}}\quad {\rm{.}}$$
The thermal diffusion length l th was calculated with an approximate thermal diffusivity of a = 5.0 * 10−6 m2 s−1, which is a mean value between a at solidus and liquidus temperature of Inconel 718. Reference Pottlacher, Hosaeus, Kaschnitz and Seifter13
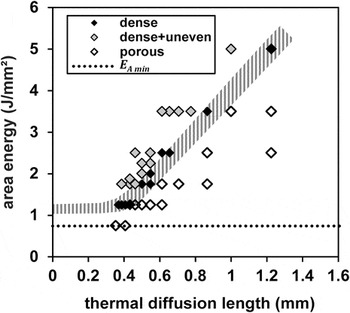
In Fig. 6, the process window is shown again but the deflection speed on the horizontal axis of Fig. 4(b) is replaced by the thermal diffusion length. An approximately linear dependence of the area energy E A required for dense and even parts on thermal diffusion length l th is observed. This reflects the higher heat losses at high thermal diffusion lengths, i.e., low scanning speeds.
Processing window for IN718 in SEBM (focused beam, spot size = 400 µm), with area energy E A plotted as a function of thermal diffusion length l th. The area energy to obtain dense parts increases with increasing thermal diffusion length (decreasing scanning speeds) because of the increasing heat loss. At small l th values (high scanning speeds), the theoretical minimum area energy E A is approached (dotted line). The theoretical minimum area energy corresponds to the energy necessary to heat and to melt a 150 µm layer of IN718 material.

At low thermal diffusion lengths, or high scanning speeds, the theoretical minimum energy E A min is approached as indicated by the dotted line in Fig. 6. This transition occurs at thermal diffusion lengths equal to the melt pool depth, where the area energy required becomes independent of the discussed heat conduction and a plateau parallel to E A min should be reached. E A min corresponds to the energy required to heat and melt a thin slice of IN718 of a thickness equivalent to the melt pool depth. For the calculation, a preheating temperature of 900 °C and a melt pool depth of 150 µm were assumed. It has been taken into account that for Ni, 19% of the deposited energy is lost due to backscattering of electrons. Reference Ito, Andreo and Tabata14,Reference Tabata, Andreo and Shinoda15
B. Process–microstructure relationship
1. Grain structure
Figure 7 shows a typical example of the grain structure after AM with SEBM and beam parameters as used above. It is apparent that a columnar grain structure develops with the grains being elongated in the BD. The grains originate from the starter plate by epitaxial growth and they extend over many fabricated layers. Such a microstructure is known from casting processes based on directional solidification (DS) where the heat is transported through the solid and grain nucleation ahead of the solidification front is suppressed due to a steep temperature gradient.
Optical micrograph showing columnar grain structure in a longitudinal section parallel to the BD. (Beam parameters: defocused beam, spot size of 500 µm, v = 200 mm s−1, P = 200 W.) A consolidated layer thickness of 50 µm was used.

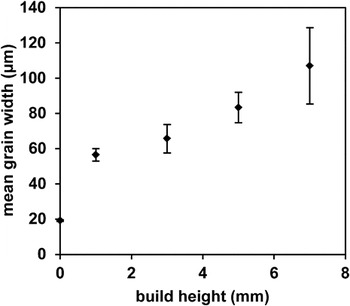
The grain width is displayed in Fig. 8 as a function of the built height. The mean grain width of 19 µm in the starter plate gradually increases to values around 100 µm. Such behavior is known from DS processing and attributed to the growth competition between grains with different orientation. Grains deviating in orientation from [100], the easy growth direction, are lagging behind the liquidus isotherm to find higher driving forces. This gives the opportunity for neighboring grains that are well-oriented to overgrow them. It is to be expected that the preferred [100] orientation sharpens simultaneously. Reference Walton and Chalmers16
Mean grain width in dependence of the build height. The grain width is increasing with the build height due to a grain selection process. (Beam parameters: defocused beam, spot size of 500 µm, v = 200 mm s−1, P = 200 W.)

Our results are in contrast to earlier investigations using a laser as a heat source where columnar-to-equiaxed transition (CET) and grains tilted away from the BD were observed. Reference Gäumann, Bezençon, Canalis and Kurz17,Reference Thijs, Verhaeghe, Craeghs, Humbeeck and Kruth18
2. Melt pool geometry
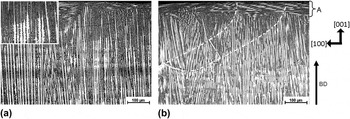
The melt pool dimensions can be made visible in optical micrographs. Figure 9 displays an area immediately adjacent to the top surface. There are line-like features tracing the maximum melt pool extension. In Fig. 9(b), for better visibility, white dashed lines are drawn to mark the line-like features. The larger magnification in Fig. 9(a) allows to identify the reason for the appearance of line-like features. Primary trunks are clearly recognizable in the picture. The line-like features are due to a sudden change of the primary trunk appearance, i.e., the suppression of secondary arms when growth continues. Such a change in morphology can be explained by a sudden change in solidification conditions when the constitutional undercooling ahead of the solidification front becomes less pronounced and a transition from dendritic to cellular morphology occurs.
Optical micrograph showing a view of the last fabricated layer next to the top surface of the sample. Specimen was cut perpendicular to the last hatching direction, i.e., the beam was moving as shown in Fig. 10(b). (Beam parameters: defocused beam, spot size of 500 µm in (a) and focused beam, spot size of 400 µm in (b); v = 200 mm s−1 and P = 200 W same for both.) In (a), the insert in the top corner shows the dendrite structure in a higher magnification. In (b), the melt pool dimensions are outlined for better visualization. The preferred crystallographic orientation is shown on the right.

During solidification of the melt pool, solidification conditions are changing. At the start of solidification of the melt pool, the solidification velocity is low and the temperature gradient is high, as stated in the literature. Reference Gäumann, Henry, Cléton, Wagnière and Kurz19,Reference Trivedi and Kurz20 When solidification continues, the velocity increases and the gradient decreases. The conditions at the start of solidification are such that little undercooling and, therefore, cellular structures, i.e., no secondary arms are expected. Due to the back melting of material when the melt pool is formed, material with cellular solidification morphology is brought into immediate contact with material with dendritic morphology.
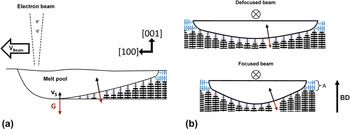
Figure 10 shows a schematic of the melt pool geometry that can be derived from the observation of the line-like features. Typical dimensions of the melt pool with the beam parameters used here are as follows. The melt pool diameter at the top surface amounts to typically ∼800 µm, with a melt pool depth of 150–250 µm. With a consolidated layer thickness of approximately 50 µm, back melting occurs to a depth of 100–200 µm.
Schematic illustrating melt pool geometry. Cross-sectional view parallel to the direction of beam motion in (a) and perpendicular to the direction of beam motion in (b). The liquidus isotherm normal is equivalent to the direction of the main temperature gradient G and solidification rate v S. The melt pool shape for the defocused beam is shallower than that for the focused beam, i.e., the temperature gradient driving solidification deviates less from the BD and primary dendrite arm orientation.

An additional interesting feature is marked A both in Figs. 9(b) and 10(b). When solidification progresses, the temperature gradient and the solidification orientation turn from a direction more or less parallel to the BD and primary trunk direction into a direction that is mainly transverse. The consequence is preferred growth of secondary dendrite arms which leads to the feature visible in area A. The orientation of the growing grain remains unchanged by this occurrence.
3. Effect of beam focus on melt pool geometry
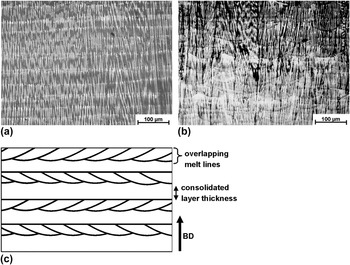
Next we want to study the effect of focusing the beam. Two beam conditions were investigated, one with a spot size of 500 µm and another with a spot size of 400 µm. All other parameters remain the same. Figure 11 depicts the microstructure. The primary trunks and the maximum pool extension lines are visible as explained in Figs. 9 and 10. The melt pool geometry is not easy to rationalize as it is changing from layer to layer as the hatching direction is changing, see Figs. 1 and 11(c). What is readily apparent though is the fact that the more defocused beam produces a trough-like pool which is shallower. More particularly, the radius of curvature of the solid–liquid interface is larger and the liquidus isotherm normal is more in parallel with the BD. The difference is schematically shown in Fig. 10(b). The liquidus isotherm normal defines the direction of the maximum heat flow, main temperature gradient, and solidification rate. Reference Rappaz, David, Vitek and Boatner21,Reference Rappaz, David, Vitek and Boatner22
Dendrite structure and melt pool geometry as in Fig. 9, but larger section size extending over several layers. (a) Optical micrograph defocused beam. (b) Optical micrograph focused beam. (c) Schematic explaining melt pool geometry and hatching strategy. The hatching direction is altered by 90° after each layer as described in Fig. 1. Specimens were cut perpendicular to the BD. (Beam parameters: defocused beam with a spot size of 500 µm; focused beam with a spot size of 400 µm; v = 200 mm s−1, and P = 200 W.) Beam focus influences the melt pool shape leading to a shallower geometry with less curvature of the interface for a defocused beam.

The less focused beam will produce lower maximum temperatures in the melt pool and lower temperature gradients. Because of the lower temperature, less material will be vaporized and a smaller pressure will be exerted on the melt pool surface. The conditions investigated here are still far from a true keyhole effect, but the melt pool begins to change in this direction. This effect is smaller with the more defocused beam producing the discussed shallower melt pool geometry.
4. Effect of beam focus on grain structure
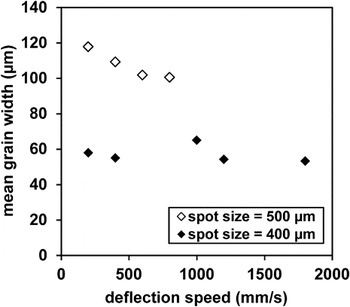
The EBSD orientation maps (IPF-maps) and pole figures (PF) in Fig. 12 show the effect of beam focus on the grain structure. The defocused beam results in a more perfect columnar grain structure in Fig. 12(a). Although the columnar structure is still preserved with the focused beam, the appearance of some stray grains in Fig. 12(c) demonstrates that nucleation of new grains ahead of the solidification front is accelerated. As a consequence, grains are less well aligned to the BD indicated by the PFs in Figs. 12(b) and 12(d). Stray grain formation leads to lower grain width for the focused beam. This is apparent when Figs. 12(a) and 12(c) are compared. This observation can also be confirmed by Fig. 13. Here, the grain width is measured at a given length of DS or a given built height. The grain width is smaller for the more focused beam, pointing toward enhanced formation of new grains ahead of the solidification front.
EBSD orientation maps and according to the pole figures of SEBM samples fabricated with a defocused beam in (a–b) and a focused beam in (c–d). (Beam parameters: v = 200 mm s−1 and P = 200 W.) Specimens were cut parallel to the BD (= Y in the sample coordinate system on the left). In (a) and (c), IPF-maps are shown with colored crystallographic orientations relative to the sample axis X. Stray grains can be observed for the focused beam in (c) indicating nucleation ahead of the solidification front. This results in a texture with less strongly aligned grains. For the defocused beam, grains are well aligned to the BD (sample axis Y), see pole figures (Z–X plane) in (b) and (d). The crystal orientation-color relation map is shown on the left.

Mean grain width (mean intercept) of SEBM samples of the process window in Fig. 4 (beam spot size of 500 µm and 400 µm), measured in a plane parallel to the BD at a build height of 9 mm [corresponding power values of the measured samples can be found in Figs. 3(a) and 3(b)]. With the focused beam, a smaller grain width is observed indicating more nucleation ahead of the solidification front.

The tendency for formation of new grains with the focused beam can be explained in two ways.
-
(i) A more vigorous motion of the melt because of the higher temperatures and higher temperature gradients can result in fragmentation of dendrites, producing nuclei for new grains.
-
(ii) A stronger deviation of the solidification direction from the BD and dendrite trunk orientation translates into a larger constitutionally undercooled volume where grain nucleation can occur. When the growth direction deviates from the trunk direction, tertiary arms must develop into new trunks. This process takes time, i.e., the crystal will lag further behind the liquidus isotherm. Reference Mokadem, Bezençon, Hauert, Jacot and Kurz23
One should note that the solidification conditions for the focused beam are probably not any closer to the columnar–equiaxed grain structure transition (CET), as the temperature gradients are higher rather than lower.
C. Conclusions
The processing window in terms of energy density used is defined by remaining porosity and surface unevenness. Porosity is the result of insufficient melting and surface unevenness is the result of forces exerted on the melt pool. Such forces are due to a variety of sources but evaporation is assumed to be the most important one.
With a narrower, more focused beam, the process window is smaller than that for a defocused beam. This result is explained by the higher peak energy density of the focused beam leading to a higher evaporation pressure and more vigorous melt motion and pronounced surface unevenness already at lower overall energy densities.
The more focused beam is found to enhance formation of new grains and to hinder development of a well-developed columnar grain structure which is desired for high temperature applications. The stronger melt motion leads to dendrite fragmentation and grain nucleation is enhanced. In addition, the steeper flanks of the melt pool translate into a growth direction that deviates more strongly from the primary dendrite arm direction, again favoring grain nucleation ahead of the solidification front.
ACKNOWLEDGMENTS
The authors gratefully acknowledge funding by the Deutsche Forschungsgemeinschaft (DFG) through the Collaborative Research Center SFB/Transregio 103, Project B2.