





1 Introduction
High-energy femtosecond lasers serve as key drivers for nonlinear optical processes, including optical parametric chirped-pulse amplification[ Reference Walke, Koç, Gores, Zhan, Forget, Maksimenka and Wilkinson1] and terahertz emission[ Reference Kong, Su, Song and Wu2], as well as the generation of high-flux attosecond pulses[ Reference Kang, Wang, Tang, Liu and Gong3]. The development of femtosecond lasers based on ytterbium (Yb)-doped gain media, such as Yb:KGd(WO4)2 (KGW), Yb:KY(WO4)2 (KYW), Yb:LiYF4 (YLF), Yb:CaGdAlO4 (CALGO) and Yb:CaYAlO4 (CALYO), which represent a new generation of laser crystals[ Reference Fattahi, Barros, Gorjan, Nubbemeyer, Alsaif, Teisset, Schultze, Prinz, Haefner, Ueffing, Alismail, Vámos, Schwarz, Pronin, Brons, Geng, Arisholm, Ciappina, Yakovlev, Kim, Azzeer, Karpowicz, Sutter, Major, Metzger and Krausz4], has opened up new opportunities for achieving high-energy and high-average-power amplification while enabling ultrashort pulse duration. However, a major challenge associated with Yb-based amplifiers is gain narrowing under high-gain amplification[ Reference Zhang, Yu, Yao, Zhang, Fan, Han, Huang, Chen, Sun and Chen5, Reference Buettner, Buenting, Wandt, Neumann and Kracht6]. When scaling the amplified energy to the mJ level, the pulse duration of the reported Yb-based systems has inevitably degraded significantly due to a narrowing of the spectrum, making it difficult to obtain sub-100-fs pulses. More importantly, spectral narrowing during amplification leads to a concomitant shortening of the temporally stretched pulse for a given dispersion, thereby increasing the peak intensity during amplification and significantly increasing the risk of optical damage caused by pulse narrowing in the regenerative amplifier. As a result, the laser mode size in the gain medium must be enlarged to avoid optical damage, which in turn reduces the achievable gain and limits the output pulse energy. Consequently, single-crystal regenerative amplifiers are typically limited to output pulse energies below 5 mJ. In 2022, Wang et al. [ Reference Wang, Pu, Wu, Li, Wang, Sun and Liang7] reported an Yb:CALGO regenerative amplifier producing pulse energies of 4.3 mJ. Due to gain narrowing during amplification, the spectral bandwidth was reduced from 70 nm in the seed to 19 nm at the amplifier output, enabling pulse compression to 95 fs. In 2023, Petrov et al. [ Reference Petrov, Georgiev, Velkov, Trifonov, Xu, Popmintchev and Buchvarov8] demonstrated an Yb:CALYO regenerative amplifier delivering pulse energies of 2.3 mJ at a central wavelength of 1039 nm. The narrowed spectrum exhibited a full width at half maximum (FWHM) of 13.6 nm, compared with approximately 25 nm for the seed spectrum, resulting in a compressed pulse duration of 125 fs. In the same year, Wang et al. [ Reference Wang, Bai, Mai, Zheng, Tian, Yu, Tian, Xu, Wei and Zhu9] reported an Yb:CALYO regenerative amplifier producing 2.87 mJ pulses at a repetition rate of 10 kHz, corresponding to an average output power of 28.7 W. The amplified spectrum was centered at 1037 nm with an FWHM of 11 nm, and the pulses were compressed to 178 fs. To further scale the single-pulse energy, approaches such as increasing the temporal duration of the seed pulse or employing dual-crystal regenerative amplifier configurations have been widely adopted in recent years. In Yb-doped yttrium aluminum garnet (Yb:YAG) thin-disk regenerative amplifiers, seed pulses are typically stretched to the nanosecond level, and the laser mode diameter on the disk is generally on the millimeter scale. Enabled by the relatively large emission cross-section of Yb:YAG[ Reference João, Wemans and Figueira10] (typically ~2.0 × 10⁻²⁰ cm2, compared with ~0.8 × 10⁻²⁰ cm2 for the σ-polarized emission of Yb:CALGO[ Reference Wang, Pan, Meng, Liu and Shen11]), an Yb:YAG thin-disk regenerative amplifier has been demonstrated to deliver a maximum uncompressed pulse energy of 550 mJ at a 1 kHz repetition rate[ Reference Pfaff, Rampp, Herkommer, Jung, Teisset, Klingebiel and Metzger12]. However, owing to pronounced gain narrowing, the compressed pulse duration in Yb:YAG-based systems is typically limited to the sub-picosecond regime. In addition, the large temporal stretching necessitates a larger grating area and a larger compressor volume. For broadband-emission bulk crystals, such as Yb:KGW, Yb:CALGO and Yb:CALYO, cascaded dual-crystal configurations are commonly employed to deliver higher pulse energies while maintaining short compressed pulse duration. In 2025, Zhu et al. [ Reference Zhu, Song, Peng, Shen, Gao, Liu and Leng13] demonstrated a dual-crystal Yb:CALGO regenerative amplifier delivering 11.3 mJ pulse energy at a repetition rate of 1 kHz. Despite the high gain enabled by the cascaded configuration, significant gain narrowing reduced the amplified spectral bandwidth from 17.5 to 9.0 nm, resulting in a compressed pulse duration of 198 fs. In the same year, Xu et al. [ Reference Xu, Song, Peng, Gao, Shen, Liu, Zhu and Leng14] reported a dual-crystal Yb:CALGO regenerative amplifier in which wavelength-dependent loss near 1040 nm was introduced using four spectral-shaping mirrors to compensate for gain narrowing. As a result, 17.6 mJ pulses were generated with a compressed pulse duration of 137 fs. Recently, a dual-crystal Yb:CALYO regenerative amplifier has been demonstrated to deliver a single-pulse energy of 6.5 mJ at a 5 kHz repetition rate with a pulse duration shorter than 200 fs [ Reference Wang, Wu, Huang, Zhang, Zheng, Yu, Bai, Xu, Tian, Wei and Zhu15]. Although cascaded dual-crystal configurations provide sufficient gain to enable pulse energies close to 20 mJ, the energy-scaling potential of single-crystal regenerative amplifiers has not yet been fully explored. In our previous work, a two-stage, double-pass traveling-wave amplification system based on Yb:CALGO was employed to realize 10-mJ-level amplification[ Reference Zhang, Zhang, Wang, Tian, Yu, Wang, Zhou, Wei and Zhu16]. The results not only verified that quasi-continuous-wave (QCW) pumping plays a critical role in enhancing the crystal gain and mitigating thermal effects but also demonstrated that 7.6 mJ of single-pulse energy could be extracted from an Yb:CALGO-based traveling-wave amplifier when 5 mJ seed pulses at a repetition rate of 1 kHz were injected. Building on these results, it is believed that, with gain narrowing effectively mitigated, single-pulse energies exceeding 10 mJ could be achieved using a single-crystal Yb:CALGO regenerative amplifier.
In this work, we present such a 10-mJ-level regenerative amplifier based on an Yb:CALGO single crystal, delivering sub 200-fs pulse duration at a repetition rate of 1 kHz through effective gain narrowing suppression. By incorporating a specially designed polarization-spectral filter (PSF) to pre-shape the seed spectrum via wavelength-dependent loss, the amplified spectrum preserved an FWHM of 10.1 nm, closely matching the original 12.0 nm seed bandwidth, indicating that gain narrowing was effectively mitigated. Under QCW pumping, a maximum amplified pulse energy of 11.2 mJ was achieved while maintaining excellent beam quality, with M 2 values of 1.08 and 1.17 along the X and Y directions, respectively. Finally, a double-pass single-grating compressor was employed for temporal pulse compression, yielding a final pulse duration of 198 fs.
2 Experimental setup
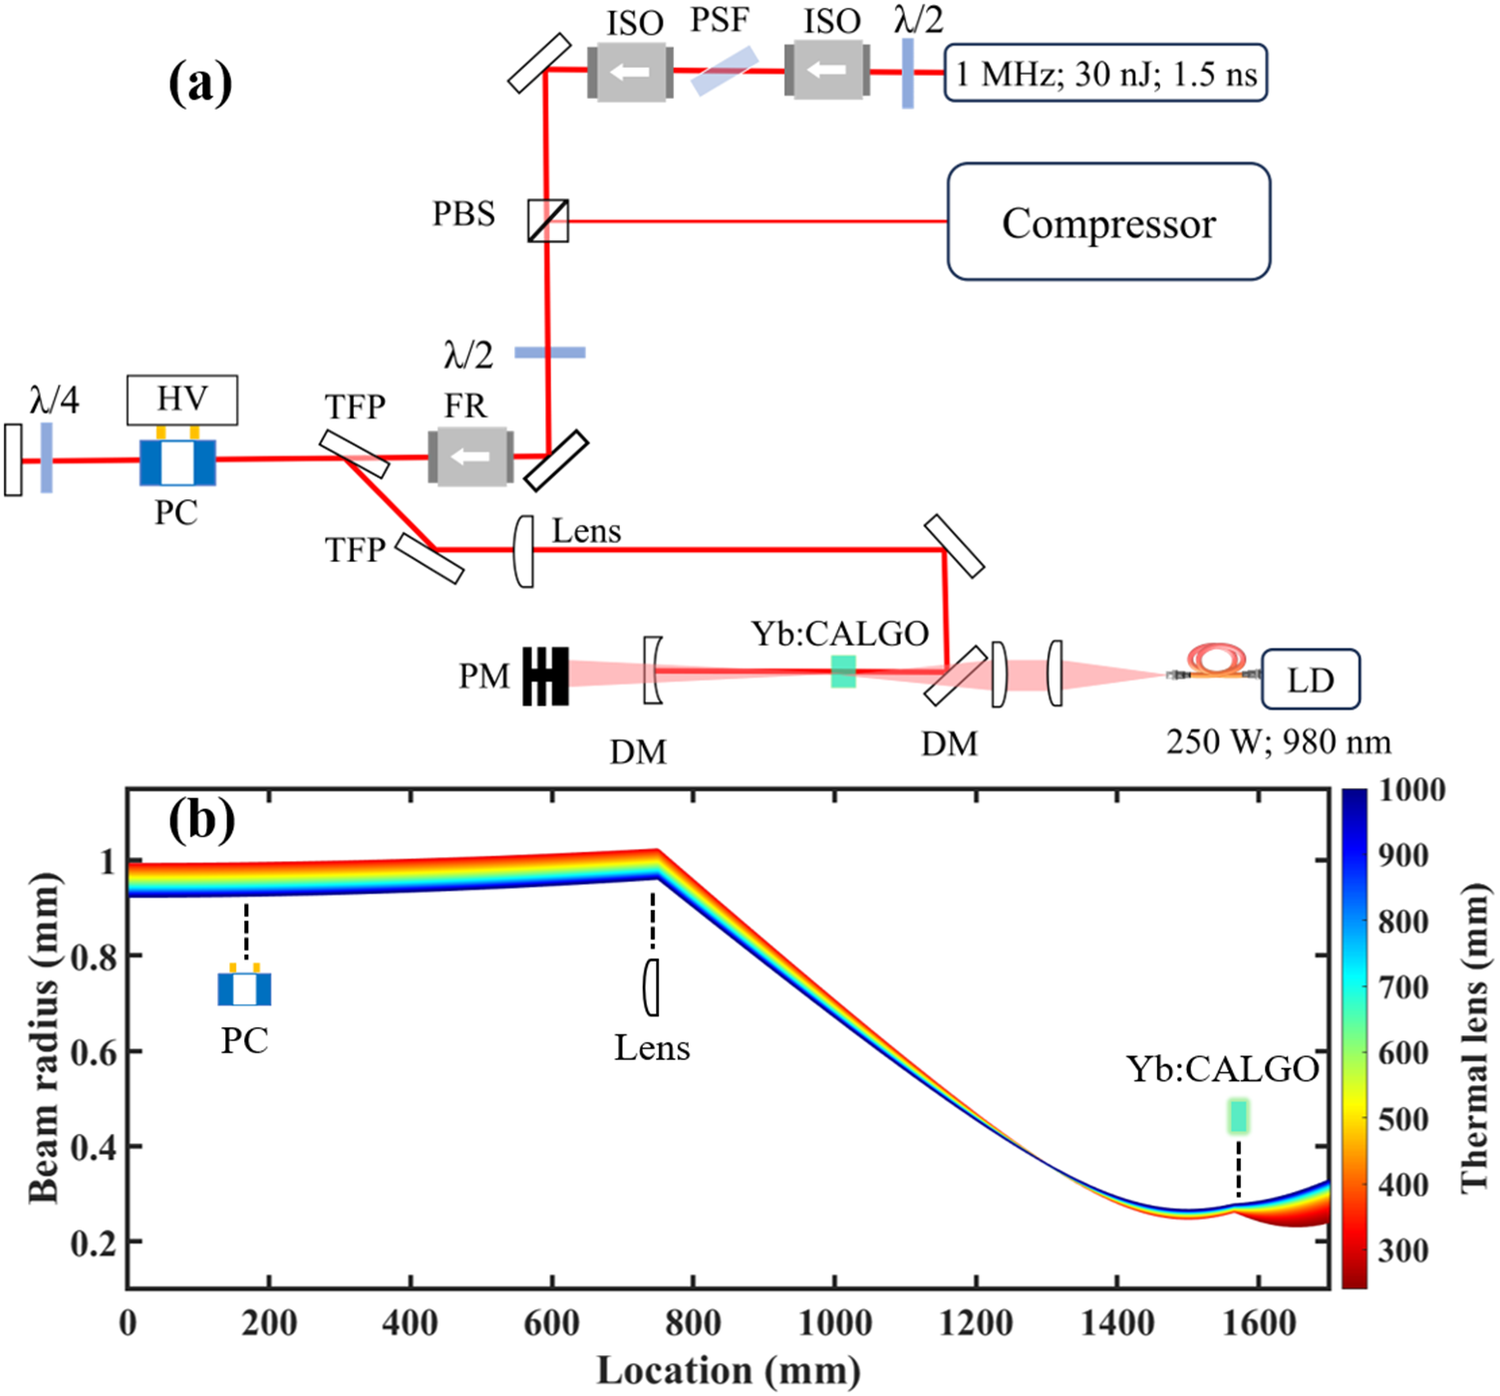
A fiber-based front end provided the seed pulses with an energy of 30.0 nJ at a repetition rate of 1 MHz. The pulses were temporally stretched to approximately 1.5 ns using a chirped fiber Bragg grating (CFBG). The seed spectrum was centered at 1032.6 nm with an FWHM of 12.0 nm. The QCW laser diode module provided up to 250 W of peak pump power at a central wavelength of 980 nm through a fiber with a 135 μm core diameter, operating with a minimum duty cycle of 40% at a repetition rate of 1 kHz. A digital delay generator (DG645) was used to synchronize the seed pulses, Pockels cell trigger and QCW pump pulses. A 1.5% (atomic fraction) Yb:CALGO crystal with dimensions of 3 mm × 3 mm × 8 mm was employed as the gain medium. The crystal was wrapped with indium foil and mounted in a water-cooled heat sink to ensure efficient thermal management. The thermal lens focal lengths were measured based on previous work on traveling-wave amplifiers using Yb:CALGO crystals[ Reference Zhang, Zhang, Wang, Tian, Yu, Wang, Zhou, Wei and Zhu16]. The thermally insensitive design of the regenerative cavity effectively minimizes the impact of thermal load on mode matching; the simulation results of beam radius variation with different focal lengths of the thermal lens are shown in Figure 1(b).
(a) Layout of the single-crystal regenerative amplifier. PSF, polarization-spectral filter; ISO, isolator; FR, Faraday rotator; DM, dichroic mirror; PBS, polarization beam splitter; LD, laser diode; λ/2 and λ/4, half- and quarter-waveplates; PC, Pockels cell; TFP, thin film polarizer; PM, power meter (the non-absorbed pump beam is transmitted by the DM, and the intensities were measured by the power meter in real time). (b) Beam radius variation with different focal lengths of the thermal lens.

Figure 1 Long description
Panel a shows a schematic diagram of an optical system. The path begins at a seed source labeled 1 M H z, 30 n J, 1.5 n s. The beam passes through a lambda over 2 waveplate, an I S O, a P S F, and a second I S O. It reflects off a mirror into a P B S, which connects to a Compressor. The path continues through another lambda over 2 waveplate, a mirror, an F R, and a T F P. A branch leads to a P C with H V and a lambda over 4 waveplate. The main path continues through a second T F P, a Lens, and reflects off a mirror into the amplifier cavity. The cavity contains two D M units, a Y b colon C A L G O crystal, and a P M. A pump source L D (250 W, 980 n m) is coupled via fiber and lenses through the D M.
Panel b is a line graph. The x-axis is Location in m m from 0 to 1600. The y-axis is Beam radius in m m from 0 to 1. A color scale on the right represents Thermal lens in m m from 300 (red) to 1000 (blue). The data shows a multi-colored band representing different thermal lens focal lengths. The beam radius starts near 1 m m, remains relatively flat past the P C at 200 m m, peaks slightly at the Lens near 750 m m, then sharply decreases to a minimum near 0.25 m m at the Y b colon C A L G O crystal located at approximately 1580 m m.
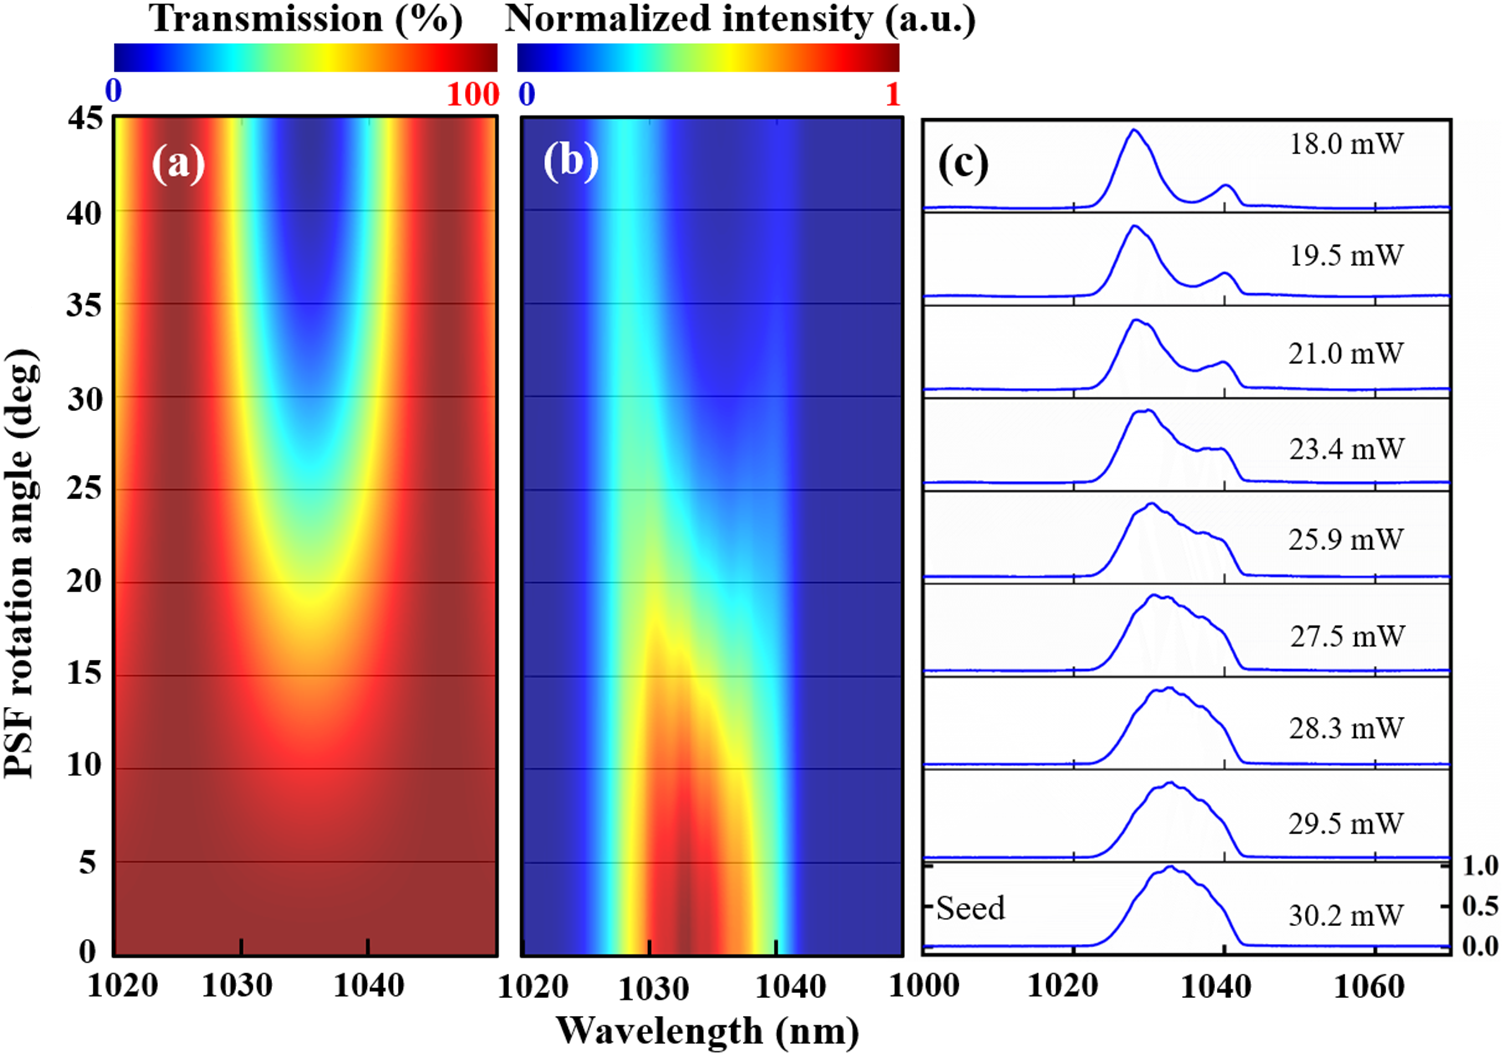
In the experiment, the PSF was implemented utilizing an 8-mm-thick uncoated uniaxial crystal with a specific crystallographic orientation, precisely positioned at the Brewster’s angle between the isolators. Rotating the PSF creates a tunable spectral dip with transmission adjustable between 10% and 90% at a central wavelength of 1036 nm. The simulated and experimental results of the PSF are plotted in Figure 2. Within a single tuning period (corresponding to a rotation angle from 0° to 45°), the PSF introduces a continuously adjustable, wavelength-dependent loss centered near 1036 nm. During amplification, the output spectrum was monitored in real time while the PSF was carefully adjusted. As the pump peak power was gradually scaled up, the spectral transmission was dynamically optimized to maintain the broadest possible amplified spectral FWHM.
Numerical simulations and experimental validation of the PSF. (a) Simulated transmission characteristics of the PSF at various rotation angles. (b) Corresponding simulated spectral evolution induced by PSF rotation. (c) Measured output spectra and their corresponding output powers.

Figure 2 Long description
Panel a is a heatmap showing Transmission percentage. The y-axis is P S F rotation angle in degrees from 0 to 45. The x-axis is Wavelength in nanometers from 1020 to 1050. A U-shaped blue region of low transmission is centered at 1035 nanometers, widening as the angle increases toward 45 degrees, surrounded by red high-transmission regions.
Panel b is a heatmap of Normalized intensity in arbitrary units. It shares the same axes as panel a. A vertical band of high intensity (red and yellow) is concentrated between 1030 and 1040 nanometers at low rotation angles. As the angle increases, the intensity shifts and narrows toward the blue spectrum.
Panel c is a vertical series of nine line graphs showing measured output spectra. The x-axis is Wavelength from 1000 to 1070 nanometers. The y-axis for each is normalized intensity from 0.0 to 1.0. From top to bottom, the power levels are 18.0 m W, 19.5 m W, 21.0 m W, 23.4 m W, 25.9 m W, 27.5 m W, 28.3 m W, 29.5 m W, and 30.2 m W. At lower power, the spectra show two distinct peaks near 1030 and 1040 nanometers. As power increases to 30.2 m W, the peaks merge into a single broad, rounded spectral profile labeled Seed.
3 Experimental result
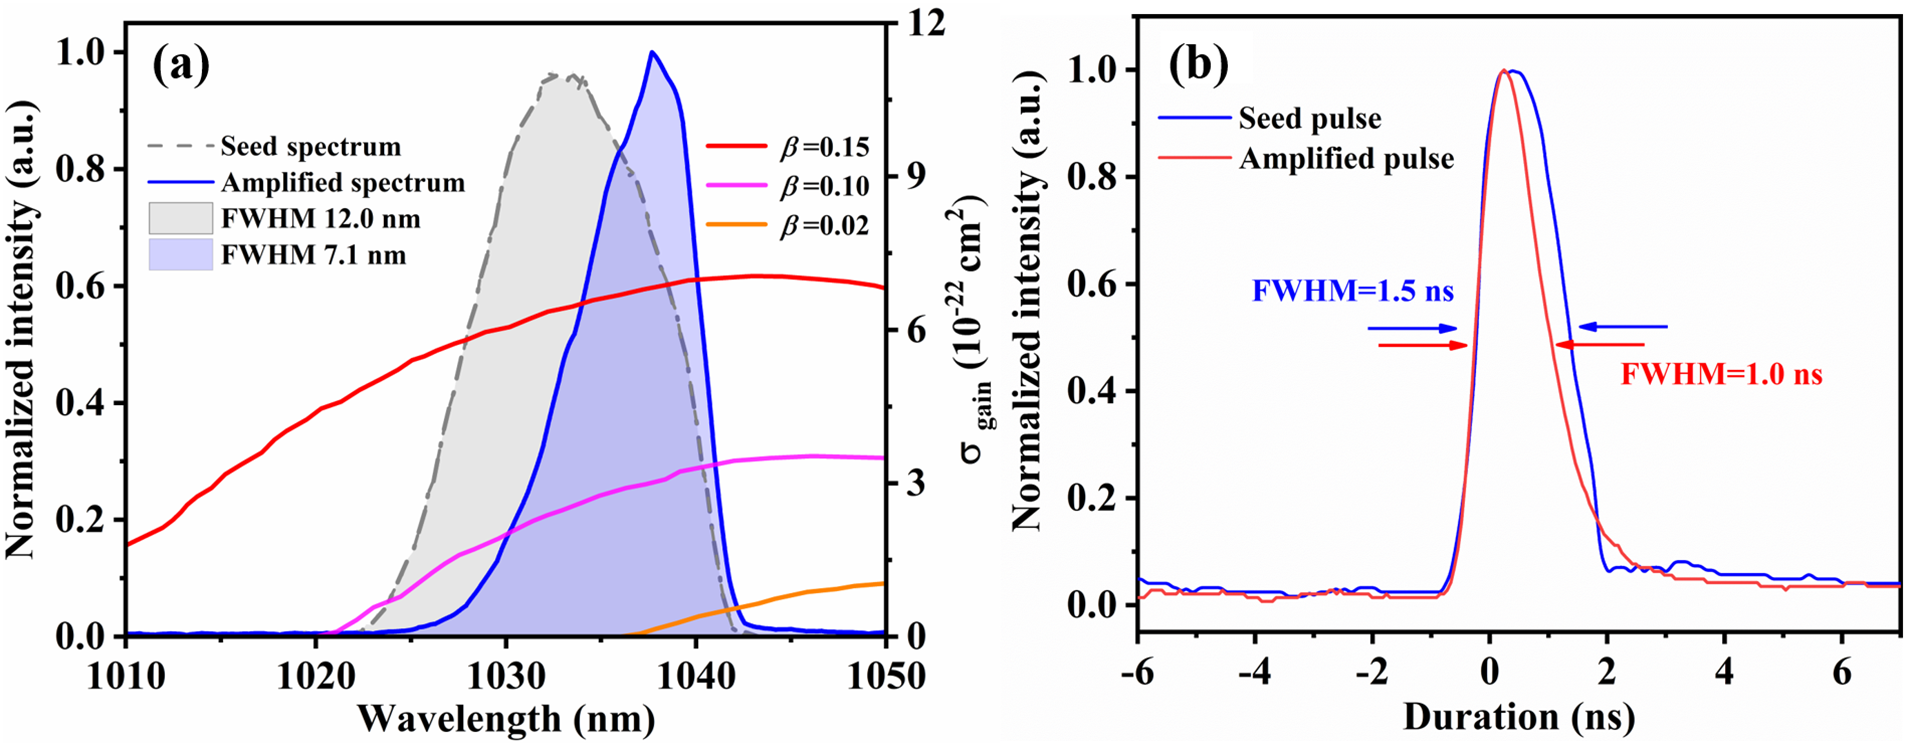
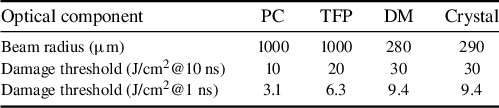
Firstly, a 30.0 nJ unshaped seed pulse was injected into the regenerative amplifier for energy amplification. The regenerative amplifier was operated at a repetition rate of 1 kHz, delivering a single-pulse energy of 5.0 mJ. On this basis, the gain narrowing effect occurring during the amplification process was systematically analyzed. Compared to the seed spectrum, the center wavelength was red-shifted from 1032.0 to 1039.5 nm according to the gain profile of Yb:CALGO, as shown in Figure 3(a). Since the regenerative amplifier provided an overall gain of 1.67 × 10⁵, pronounced spectral narrowing was observed and, as a result, the spectral FWHM decreased from 12.0 to 7.1 nm, which only supported a Fourier-transform limited (FTL) pulse duration of 250 fs. Furthermore, as is characteristic of chirped pulses, spectral narrowing was accompanied by temporal shortening of the chirped pulse. Measurements using a high-speed oscilloscope (Infiniium 9404, Keysight) and an electro-optic photodetector (ET-3500, EOT) confirmed that the temporal duration decreased from 1.5 ns (seed) to 1.0 ns (amplified). Consequently, the optical damage threshold of the cavity coatings was reduced from approximately 11 J/cm2 at 1.5 ns to approximately 9 J/cm2 at 1.0 ns, imposing a stricter limitation on further energy scaling. The calculated laser beam radius at the optical components and the corresponding coating damage thresholds are summarized in Table 1.
Regenerative amplification performance using an unshaped seed spectrum at a repetition rate of 1 kHz, yielding an output pulse energy of 5.0 mJ. (a) Seed (gray) and amplified (blue) pulse spectra and gain spectra σgain of Yb:CALGO for σ-polarization[ Reference Hasse, Calmano, Deppe, Liebald and Kränkel17]. (b) Temporal profiles of the seed pulse and the amplified pulse.

Figure 3 Long description
Panel a is a spectral plot. The horizontal axis is Wavelength in n m from 1010 to 1050. The left vertical axis is Normalized intensity in a u from 0.0 to 1.0. The right vertical axis is sigma sub gain in units of 10 super minus 22 centimeters squared from 0 to 12. A dashed gray line shows the Seed spectrum peaking at 1035 n m with a F W H M of 12.0 n m. A solid blue line shows the Amplified spectrum shifted right, peaking at 1038 n m with a F W H M of 7.1 n m. Three curves for beta values 0.15 red, 0.10 pink, and 0.02 orange show gain increasing with wavelength.
Panel b is a temporal profile plot. The horizontal axis is Duration in n s from minus 6 to 6. The vertical axis is Normalized intensity in a u from 0.0 to 1.0. A blue line represents the Seed pulse with a F W H M of 1.5 n s. A red line represents the Amplified pulse, which is narrower with a F W H M of 1.0 n s. Both pulses peak near 0.5 n s.
Beam radius at the optical components and optical coating damage thresholds a .

Table 1 Long description
The table consists of five columns and four rows.
Column headers from left to right are: Optical components, P C, T F P, D M, and Crystal.
Row 1: Beam radius in micrometers. Values are 1000 for P C, 1000 for T F P, 280 for D M, and 290 for Crystal.
Row 2: Damage threshold in Joules per centimeter-squared at 10 nanoseconds. Values are 10 for P C, 20 for T F P, 30 for D M, and 30 for Crystal.
Row 3: Damage threshold in Joules per centimeter-squared at 1 nanosecond. Values are 3.1 for P C, 6.3 for T F P, 9.4 for D M, and 9.4 for Crystal.
Abbreviations used: P C stands for Pockels cell, T F P stands for thin film polarizer, and D M stands for dichroic mirror.
a The designed coating damage thresholds are specified at a pulse duration of 10 ns. The equivalent thresholds for a 1.0 ns pulse duration were calculated according to the formula provided by Thorlabs[ 18]. PC, Pockels cell; TFP, thin film polarizer; DM, dichroic mirror.
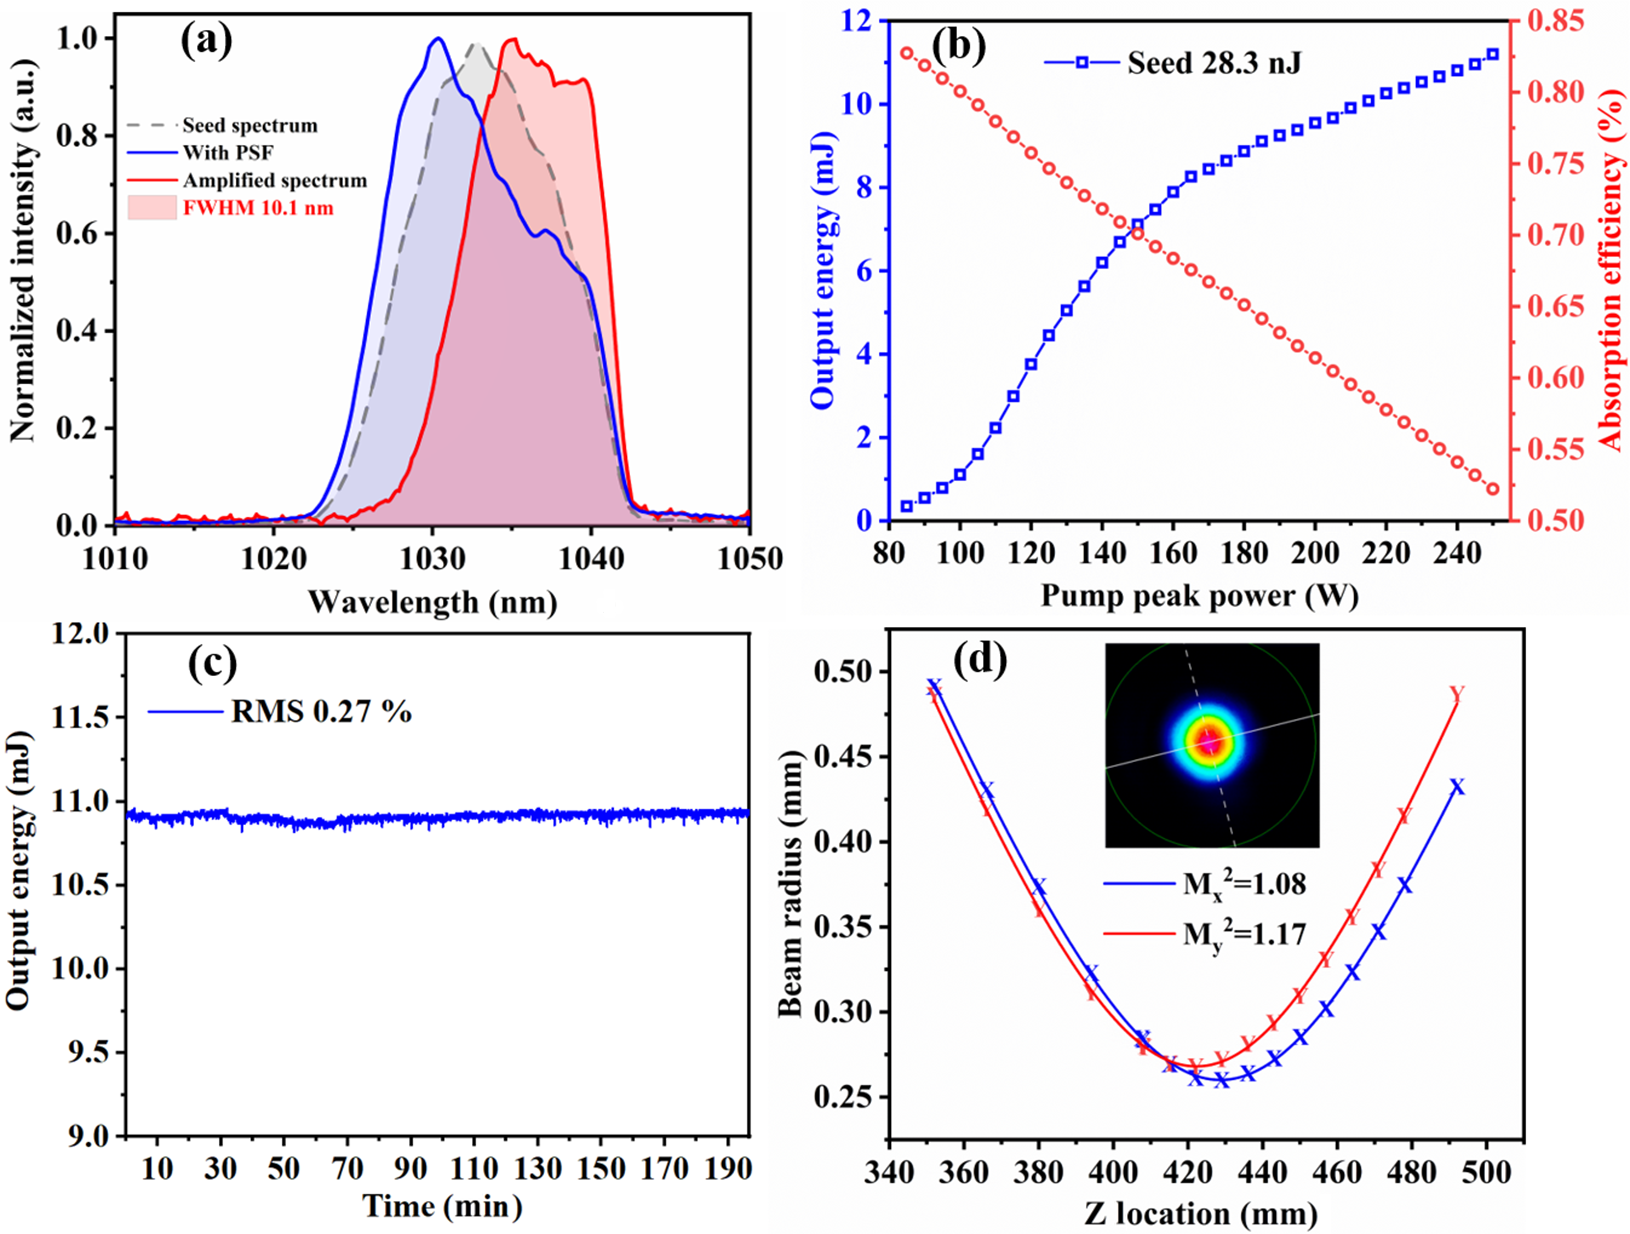
(a) Original seed spectrum (gray), seed spectrum with the spectral shaper (blue) and corresponding amplified spectrum at 10.8 mJ (red). (b) Amplified output energy (blue) and pump absorption efficiency (red) as a function of pump peak power. (c) Output power stability of the regenerative amplifier measured over 200 minutes before compression. (d) Beam quality measurement M 2 at 10.8 mJ.

Figure 4 Long description
Panel a is a line graph of Normalized intensity in a.u. versus Wavelength in n m from 1010 to 1050. A dashed grey line shows the seed spectrum peaking at 1033 n m. A solid blue line shows the spectrum with P S F peaking at 1030 n m. A solid red line shows the amplified spectrum with a F W H M of 10.1 n m peaking at 1035 n m.
Panel b is a dual-axis line graph of Pump peak power in W from 80 to 250. The left y-axis is Output energy in m J, showing a blue curve with square markers that increases from 0 to 11.2 m J. The right y-axis is Absorption efficiency in percent, showing a red curve with circular markers that decreases linearly from 0.83 to 0.52.
Panel c is a line graph of Output energy in m J versus Time in Minutes from 0 to 200. The data shows a stable blue line fluctuating slightly around 10.9 m J with an R M S of 0.27 percent.
Panel d is a line graph of Beam radius in m m versus Z Location in m m from 340 to 500. Two parabolic curves are shown: a blue line for M sub x super 2 equals 1.08 and a red line for M sub y super 2 equals 1.17. Both curves reach a minimum radius of approximately 0.26 m m near a Z location of 425 m m. An inset shows a circular heat map of the beam profile with a red core and blue perimeter.
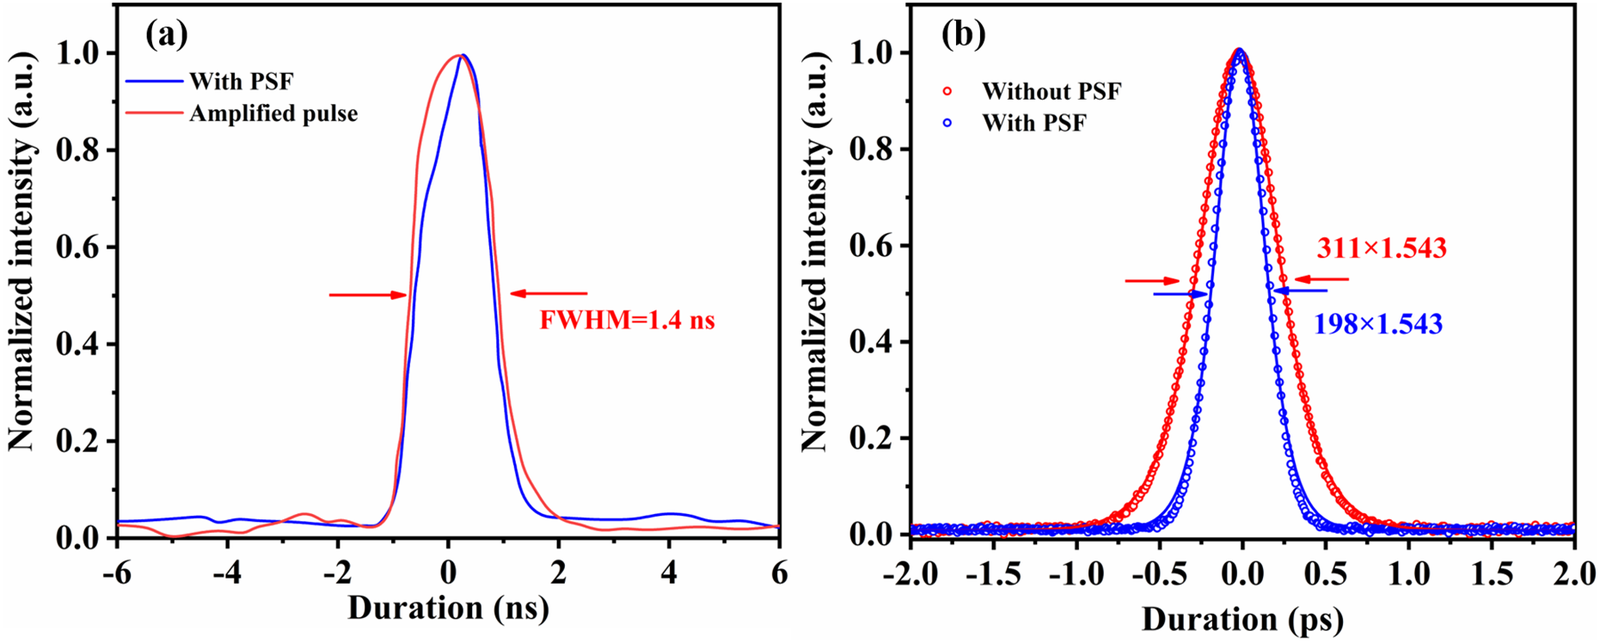
(a) Temporal pulse profiles of the seed pulse shaped with the PSF (blue) and the amplified pulse (red), along with (b) a comparison of pulse compression results with and without the PSF. The intensity autocorrelation trace of the output pulses is shown with a sech2 fit.

Figure 5 Long description
A two-panel line graph.
Panel a: The x-axis is Duration in n s ranging from minus 6 to 6. The y-axis is Normalized intensity in a. u. ranging from 0.0 to 1.0. A blue line labeled With P S F shows a pulse peak centered at 0. A red line labeled Amplified pulse shows a slightly broader peak. Red horizontal arrows indicate the width of the red peak with the text F W H M equals 1.4 n s.
Panel b: The x-axis is Duration in p s ranging from minus 2.0 to 2.0. The y-axis is Normalized intensity in a. u. ranging from 0.0 to 1.0. Red open circles represent data Without P S F, forming a wider bell-shaped curve with a solid red fit line. Blue open circles represent data With P S F, forming a narrower bell-shaped curve with a solid blue fit line. Red arrows point to the width of the red curve with the text 311 times 1.543. Blue arrows point to the width of the blue curve with the text 198 times 1.543. Both curves are centered at 0.0 p s.
To compensate for the relatively high gain of the Yb:CALGO crystal near 1040 nm and achieve a broader, more balanced amplified spectrum, an effective approach is to pre-shape the seed spectrum to match the inverse of the accumulated gain profile. Accordingly, a PSF was introduced to provide wavelength-dependent loss at 1036 nm with an insertion loss of only 5.7%; the seed spectrum after passing through the PSF is depicted by the blue curve in Figure 4(a). With an injected seed pulse energy of 28.3 nJ, a maximum output pulse energy of 11.2 mJ at 1 kHz was achieved under a pump peak power of 250 W and an optimal pump duty cycle of approximately 42%[ Reference Zhang, Zhang, Wang, Tian, Yu, Wang, Zhou, Wei and Zhu16]. The measured output energy of the regenerative amplifier as a function of pump peak power is depicted in Figure 4(b), with the regenerative amplifier operating at 35 roundtrips. Due to the saturation effect at higher pump peak powers, the pump absorption efficiency decreased from 84% to 52%, with a maximum absorbed pump average power of 54.6 W and an optical-to-optical efficiency of 20.5%. At an output pulse energy of 10.8 mJ before compression, the amplified spectrum exhibited an FWHM of 10.1 nm, closely preserving the 12.0 nm bandwidth of the seed spectrum. Furthermore, the amplification-induced red shift was partially suppressed, with the central wavelength shifting from 1032.1 to 1036.3 nm, as shown in Figure 4(a). The measured power stability over 200 minutes was 0.27%, as shown in Figure 4(c). The output beam exhibited a nearly TEM00 profile with a spot ellipticity of 0.96, and the M 2 values were measured to be 1.08 and 1.17 along the X- and Y-axes, respectively.
The temporal seed pulse profile after spectral shaping is shown in Figure 5(a). Within the time window from –0.8 to 0 ns, a noticeably reduced slope on the leading edge of the pulse is observed in the blue curve of Figure 5(a), which is consistent with the shaped spectral profile represented by the blue curve in Figure 4(a). This feature can be attributed to the Fourier-transform relationship between the temporally stretched pulse and its corresponding spectrum[ Reference Goda, Solli, Tsia and Jalali19, Reference Goda and Jalali20]. When the pulse energy is amplified to 11.2 mJ, the temporal pulse duration decreases slightly from 1.5 ns for the original seed pulse to 1.4 ns, indicating that the PSF effectively preserves the temporal characteristics during energy amplification. Figure 5(b) presents the temporal profile of the amplified pulse after grating-based compression. The compression was realized using a double-pass single-grating configuration with a 1700 lines/mm transmission grating, and the pulse duration was measured with an intensity autocorrelator (APE, PulseCheck NX150). For reference, the unshaped seed spectrum was amplified only to 5 mJ to avoid optical damage, yielding a compressed pulse duration of 311 fs. By contrast, with the seed spectrum shaped using the PSF, the pulse was amplified to 11.2 mJ and compressed under the same configuration, achieving a final pulse duration of 198 fs without any pedestal with a compression efficiency of 80.5%. Furthermore, the 8-mm-thick PSF introduces a dispersion of merely 152 fs2, which is entirely negligible when compared to the massive dispersion required to stretch the seed pulse duration to 1.5 ns.
4 Conclusion
In conclusion, we have demonstrated a high-energy regenerative amplifier based on a single bulk Yb:CALGO crystal. A maximum single-pulse energy of 11.2 mJ was directly obtained from the regenerative amplifier at a repetition rate of 1 kHz, with measured M 2 values of 1.08 and 1.17 along the X- and Y-axes, respectively. More importantly, we propose a PSF-based spectral-shaping method to mitigate gain narrowing in regenerative amplification. The original seed spectrum exhibited an FWHM of 12.0 nm, and the amplified spectrum preserved an FWHM of 10.1 nm, demonstrating effective suppression of gain narrowing. After pulse compression, a compressed pulse duration of 198 fs was achieved. We have demonstrated that gain narrowing in Yb:CALGO-based regenerative amplifiers can be significantly suppressed by shaping the seed spectrum via the PSF, thereby mitigating the risk of optical coating damage and improving pulse compressibility. Looking ahead, combining PSF-based spectral shaping with the enhanced thermal management offered by a dual-crystal regenerative amplifier is expected to enable single-pulse energies exceeding 10 mJ at repetition rates up to 10 kHz, with compressed pulse durations below 100 fs. This advanced architecture holds great promise as a driving source for high-flux attosecond pulse generation and high-energy terahertz radiation.
Acknowledgements
This work was supported by the National Key Research and Development Program of China (Grant No. 2022YFB4601102), the National Natural Science Foundation of China (Grant Nos. 62435014 and 12474347), the Natural Science Basic Research Program of Shaanxi Province (Grant No. 2025JC-TBZC-13), the Innovation Capability Support Program of Shaanxi (Grant No. 2025ZC-KJXX-23) and the Fundamental Research Funds for the Central Universities (Grant No. QTZX25079).

 Open access

