


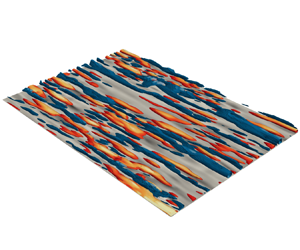





1. Introduction
Since the early days of turbulence research, there have been multiple attempts to decompose the flow into different components to facilitate its physical understanding, control its behaviour and devise reduced-order models. One of the earliest examples is the Reynolds decomposition (Reynolds Reference Reynolds1895), which divides the velocity field into its mean and fluctuating components. More sophisticated approaches rapidly emerged, aiming at extracting the coherent structure of the flow through correlations and structure identification (Robinson Reference Robinson1991; Panton Reference Panton2001; Adrian Reference Adrian2007; Smits, McKeon & Marusic Reference Smits, McKeon and Marusic2011; McKeon Reference McKeon2017; Jiménez Reference Jiménez2018). This interest is justified by the hope that insights into the dynamics can be gained by analysing a subset of the entire flow, while the remaining incoherent flow plays only a secondary role in understanding the overall dynamics. In this work, we introduce a method to decompose turbulent flow fields into informative and non-informative components, referred to as informative and non-informative decomposition (IND), such that the informative component contains all the useful information for physical understanding, modelling and control with respect to a given quantity of interest.
The quest to divide turbulent flows in terms of coherent and incoherent motions has a long history, tracing back to the work of Theodorsen (Reference Theodorsen1952), and has been a subject of active research since the pioneering experimental visualisations of Kline et al. (Reference Kline, Reynolds, Schraub and Runstadler1967) and the identification of large-scale coherent regions in mixing layers by Brown & Roshko (Reference Brown and Roshko1974). Despite this rich history, the field still lacks consensus about the definition of a coherent structure due to the variety of interpretations proposed by different researchers. One of the initial approaches to distinguish turbulent regions was the turbulent/non-turbulent discriminator circuits introduced by Corrsin & Kistler (Reference Corrsin and Kistler1954). Since then, single- and two-point correlations have become conventional tools for identifying coherent regions within the flow (e.g. Sillero, Jiménez & Moser Reference Sillero, Jiménez and Moser2014). The development of more sophisticated correlation techniques, such as the linear stochastic estimation (Adrian & Moin Reference Adrian and Moin1988) – together with its extensions (Tinney et al. Reference Tinney, Coiffet, Delville, Hall, Jordan and Glauser2006; Baars & Tinney Reference Baars and Tinney2014; Encinar & Jiménez Reference Encinar and Jiménez2019) – and the characteristic-eddy approach (Moin & Moser Reference Moin and Moser1989), has further improved our understanding of the coherent structure of turbulence. An alternative set of methods focuses on decomposing the flow into localised regions where certain quantities of interest are particularly intense. The first attempts, dating back to the 1970s, include the variable-interval time average method (Blackwelder & Kaplan Reference Blackwelder and Kaplan1976) for obtaining temporal structures of bursting events, and its modified version, the variable-interval space average method (Kim Reference Kim1985) for characterising spatial rather than temporal structures. With the advent of larger databases and computational resources, more refined techniques have emerged to extract three-dimensional, spatially localised flow structures. These include investigations into regions of rotating fluid (e.g. vortices; Moisy & Jiménez Reference Moisy and Jiménez2004; Del Álamo et al. Reference Del Álamo, Jiménez, Zandonade and Moser2006), motions carrying most of the kinetic energy (e.g. regions of high- and low-velocity streaks; Hwang & Sung Reference Hwang and Sung2018; Bae & Lee Reference Bae and Lee2021), and those responsible for most of the momentum transfer in wall turbulence (e.g. quadrant events and uniform momentum zones; Meinhart & Adrian Reference Meinhart and Adrian1995; Adrian, Meinhart & Tomkins Reference Adrian, Meinhart and Tomkins2000; Lozano-Durán, Flores & Jiménez Reference Lozano-Durán, Flores and Jiménez2012; Lozano-Durán & Jiménez Reference Lozano-Durán and Jiménez2014; de Silva, Hutchins & Marusic Reference de Silva, Hutchins and Marusic2016; Wallace Reference Wallace2016).
The methods described above offer a local-in-space characterisation of coherent structures, in contrast to the global-in-space modal decompositions of turbulent flows (Taira et al. Reference Taira, Brunton, Dawson, Rowley, Colonius, McKeon, Schmidt, Gordeyev, Theofilis and Ukeiley2017, Reference Taira, Hemati, Brunton, Sun, Duraisamy, Bagheri, Dawson and Yeh2020). One of the first established global-in-space methods is the proper orthogonal decomposition (POD) (Lumley Reference Lumley1967), wherein the flow is decomposed into a series of eigenmodes that optimally reconstruct the energy of the field. This method has evolved in different directions, such as space-only POD (Sirovich Reference Sirovich1987), spectral POD (Towne, Schmidt & Colonius Reference Towne, Schmidt and Colonius2018) and conditional POD (Schmidt & Schmid Reference Schmidt and Schmid2019), to name a few. Another popular approach is dynamic mode decomposition (DMD) (Schmid Reference Schmid2010; Schmid et al. Reference Schmid, Li, Juniper and Pust2011), along with decompositions based on the spectral analysis of the Koopman operator (Rowley et al. Reference Rowley, Mezić, Bagheri, Schlatter and Henningson2009; Mezić Reference Mezić2013). Similar to POD, various modifications of DMD have been developed, e.g. the extended DMD (Williams, Kevrekidis & Rowley Reference Williams, Kevrekidis and Rowley2015), the multi-resolution DMD (Kutz, Fu & Brunton Reference Kutz, Fu and Brunton2016), and the high-order DMD (Le Clainche & Vega Reference Le Clainche and Vega2017) (see Schmid (Reference Schmid2022) for a review). The POD and DMD methods do not explicitly account for nonlinear interactions. To overcome this, extensions to detect quadratic nonlinear interactions based on the bispectrum have also been developed (Baars & Tinney Reference Baars and Tinney2014; Schmidt Reference Schmidt2020). Another noteworthy modal decomposition approach is empirical mode decomposition, first proposed by Huang et al. (Reference Huang, Shen, Long, Wu, Shih, Zheng, Yen, Tung and Liu1998) and recently used in the field of fluid mechanics (e.g. Cheng et al. Reference Cheng, Li, Lozano-Durán and Liu2019). While the methods listed above are purely data-driven, other modal decompositions, such as resolvent analysis and input–output analysis, are grounded in the linearised Navier–Stokes equations (Trefethen et al. Reference Trefethen, Trefethen, Reddy and Driscoll1993; Jovanović & Bamieh Reference Jovanović and Bamieh2005; McKeon & Sharma Reference McKeon and Sharma2010). It has been shown that POD, DMD and resolvent analysis are equivalent under certain conditions (Towne et al. Reference Towne, Schmidt and Colonius2018). Recently, machine learning has opened new opportunities for nonlinear modal decompositions of turbulent flows (Brunton, Noack & Koumoutsakos Reference Brunton, Noack and Koumoutsakos2020).
The flow decomposition approaches presented above, either local or global in space, have greatly contributed to advancing our knowledge about the coherent structure of turbulence. Nonetheless, there are still open questions, especially regarding the dynamics of turbulence, that cannot be answered easily by current methodologies. Part of these limitations stems from the linearity of most methods, yet turbulence is a nonlinear system. A more salient issue perhaps lies in the fact that current methods (with exceptions, such as the extended POD; Borée Reference Borée2003) tend to focus on decomposing source variables without accounting for other target variables of interest. In general, it is expected that different target variables would require different decomposition approaches of the source variable. For example, we might be interested in a decomposition of the velocity that is useful for understanding the wall shear stress. Hence the viewpoint adopted here aims to answer the question: what part of the flow is relevant to understanding the dynamics of another variable? In this context, coherent structures are defined as those containing the useful information needed to understand the evolution of a target variable.
The concept of information alluded to above refers to the Shannon information (Shannon Reference Shannon1948; Cover & Thomas Reference Cover and Thomas2006), i.e. the average unpredictability in a random variable. The systematic use of information-theoretic tools for causality, modelling and control in fluid mechanics has been discussed recently by Lozano-Durán & Arranz (Reference Lozano-Durán and Arranz2022). Betchov (Reference Betchov1964) was one of the first authors to propose an information-theoretic metric to quantify the complexity of turbulence. Some works have leveraged Shannon information to analyse different aspects of two-dimensional turbulence and energy cascade models (Cerbus & Goldburg Reference Cerbus and Goldburg2013; Materassi et al. Reference Materassi, Consolini, Smith and De Marco2014; Granero-Belinchon Reference Granero-Belinchon2018; Shavit & Falkovich Reference Shavit and Falkovich2020; Lee Reference Lee2021; Tanogami & Araki Reference Tanogami and Araki2024). Information theory has also been used for causal inference in turbulent flows (Liang & Lozano-Durán Reference Liang and Lozano-Durán2016; Lozano-Durán, Bae & Encinar Reference Lozano-Durán, Bae and Encinar2019; Wang et al. Reference Wang, Chu, Lozano-Durán, Helmig and Weigand2021; Lozano-Durán & Arranz Reference Lozano-Durán and Arranz2022; Martínez-Sánchez et al. Reference Martínez-Sánchez, López, Le Clainche, Lozano-Durán, Srivastava and Vinuesa2023), and reduced-order modelling (Lozano-Durán et al. Reference Lozano-Durán, Bae and Encinar2019). The reader is referred to Lozano-Durán & Arranz (Reference Lozano-Durán and Arranz2022) for a more detailed account of the applications of information-theoretic tools in fluid mechanics.
This work is organised as follows. The formulation of the flow decomposition into informative and non-informative components is introduced in § 2: we first discuss the exact formulation of IND in §§ 2.1 and 2.2, followed by its numerically tractable approximation, aIND, in § 2.3. Section 3 demonstrates the application of the method to the decomposition of the velocity field, using wall shear stress in a turbulent channel flow as the target variable. This decomposition is leveraged for physical understanding, prediction of the wall shear stress using velocities away from the wall via convolutional neural networks, and drag reduction through opposition control. Finally, conclusions are presented in § 4.
2. Methodology
2.1. The IND of the source variable
Let us denote the source variable by  $\boldsymbol {\varPhi }(\boldsymbol {x},t)$, with
 $\boldsymbol {x} \in \varOmega _{\boldsymbol {\varPhi }}$, and the target variable by
 $\boldsymbol {\varPsi }(\boldsymbol {x},t)$, with
 $\boldsymbol {x} \in \varOmega _{\boldsymbol {\varPsi }}$, where
 $\boldsymbol {x}$ and
 $t$ represent the spatial and time coordinates, respectively. For example, in the case of a turbulent channel flow, the source variable could be the velocity fluctuations defined over the entire domain,
 $\boldsymbol {\varPhi }(\boldsymbol {x},t) = \boldsymbol {u}(\boldsymbol {x},t)$, and the target variable could be the shear stress vector at every point over one of the walls,
 $\boldsymbol {\varPsi }(\boldsymbol {x},t) = \boldsymbol {\tau }_w(\boldsymbol {x},t)$, as shown in figure 1. We seek to decompose
 $\boldsymbol {\varPhi }(\boldsymbol {x},t)$ into two independent contributions: an informative contribution to the target variable in the future,
 $\boldsymbol {\varPsi }_+ = \boldsymbol {\varPsi }(\boldsymbol {x},t+\Delta T)$ with
 $\Delta T \geq 0$, and a residual term that conveys no information about
 $\boldsymbol {\varPsi }_+$ (i.e. the non-informative component):
 \begin{equation} \boldsymbol{\varPhi}(\boldsymbol{x},t) = \boldsymbol{\varPhi}_{I}(\boldsymbol{x},t) + \boldsymbol{\varPhi}_{R}(\boldsymbol{x},t), \end{equation}
where  $\boldsymbol {\varPhi }_{I}$ and
 $\boldsymbol {\varPhi }_{R}$ are the informative and residual contributions, respectively. The decomposition is referred to as IND.
Schematic of IND applied to wall-bounded turbulent flow. The source variable is the velocity fluctuation in the fluid volume  $\boldsymbol {x}\in \varOmega _{\boldsymbol {u}}$ at
 $t$, and the target variable is the wall shear stress vector at the wall at
 $t+\Delta t$. For the sake of visualisation, only the streamwise component of the velocity fluctuations and the wall shear stress is displayed. The velocity fluctuation at time
 $t$ are decomposed into their informative and residual components to the wall shear stress in the future,
 $t + \Delta t$.

To find a decomposition of the form shown in (2.1), we need to introduce a definition of information. We rely on the concept of Shannon information (Shannon Reference Shannon1948), which quantifies the average information in the variable  $\boldsymbol {\varPsi }_+$ as
 \begin{equation} H(\boldsymbol{\varPsi}_+) ={-} \sum_{\boldsymbol{S} \in {\mathcal{S}}} p_{\boldsymbol{\varPsi}_+} (\boldsymbol{\varPsi}_+ = \boldsymbol{S}) \log p_{\boldsymbol{\varPsi}_+}( \boldsymbol{\varPsi}_+ = \boldsymbol{S} ) \geq 0, \end{equation}
where  $H(\boldsymbol {\varPsi }_+)$ is referred to as the Shannon entropy or information of
 $\boldsymbol {\varPsi }_+$,
 $p_{\boldsymbol {\varPsi }_+}(\boldsymbol {\varPsi }_+ = \boldsymbol {S})$ denotes the probability of
 $\boldsymbol {\varPsi }_+$ being in the state
 $\boldsymbol {S}$, and
 ${\mathcal {S}}$ represents the set of all possible states of
 $\boldsymbol {\varPsi }_+$. The remaining information in
 $\boldsymbol {\varPsi }_+$, after discounting for the information in
 $\boldsymbol {\varPhi }$, is measured by the conditional Shannon information:
 \begin{equation} H(\boldsymbol{\varPsi}_+\,|\,\boldsymbol{\varPhi}) ={-} \sum_{\boldsymbol{S} \in {\mathcal{S}}} \sum_{\boldsymbol{R} \in {\mathcal{R}}} p_{\boldsymbol{\varPsi}_+,\boldsymbol{\varPhi}}(\boldsymbol{S},\boldsymbol{R}) \log \frac{p_{\boldsymbol{\varPsi}_+,\boldsymbol{\varPhi}}(\boldsymbol{S},\boldsymbol{R})}{p_{\boldsymbol{\varPhi}}(\boldsymbol{R})} \geq 0, \end{equation}
where  $p_{\boldsymbol {\varPsi }_+,\boldsymbol {\varPhi }}$ is the joint probability distribution of
 $\boldsymbol {\varPsi }_+$ and
 $\boldsymbol {\varPhi }$,
 $\boldsymbol {R}$ is a particular state of
 $\boldsymbol {\varPhi }$, and
 ${\mathcal {R}}$ is the set of all possible states of
 $\boldsymbol {\varPhi }$. The difference between (2.2) and (2.3) quantifies the amount of shared information between the variables,
 \begin{equation} I(\boldsymbol{\varPsi}_+; \boldsymbol{\varPhi}) = H( \boldsymbol{\varPsi}_+ ) - H( \boldsymbol{\varPsi}_+ \,| \,\boldsymbol{\varPhi} ), \end{equation}
and is referred to as the mutual information between  $\boldsymbol {\varPsi }_+$ and
 $\boldsymbol {\varPhi }$. The condition
 $H(\boldsymbol {\varPsi }_+) \geq H(\boldsymbol {\varPsi }_+\,|\,\boldsymbol {\varPhi })$ – known as ‘information can't hurt’ (Cover & Thomas Reference Cover and Thomas2006) – guarantees that
 $I(\boldsymbol {\varPsi }_+; \boldsymbol {\varPhi })$ is always non-negative. The mutual information is equal to 0 only when the variables are independent, i.e.
 $p_{\boldsymbol {\varPsi }_+,\boldsymbol {\varPhi }}(\boldsymbol {S},\boldsymbol {R}) = p_{\boldsymbol {\varPsi }_+}(\boldsymbol {S})\,p_{\boldsymbol {\varPhi }}(\boldsymbol {R})$ for all possible states
 $\boldsymbol {S} \in {\mathcal {S}}$ and
 $\boldsymbol {R} \in {\mathcal {R}}$.
We are now in a position to define the conditions that  $\boldsymbol {\varPhi }_{I}$ and
 $\boldsymbol {\varPhi }_{R}$ must satisfy. First, the informative contribution should maximise
 $I(\boldsymbol {\varPsi }_+;\boldsymbol {\varPhi }_{I})$ from (2.4), which is achieved when
 \begin{equation} I(\boldsymbol{\varPsi}_+ ; \boldsymbol{\varPhi}_{I}) = H(\boldsymbol{\varPsi}_+), \end{equation}
namely,  $\boldsymbol {\varPhi }_{I}$ contains all the information in
 $\boldsymbol {\varPsi }_+$. Equation (2.5) can be rewritten using (2.4) as
 \begin{equation} H(\boldsymbol{\varPsi}_+\,|\,\boldsymbol{\varPhi}_{I}) = 0, \end{equation}
which is mathematically equivalent to expressing  $\boldsymbol {\varPsi }_+$ as a function of
 $\boldsymbol {\varPhi }_{I}$, namely,
 $\boldsymbol {\varPsi }_+ = \boldsymbol {{\mathcal {F}}}(\boldsymbol {\varPhi }_{I})$. Second, the residual term
 $\boldsymbol {\varPhi }_{R}$ and the informative term
 $\boldsymbol {\varPhi }_{I}$ must be independent, which requires
 \begin{equation} I(\boldsymbol{\varPhi}_{R};\boldsymbol{\varPhi}_{I})=0. \end{equation}
This also ensures that the residual component has no information about  $\boldsymbol {\varPsi }_+$, namely
 $I(\boldsymbol {\varPhi }_{R};\boldsymbol {\varPsi }_+) = 0$, since
 $I(\boldsymbol {\varPhi }_{R};\boldsymbol {\varPsi }_+) \leq I(\boldsymbol {\varPhi }_{R};\boldsymbol {\varPhi }_{I})$. The previous inequality is known as the data-processing inequality, and states that no transformation of a variable can increase its information content, which can only remain the same or decrease (Cover & Thomas Reference Cover and Thomas2006, Theorem 2.8.1). In addition, since
 $\boldsymbol {\varPhi }_{R}$ and
 $\boldsymbol {\varPhi }_{I}$ are statistically independent from (2.7), the equality
 \begin{equation} \|\boldsymbol{\varPhi}\|^2 = \|\boldsymbol{\varPhi}_{I}\|^2 + \|\boldsymbol{\varPhi}_{R}\|^2 \end{equation}
is satisfied. If  $\boldsymbol {\varPhi }$ contains no information about
 $\boldsymbol {\varPsi }_+$, then
 $\|\boldsymbol {\varPhi }_{I}\|^2/\|\boldsymbol {\varPhi }\|^2 \approx 0$ and
 $\|\boldsymbol {\varPhi }_{R}\|^2/\|\boldsymbol {\varPhi }\|^2 \approx 1$. Conversely, if
 $\boldsymbol {\varPhi }$ exclusively contains all the information necessary to understand
 $\boldsymbol {\varPsi }_+$, then
 $\|\boldsymbol {\varPhi }_{I}\|^2/\|\boldsymbol {\varPhi }\|^2 = 1$. Note that, in general,
 $\boldsymbol {\varPhi }_{I}$,
 $\boldsymbol {\varPhi }_{R}$ and
 $\boldsymbol {{\mathcal {F}}}$ are functions of
 $\Delta T$, which has been omitted here for the sake of simplicity in the notation.
Since the Shannon information is based on the joint probability distribution of the variables, rather than their specific values, there may exist many functions that satisfy (2.5) and (2.7). To identify a unique solution, we impose that the informative field  $\boldsymbol {\varPhi }_{I}(\boldsymbol {x},t)$ is smooth. Note that, assuming
 $\boldsymbol {\varPhi }(\boldsymbol {x},t)$ is smooth, the previous condition also implies that the residual field must be smooth.
In summary, the necessary conditions that IND satisfies are as follows.
(i) The source variable is decomposed as the sum of the informative and residual contributions:
 $\boldsymbol {\varPhi } = \boldsymbol {\varPhi }_{I} + \boldsymbol {\varPhi }_{R}$ (2.1).
(ii) The informative field contains all the information about the target variable in the future:
$I(\boldsymbol {\varPsi }_+ ; \boldsymbol {\varPhi }_{I}) = H(\boldsymbol {\varPsi }_+)$ (2.5).(iii) The informative and residual components share no information:
$I(\boldsymbol {\varPhi }_{R} ; \boldsymbol {\varPhi }_{I}) = 0$ (2.7).(iv) The informative field is smooth.


2.2. The IND of the target variable
Alternatively, we can seek to decompose the target variable as  $\boldsymbol {\varPsi } = \boldsymbol {\varPsi }_{I} + \boldsymbol {\varPsi }_{R}$, where
 $\boldsymbol {\varPsi }_{I}$ and
 $\boldsymbol {\varPsi }_{R}$ are, respectively, the informative and residual components of
 $\boldsymbol {\varPsi }$ with respect to
 $\boldsymbol {\varPhi }_{-} = \boldsymbol {\varPhi }(\boldsymbol {x}, t - \Delta T)$, with
 $\Delta T > 0$. The constraints to be satisfied are
 \begin{equation} I( \boldsymbol{\varPhi}_{-};\boldsymbol{\varPsi}_{I} ) = H(\boldsymbol{\varPhi}_{-}), \quad I(\boldsymbol{\varPsi}_R;\boldsymbol{\varPsi}_I)=0, \end{equation}
together with the smoothness of  $\boldsymbol {\varPsi }_{I}$. In this case,
 $\boldsymbol {\varPsi }_I$ corresponds to the part of
 $\boldsymbol {\varPsi }$ that can explain the source variable
 $\boldsymbol {\varPhi }$ in the past, while
 $\boldsymbol {\varPsi }_R$ is the remaining term, which is agnostic to the information in the source variable.
2.3. Approximate IND
We frame the conditions of IND described in § 2.1 as a minimisation problem. To that end, several assumptions are adopted. First, (2.5) and (2.7) require calculating high-dimensional joint probability distributions, which might be impractical due to limited data and computational resources. The curse of high dimensionality comes from both the high dimensionality of  $\boldsymbol {\varPhi }$ and
 $\boldsymbol {\varPsi }$, and the large number of points in
 $\boldsymbol {x}$. To make the problem tractable, we introduce the approximate IND, or aIND for short. First, the source and target variables are restricted to be scalars,
 $\varPhi$ and
 $\varPsi$, respectively. Second, we consider only two points in space:
 $\varPhi (\boldsymbol {x}, t)$ and
 $\varPsi _+(\boldsymbol {x}-\Delta \boldsymbol {x}, t + \Delta T)$, where
 $\boldsymbol {x}$ and
 $\Delta \boldsymbol {x}$ are fixed. This reduces the problem to the computation of two-dimensional joint probability distributions, which is trivially affordable in most cases, even enabling the use of experimental data.
Another difficulty arises from the constraint in (2.7), which depends on the unknown probability distribution of the variable  $\varPhi _{R} = \varPhi - \varPhi _{I}$, which adds to the complexity of the optimisation problem. To alleviate this issue, we seek to minimise
 $I(\varPhi _{R}; \varPhi _{I})$ rather than include it as a hard constraint.
Finally, provided that  $\varPhi$ and
 $\varPsi _+$ are smooth, minimising
 $\| \varPhi - \varPhi _{I} \|^2$ ensures that
 $\varPhi _{I}$ is smooth too. Therefore, we include the mean square error as a penalisation term in the minimisation problem. Thus the formulation of the aIND is posed as
 \begin{equation} \arg \min_{\varPhi_{I},{\mathcal{F}}} I(\varPhi_{R};\varPhi_{I}) + \gamma\| \varPhi - \varPhi_{I} \|^2,\quad \mathrm{s.t.}\ \varPsi_+ = {\mathcal{F}}(\varPhi_{I}), \end{equation}
where  $\gamma \geq 0$ is a regularisation constant, and
 $\varPhi _{R} = \varPhi - \varPhi _{I}$. Equation (2.10) is solved by assuming that the mapping
 ${\mathcal {F}}$ is invertible over a given interval. This allows replacing
 $\varPhi _{I}(t) = {\mathcal {F}}^{-1}(\varPsi _+(t))$ over that interval in (2.10) and solving for
 ${\mathcal {F}}^{-1}$ using standard optimisation techniques. More details about the solution of (2.10) are provided in § A.1. Equation (2.10) yields the informative and residual components for a given
 $\boldsymbol {x}$,
 $\Delta \boldsymbol {x}$ and
 $t$, denoted as
 $\varPhi _{I,\varDelta }(\boldsymbol {x},t; \Delta \boldsymbol {x})$ and
 $\varPhi _{R,\varDelta }(\boldsymbol {x},t; \Delta \boldsymbol {x})$, together with the mapping
 ${\mathcal {F}}$. We can find the best approximation to IND by selecting the value of
 $\Delta \boldsymbol {x}$ that maximises the informative component. To that end, we introduce the relative energy of
 $\varPhi _{I,\varDelta }$ as
 \begin{equation} E_I(\Delta \boldsymbol{x}; \boldsymbol{x}, \Delta T ) = \frac{\|\varPhi_{I,\varDelta}\|^2}{\|\varPhi\|^2}. \end{equation}
High values of  $E_I$ define the informative region of
 $\varPhi _{I,\varDelta }$ over
 $\varPsi _+$, and constitute the information-theoretic generalisation of the two-point linear correlation (see Appendix C). We define
 $\Delta \boldsymbol {x}^{max}$ as the shift
 $\Delta \boldsymbol {x}$ that maximises
 $E_I$ for a given
 $\boldsymbol {x}$ and
 $\Delta T$. Hence we use
 $\Delta \boldsymbol {x} = \Delta \boldsymbol {x}^{max}$ for aIND, and simply refer to the variables in this case as
 $\varPhi _{I}$ and
 $\varPhi _{R}$. During the optimisation, we ensure that
 $2\,I(\varPhi _{I};\varPhi _{R}) < 0.03~H(\varPhi _{I},\varPhi _{R})$ to guarantee that
 $\varPhi _{I}$ and
 $\varPhi _{R}$ are independent, and that (2.8) holds. We also assess a posteriori that
 $I(\varPhi _{R}; \varPsi _+)$ remains small for all
 $\boldsymbol {x}$ (see Appendix E).
Finally, we list below the main simplifications of aIND with respect to the general IND framework.
(i) The source and the target variable are restricted to be scalars.
(ii) The constraint in (2.7) is cast as the minimisation term in (2.10).
(iii) The minimisation problem in (2.10) is computed for two points in space. The closest approximation to IND is achieved by selecting the value of
$\Delta \boldsymbol {x}$ that maximises the magnitude of the informative component.(iv) Equation (2.10) is solved by assuming that the mapping
${\mathcal {F}}$ is invertible over a given interval.


Despite the simplifications above, aIND still successfully recovers the exact analytical solution in the validation cases presented in Appendix B, even outperforming correlation-based methods such as linear stochastic estimation (LSE) and extended POD (EPOD).
2.4. Validation
The methodology presented in § 2.1 and its numerical implementation (§ A.1) have been validated with several analytical examples. In this subsection, we discuss one of these examples that also illustrates the use and interpretation of the IND.
Consider the source and target fields:
 \begin{align} \text{source} \quad &\varPhi(\boldsymbol{x},t) = f(\boldsymbol{x},t) + g(\boldsymbol{x},t), \end{align}
 \begin{align} \text{target} \quad &\varPsi_+(\boldsymbol{x},t) = \varPsi(\boldsymbol{x},t+1) = 0.5\,f(\boldsymbol{x},t)^2 - 0.2\,f(\boldsymbol{x},t) + \epsilon(\boldsymbol{x},t), \end{align}
where
 $$\begin{gather} f(\boldsymbol{x},t) = 2 \sin( 2 {\rm \pi}x - 2 t )\sin( 2{\rm \pi} y ), \end{gather}$$
 $$\begin{gather}g(\boldsymbol{x},t) = \tfrac{1}{5} \sin({ 7 \sqrt{2}\,{\rm \pi} x - 0.1 t }) \sin({ 8\sqrt{3}\,{\rm \pi} y - 0.5 t}). \end{gather}$$
The source field is a combination of the streamwise travelling wave  $f$ and the lower amplitude, higher wavenumber travelling wave
 $g$. The target is a function of
 $f$ and
 $\epsilon$, where the latter is a random variable that follows the pointwise normal distribution with zero mean and standard deviation (
 $\sigma$) equal to 0.1:
 $\epsilon (\boldsymbol {x},t) \sim {\mathcal {N}}(0,\sigma )$. Snapshots of
 $\varPhi$ and
 $\varPsi$ are shown in figures 2(a,b), respectively.
Validation of aIND for the system in (2.12). (a–d) Snapshots of  $\varPhi$,
 $\varPsi _+$,
 $\varPhi _I$ and
 $\varPhi _R$, respectively. The contours range from the minimum value (dark blue) to the maximum value (dark red) for each quantity; these correspond to
 $\varPhi,\varPhi _I \approx [-2, 2]$,
 $\varPsi _+ \approx [-1.1,1.4]$ and
 $\varPhi _R \approx [-0.35, 0.35]$. (e) Contours of the joint probability
 $(\varPhi,\varPsi _+)$ from lower (white) to higher (blue) probability. The analytical solution is
 ${\mathcal {F}}^{exact}(\varPhi _{I}) = 0.5\varPhi _{I}^2 - 0.2\varPhi _{I}$ (dashed black), and the numerical solution is
 ${\mathcal {F}}(\varPhi _I)$ (orange).

For  $\Delta T = 1$ and values of
 $\sigma \to 0$, the analytical solution of the IND is
 \begin{equation} \varPhi_{I}^{exact} = f, \quad \varPhi_{R}^{exact} = g, \end{equation}
where the mapping to comply with  $H(\varPsi _+\, | \,\varPhi _{I}^{exact}) = 0$ is
 ${\mathcal {F}}^{exact}(\varPhi _{I}) = 0.5\varPhi _{I}^2 - 0.2\varPhi _{I}$, and the residual term satisfies the condition
 $I(\varPhi _{I}^{exact};\varPhi _{R}^{exact}) = 0$, since the variables are independent.
The results of solving the optimisation problem using aIND, denoted by  $\varPhi _I$,
 $\varPhi _R$ and
 ${\mathcal {F}}$, are displayed in figures 2(c–e). It can be observed that
 $\varPhi _I$ approximates well the travelling wave represented by
 $\varPhi _I^{exact}=f$. The small differences between
 $\varPhi _I$ and
 $\varPhi _I^{exact}$, also appreciable in
 $\varPhi _R$, are localised at values
 $f \approx 0.2$ and can be explained by the small discrepancies between
 ${\mathcal {F}}$ and
 ${\mathcal {F}}^{exact}$ at the minimum, as seen in figure 2(e). These are mostly a consequence of
 $\epsilon$ and the numerical implementation (see § A.1), and they diminish as
 $\sigma \rightarrow 0$. Additional validation cases, together with a comparison of aIND with EPOD and LSE, can be found in Appendix B.
3. Results
We study the aIND of the streamwise ( $u$), wall-normal (
 $v$) and spanwise (
 $w$) velocity fluctuations in a turbulent channel flow using as target the streamwise component of the shear stress at the wall,
 $\tau _x(x,z,t) = \rho \nu \,\partial U(x,0,z,t) /\partial y$, where
 $\rho$ is the fluid density,
 $\nu$ is the kinematic viscosity,
 $U$ is the instantaneous streamwise velocity, and
 $x$,
 $y$ and
 $z$ are the streamwise, wall-normal and spanwise directions, respectively. The wall is located at
 $y=0$. The data are obtained from direct numerical simulations in a computational domain of size
 $8 {\rm \pi}h \times 2 h \times 4 {\rm \pi}h$ in the streamwise, wall-normal and spanwise directions, respectively, where
 $h$ represents the channel half-height. The flow is driven by a constant mass flux imposed in the streamwise direction. The Reynolds number, based on the friction velocity
 $u_\tau$, is
 $Re_\tau = u_\tau h / \nu \approx 180$. Viscous units, defined in terms of
 $\nu$ and
 $u_\tau$, are denoted by superscript
 $*$. The time step is fixed at
 $\Delta t^* = 5 \times 10^{-3}$, and snapshots are stored every
 $\Delta t_s^* = 0.5$. A description of the numerical solver and computational details can be found in Lozano-Durán et al. (Reference Lozano-Durán, Giometto, Park and Moin2020).
The source and target variables for aIND are
 \begin{align} \text{source} \quad &u(\boldsymbol{x},t), \ v(\boldsymbol{x},t) \ \text{or} \ w(\boldsymbol{x},t), \end{align}
 \begin{align} \text{target} \quad &\tau_{x,+} = \tau_x(x-\Delta x^{max}_\square,z - \Delta z^{max}_\square,t+\Delta T), \end{align}
where  $\square =u$,
 $v$ or
 $w$. The aIND gives
 $$\begin{gather} u(\boldsymbol{x},t) = u_I(\boldsymbol{x},t) + u_R(\boldsymbol{x},t), \end{gather}$$
 $$\begin{gather}v(\boldsymbol{x},t) = v_I(\boldsymbol{x},t) + v_R(\boldsymbol{x},t), \end{gather}$$
 $$\begin{gather}w(\boldsymbol{x},t) = w_I(\boldsymbol{x},t) + w_R(\boldsymbol{x},t), \end{gather}$$
where the informative and residual components are also functions of  $\Delta T$. We focus our analysis on
 $\Delta T^* \approx 25$ unless otherwise specified. This value corresponds to the time shift at which
 $H(\tau _{x,+} \,|\, \tau _x )/H(\tau _{x,+}) \gtrsim 0.97$, meaning that
 $\tau _{x,+}$ shares no significant information with its past. For
 $\Delta T^* > 25$, the value of
 $H(\tau _{x,+} \,|\, \tau _x )$ gradually increases towards
 $H(\tau_{x,+})$ asymptotically. This value is similar to that reported by Zaki & Wang (Reference Zaki and Wang2021), who found using adjoint methods that wall observations at
 $\Delta T^* \approx 20$ are the most sensitive to upstream and near-wall velocity perturbations. The shifts
 $\Delta \boldsymbol {x}_\square ^{max} = [\Delta x^{max}_\square,\Delta z^{max}_\square ]$ for
 $\square =u$,
 $v$ or
 $w$ are computed by a parametric sweep performed in Appendix D. Their values are functions of
 $y$, but can be approximated as
 $\Delta \boldsymbol {x}_u^{max}/h \approx [-1, 0]$,
 $\Delta \boldsymbol {x}_v^{max}/h \approx [-1.2, 0]$ and
 $\Delta \boldsymbol {x}_w^{max}/h \approx [-0.8, \pm 0.15]$. Due to the homogeneity and statistical stationarity of the flow, the mapping
 ${\mathcal {F}}$ is a function of only
 $y$ and
 $\Delta T$. The validity of the approximations made in the aIND is discussed in Appendix E, where it is shown that the residual component of
 $u$ contains almost no information about the future wall shear stress. For the interested reader, we also include the relative energy field
 $E_I(\Delta \boldsymbol {x}; \boldsymbol {x}, \Delta T^* = 25)$ of the three velocity components in Appendix D.
3.1. Coherent structure of the informative and residual components of ${u}, v$ and $w$ to $\tau _x$


We start by visualising the instantaneous informative and residual components of the flow. We focus on the streamwise component, as it turns out to be the most informative to  $\tau _x$, as detailed below. Figure 3(a) displays iso-surfaces of
 $u(\boldsymbol {x},t)$, revealing the alternating high- and low-velocity streaks attached to the wall, along with smaller detached regions. The informative and residual components
 $u_I(\boldsymbol {x},t)$ and
 $u_R(\boldsymbol {x},t)$ are shown in figures 3(b,c), respectively. The structures in
 $u_I$ exhibit an alternating pattern similar to that in the original field, with the high- and low-velocity streaks located approximately in the same positions as
 $u(\boldsymbol {x},t)$. These structures are also attached to the wall, but do not extend as far as the streaks in the original field, especially for
 $u_I(\boldsymbol {x},t) > 0$. In contrast, the residual field
 $u_R(\boldsymbol {x},t)$ lacks most of the elongated streaks close to the wall, but resembles
 $u(\boldsymbol {x},t)$ far away, once the flow bears barely no information about
 $\tau _{x,+}$.
Instantaneous flow structures: (a) iso-contours of the streamwise velocity fluctuations  $u$; (b) iso-contours of the informative streamwise velocity fluctuations
 $u_I$; and (c) iso-contours of the residual streamwise velocity fluctuations
 $u_R$. In (a) and (c), the iso-contours correspond to blue for
 $u^* \approx -2.7$, red for
 $u^* \approx 2.7$; and (b) uses blue for
 $u_I^* \approx -1.8$, and orange for
 $u_I^* \approx 1.8$. The wall is coloured by the instantaneous wall shear stress at
 $\Delta T$, from
 $\tau _x^* \approx 0.5$ (white) to
 $\tau _x^* \approx 2$ (black).

Figure 4 displays the root mean squared turbulence intensities as functions of the wall distance. Note that from the minimised term in (2.10),  $\langle u^2 \rangle (y) = \langle u_I^2 \rangle (y) + \langle u_R^2 \rangle (y)$ (and similarly for the other components). From figure 4(a), we observe that
 $\langle u_I^2 \rangle ^{1/2}$ is predominantly located within the region
 $y^* \leq 50$. This finding aligns with our earlier visual assessments from figure 3. The residual component
 $\langle u_R^2 \rangle ^{1/2}$ also has a strong presence close to the wall, although it is shifted towards larger values of
 $y$. Interestingly, about half of the streamwise kinetic energy in the near-wall region originates from
 $\langle u_R^2 \rangle$, despite its lack of information about
 $\tau _{x,+}$. This phenomenon is akin to the inactive motions in wall turbulence (e.g. Townsend Reference Townsend1961; Jiménez & Hoyas Reference Jiménez and Hoyas2008; Deshpande, Monty & Marusic Reference Deshpande, Monty and Marusic2021), with the difference that here inactive structures are interpreted as those that do not reflect time variations of the wall shear stress. Another interesting observation is that
 $\langle u_I^2 \rangle ^{1/2}$ peaks at
 $y^* \approx 10$, which is slightly below the well-known peak for
 $\langle u^2 \rangle ^{1/2}$, whereas
 $\langle u_R^2 \rangle ^{1/2}$ peaks at
 $y^* \approx 30$. This suggests that the near-wall peak of
 $\langle u^2 \rangle ^{1/2}$ is controlled by a combination of active and inactive motions as defined above.
Root mean squared turbulence intensities of the (a) streamwise, (b) wall-normal and (c) spanwise velocity components: solid lines indicate the original flow field, dashed lines indicate the informative flow field, and dash-dotted lines indicate the residual field.

The root mean squared velocities for the cross-flow are shown in figures 4(b,c). The informative component of the wall-normal velocity  $\langle v_I^2 \rangle ^{1/2}$ is predominantly confined within the region
 $y^* \leq 70$, although its magnitude is small. The residual component
 $\langle v_R^2 \rangle ^{1/2}$ is the major contributor to the wall-normal fluctuations across the channel height. The dominance of
 $\langle v_R^2 \rangle ^{1/2}$ has important implications for control strategies in drag reduction, which are investigated in § 3.3. A similar observation is made for
 $\langle w^2 \rangle ^{1/2}$, with
 $\langle w_I^2 \rangle ^{1/2}$ being negligible except close to the wall for
 $y^* < 40$.
The statistical coherence of the informative and residual velocities in the wall-parallel plane is quantified with the two-point autocorrelation
 \begin{equation} C_{\phi\phi}(\Delta x, \Delta z; y_{ref}) = \frac{\langle \phi(x,y_{ref},z,t)\, \phi(x+\Delta x, y_{ref}, z+\Delta z,t) \rangle}{\langle \phi(x,y_{ref},z,t)^2 \rangle}, \end{equation}
where  $\phi$ is any component of the velocity field, and
 $y_{ref}^* = 15$. The autocorrelations are shown in figure 5 for the total, informative and residual components of the three velocities. The shape of the informative structure is elongated along the streamwise direction for the three correlations
 $C_{u_Iu_I}$,
 $C_{v_Iv_I}$ and
 $C_{w_Iw_I}$. The results for
 $u$, shown in figure 5(a), reveal that
 $u_I$ closely resembles the streaky structures of
 $u$ in terms of streamwise and spanwise lengths. On the other hand,
 $u_R$ consists of more compact and isotropic eddies in the
 $(x,z)$-plane. Figure 5(b) shows that
 $v_I$ captures the elongated motions in
 $v$, which represents a small fraction of its total energy, whereas the shorter motions in
 $v$ are contained in
 $v_R$. A similar conclusion is drawn for
 $w$, as shown in figure 5(c), where both
 $w$ and
 $w_R$ share a similar structure, differing from the elongated motions of
 $w_I$. The emerging picture from the correlations is that informative velocities tend to comprise streamwise elongated motions, whereas the remaining residual components are shorter and more isotropic. The differences between the structures of
 $v$ and
 $w$ and their informative counterparts are consistent with the lower intensities of
 $v_I$ and
 $w_I$ discussed in figure 4. It should be noted that the shape of the structures depends on the target variable, and they may differ for a different target quantity. For example, wall pressure fluctuations have been linked to more isotropic structures in the streamwise direction by several authors (Schewe Reference Schewe1983; Johansson, Her & Haritonidis Reference Johansson, Her and Haritonidis1987; Kim, Moin & Moser Reference Kim, Moin and Moser1987; Ghaemi & Scarano Reference Ghaemi and Scarano2013). The aIND may provide insights in this regard, as it has been noted in the literature that at least quadratic terms are needed to capture the interaction between the velocity and the wall pressure (Naguib, Wark & Juckenhöfel Reference Naguib, Wark and Juckenhöfel2001; Murray & Ukeiley Reference Murray and Ukeiley2003).
Autocorrelation coefficient of the velocity fluctuations in the  $y^*=15$ plane: (a) streamwise component, (b) wall normal component, and (c) spanwise component. Grey indicates the original field, blue indicates the informative field, and orange indicates the residual field. The contours correspond to
 ${C_{\square \square } = [0.05, 0.1]}$.

We now analyse the average coherent structure of the flow in the  $(y,z)$-plane. It is widely recognised in the literature that the most dynamically relevant energy-containing structure in wall turbulence comprises a low-velocity streak accompanied by a collocated roll (e.g. Kline et al. Reference Kline, Reynolds, Schraub and Runstadler1967; Kim et al. Reference Kim, Moin and Moser1987; Farrell & Ioannou Reference Farrell and Ioannou2012; Lozano-Durán et al. Reference Lozano-Durán, Flores and Jiménez2012). A statistical description of this structure can be obtained by conditionally averaging the flow around low-velocity streaks. To this end, low-velocity streaks were identified by finding local minima of
 $u$ at
 $y^* = 15$. For each streak, a local frame of reference was introduced with axes parallel to the original
 $x$,
 $y$ and
 $z$ coordinates. The origin of this local frame of reference is at the wall, such that its
 $y$-axis is aligned with the local minimum of
 $u$. The
 $z$-axis, denoted by
 $\Delta z$, points towards the nearest local maximum of
 $u$. This orientation ensures that any nearby high-speed streak is located in the region
 $\Delta z> 0$. Then the conditional average flow was computed by averaging
 $[u, v, w]$ over a window of size
 $\pm h$. The resulting conditionally averaged flow in the
 $(y,z)$-plane is shown in figure 6(a). This process was repeated for the informative and residual velocity fields using the same streaks identified previously for
 $u$. The conditionally averaged informative and residual velocities are shown in figures 6(b,c), respectively.
Conditionally averaged flow in the  $(y,z)$-plane centred about low-velocity streaks: (a) original field, (b) informative field, and (c) residual field. The contours range from blue for
 $-5 u_\tau$ to red for
 $5 u_\tau$. The arrows display the in-plane velocity components (
 $v_\square$ and
 $w_\square$).

The conditional average velocity is shown in figure 6(a), which captures the structure of the low-/high-velocity streak pair and the accompanying roll characteristic of wall-bounded turbulence. The informative velocity (figure 6b) is dominated by streak motions, although these are smaller than the streaks of the entire field. The informative wall-normal velocity is present mostly within the streaks, while the informative spanwise component is active close to the wall in the interface of the streak. Conversely, figure 6(c) shows that the residual velocity contains the large-scale streaks and the remaining spanwise motions. The emerging picture is that the informative component of the velocity contributing to the wall shear stress consists of smaller near-wall streaks collocated with vertical motions (i.e. sweeps and ejections), and spanwise velocity at the near-wall root of the roll. This informative structure is embedded within a larger-scale streak–roll structure of residual velocity, which bears no information about the wall shear stress.
We close this subsection by analysing the mappings  $\tau _{x,+} = {\mathcal {F}}_u(u_I)$,
 $\tau _{x,+} = {\mathcal {F}}_v(v_I)$,
 $\tau _{x,+} = {\mathcal {F}}_w(w_I)$ obtained from the constraints
 $H(\tau _{x,+} \,|\, u_I) = 0$,
 $H(\tau _{x,+} \,|\, v_I) = 0$,
 $H(\tau _{x,+} \,|\, w_I) = 0$, respectively. The mapping are depicted in figure 7 at the wall-normal position where the energy for
 $u_I$,
 $v_I$ and
 $w_I$ is maximum, namely,
 $y^* \approx 8$,
 $19$ and
 $6$, respectively (see Appendix D). Figure 7(a) reveals an almost linear relationship between
 $u_I$ and
 $\tau _{x,+}$ within the range
 $0 \leq \tau _{x,+}^* \leq 2$. Negative values of
 $u_I$ align with
 $\tau _{x,+}^* < 1$, while positive values of
 $u_I$ correspond to
 $\tau _{x,+}^* > 1$. This is clearly a manifestation of the proportionality between streak intensity and
 $\tau _x$, such that higher streamwise velocities translate into higher wall shear stress by increasing
 $\partial U/\partial y$. However, the process saturates, and a noticeable change in the slope occurs for larger values of
 $\tau _{x,+}$, leading to
 $u_I$ values that are relatively independent of
 $\tau _{x,+}$. This finding indicates that
 $u_I$ provides limited information about high values of
 $\tau _{x,+}$ at the time scale
 $\Delta T^*=25$. In other words, minor uncertainties in
 $u_I$ result in significant uncertainties in
 $\tau _{x,+}$ after
 $\Delta T$.
Mapping functions of the informative contributions of (a) streamwise, (b) wall-normal, and (c) spanwise velocity fluctuations to the streamwise wall shear stress for  $\Delta T^* = 25$. Plot (a) also shows the effect of the time lag
 $\Delta T$ in the mapping
 $\tau _x = {\mathcal {F}}(u_I)$. Line colours correspond as follows: dark blue for
 $\Delta T^* \approx 25$, cyan for
 $\Delta T^* \approx 10$, and light blue for
 $\Delta T^* \approx 5$. In (c), the solid line corresponds to
 $+\Delta z^{max}_w$, and the dashed line to
 $-\Delta z^{max}_w$.

The effect of  $\Delta T$ on
 ${\mathcal {F}}_u(u_I)$ is also analysed in figure 7(a). The main effect of decreasing
 $\Delta T^*$ is to decrease the slope of
 ${\mathcal {F}}_u(u_I)$ for
 $u_I^* > 5$. This result reveals that there exists a time horizon beyond which it is not possible to predict extreme events of wall shear stress from local fluctuations. Hence extreme values of the wall shear stress can be attributed to almost instantaneous high fluctuations of the streamwise velocity. The latter is in agreement with Guerrero, Lambert & Chin (Reference Guerrero, Lambert and Chin2020), who linked extreme positive wall shear stresses with the presence of high-momentum regions created by quasi-streamwise vortices.
The mapping of  $v_I$ is shown in figure 7(b), which demonstrates again a nearly linear, albeit negative, relationship between
 $v_I$ and
 $\tau _{x,+}$ in the range
 $0 \leq \tau _{x,+}^* \leq 2$. Positive values of
 $v_I$ are indicative of
 $\tau _{x,+}^*<1$, whereas negative values imply
 $\tau _{x,+}^*> 1$. Note that changes in the value of
 $\tau _{x,+}$ encompass either
 $u_I>0$ and
 $v_I<0$, or
 $u_I<0$ and
 $v_I>0$, revealing a connection between the dynamics of
 $\tau _{x,+}$ and the well-known sweep and ejection motions in wall-bounded turbulence (Wallace, Eckelman & Brodkey Reference Wallace, Eckelman and Brodkey1972; Wallace Reference Wallace2016). The mappings also show that excursions into large wall shear stresses are caused by sweeps. Analogous to
 $u_I$, the value of
 $v_I$ remains approximately constant for
 $\tau _{x,+}^*>2$. Beyond that threshold,
 $v_I$ provides no information about
 $\tau _{x,+}$.
The mapping of  $w_I$ presents two maxima (
 $\pm \Delta z_w^{max}$) due to the spanwise symmetry of the flow. The results for each maximum, shown in figure 7(c), are antisymmetric with respect to
 $w_I$. Similarly to
 $u_I$ and
 $v_I$, there is an almost linear relationship between
 $w_I$ and
 $\tau _{x,+}$ in the range
 $0 \leq \tau _{x,+}^* \leq 2$. For
 $+\Delta z_w^{max}$, negative values of
 $w_I$ indicate
 $\tau _{x,+}^*<1$, whereas positive values are linked to
 $\tau _{x,+}^*>1$. The opposite is true for
 $-\Delta z_w^{max}$. Low values of
 $\tau _{x,+}$ are connected to low
 $u_I$, and positive (negative) values of
 $w_I$ for
 $+\Delta z_w^{max}$ (
 $-\Delta z_w^{max}$). This outcome is consistent with the conditional average flow from figure 6, where it was shown that the information transfer between
 $w_I$ and
 $\tau _{x,+}$ is mediated through the bottom part of the roll structure that accompanies high-/low-velocity streaks. The saturation of the influence of
 $w_I$ to intense values of the wall shear stress is again observed for
 $\tau _{x,+}^* \gtrsim 2$.
The information provided by the mappings can be embedded into the instantaneous coherent structures. In figure 3(b), the  $u_I(\boldsymbol {x},t)$ structures are coloured by the local value of
 $\partial {\mathcal {F}}/\partial u_I$. This metric serves as a measure of the uncertainty in the wall shear stress as a function of
 $u_I$. Low values of
 $\partial {\mathcal {F}}/\partial u_I$ are associated with low uncertainty in
 $\tau _{x,+}$. This implies that small changes in
 $u_I$ result in small changes in
 $\tau _{x,+}$. On the other hand, high values of
 $\partial {\mathcal {F}}/\partial u_I$ are associated with high uncertainty in
 $\tau _{x,+}$, such that small variations in
 $u_I$ result in large changes in
 $\tau _{x,+}$. Interestingly, figure 3(b) shows that low-speed streaks – associated with ejections – are connected to low uncertainty values for
 $\tau _x$ along their entire wall-normal extent. On the contrary, the high-speed streaks of
 $u_I$, linked to extreme events, carry increasing uncertainty in
 $\tau _x$ (indicated by the light yellow colour) as they move further away from the wall.
3.2. Reduced-order modelling: reconstruction of the wall shear stress from $u$

We evaluate the predictive capabilities of the informative and residual components of the streamwise velocity fluctuations to reconstruct the wall shear stress in the future. The main aim of this subsection is to illustrate that when  $u$ is used as the input for developing a model, the resulting model exclusively utilises information from
 $u_I$, while
 $u_R$ is disregarded.
Two scenarios are considered. In the first case, we devise a model for the pointwise, temporal forecasting of  $\tau _{x,+}$ using pointwise data of
 $u$. In the second scenario, the spatially two-dimensional wall shear stress is reconstructed using
 $u$ data from a wall-parallel plane located at given distance from the wall.
First, we discuss the pointwise forecasting of  $\tau _{x,+}$ using pointwise data of
 $u$. We aim to predict the future of the wall shear stress at one point at the wall,
 $\tau _{x,+}=\tau _x(x_0,z_0,t+\Delta T)$, where
 $x_0$ and
 $z_0$ are fixed, and the time lag is
 $\Delta T^* = 25$. Three models are considered, using as input
 $u(\boldsymbol {x}_0, t)$,
 $u_I(\boldsymbol {x}_0, t)$ and
 $u_R(\boldsymbol {x}_0, t)$, respectively, where
 $\boldsymbol {x}_0 = [x_0+\Delta x_u^{max}, y_{ref}, z_0]$ and
 $y_{ref}^* \approx 10$. The data are extracted from a simulation with the same set-up and friction Reynolds number as in § 3.1 but in a smaller computational domain (
 ${\rm \pi} h \times 2h \times {\rm \pi}/2h$). Note that all the points
 $[x_0,z_0]$ are statistically equivalent and can be used to train the model.
As a preliminary step to developing the forecasting models, we use a feedforward artificial neural network (ANN) to separate  $u$ into
 $u_I$ and
 $u_R$ without need of
 $\tau _{x,+}$. This step is required to make the models predictive, as in a practical case, the future of
 $\tau _x$ is unknown and cannot be used to obtained the informative and residual components. The model is given by
 \begin{equation} [\tilde{u}_I(\boldsymbol{x}_0, t) , \tilde{u}_R(\boldsymbol{x}_0, t)] = \text{ANN}_{{I,R}}(u(\boldsymbol{x}_0, t),u(\boldsymbol{x}_0, t-\delta t),\ldots, u(\boldsymbol{x}_0, t-p\,\delta t)), \end{equation}
where the tilde in  $\tilde {u}_I$ and
 $\tilde {u}_R$ denotes estimated quantities,
 $\delta t^*=0.5$, and
 $p=1000$ is the number of time lags considered. Multiple time lags are required for predicting
 $\tilde {u}_I$ and
 $\tilde {u}_R$, in the same manner as time series of
 $u$ and
 $\tau _{x,+}$ were used to compute
 $u_I$. The function
 $\text {ANN}_{{I,R}}$ comprises 6 hidden layers with 50 neurons per layer and ReLU activation functions. The approximately 700 000 samples are divided into 80 % for training and 20 % for validation. The Adam algorithm (Kingma & Ba Reference Kingma and Ba2017) is used to find the optimum solution. An example of the approximate decomposition from (3.7) is shown in figure 8.
Example of approximate decomposition of  $u$ into (a) informative
 $\tilde {u}_I$ and (b) residual
 $\tilde {u}_R$ components using the ANN from (3.7) without need of
 $\tau _{x,+}$. Lines correspond to solid black for the actual
 $u_I$ and
 $u_R$, and orange dashed for the predicted values.

The three ANN models trained to forecast  $\tau _{x,+}$ are
 $$\begin{gather} \tilde{\tau}_{x}^I(x_0,z_0,t+\Delta T) = \text{ANN}_I(\tilde{u}_I(\boldsymbol{x}_0, t)), \end{gather}$$
 $$\begin{gather}\tilde{\tau}_{x}^R(x_0,z_0,t+\Delta T) = \text{ANN}_R(\tilde{u}_R(\boldsymbol{x}_0, t)), \end{gather}$$
 $$\begin{gather}\tilde{\tau}_{x}^U(x_0,z_0,t+\Delta T) = \text{ANN}_U(u(\boldsymbol{x}_0, t-\delta t),\ldots, u(\boldsymbol{x}_0, t-p\,\delta t)). \end{gather}$$
Note that (3.8a) and (3.8b) use only one time step of  $\tilde {u}_I$ and
 $\tilde {u}_R$, respectively, while (3.8c) incorporates multiple time lags of
 $u$. This approach is chosen because (3.7) (used to predict
 $\tilde {u}_I$ and
 $\tilde {u}_R$) also depends on multiple time lags of
 $u$. By training (3.8c) using the same time lags as (3.7), the predictions for
 $\tilde {\tau }_{x}^U$ rely on a model that accesses an equivalent amount of information about past states of the flow as do the models for predicting
 $\tilde {\tau }_{x}^I$ and
 $\tilde {\tau }_{x}^R$. This ensures a fair comparison among models.
The forecasting of the wall shear stress by the three models is illustrated in figure 9. The results indicate that the predictions based on  $u$ and
 $\tilde {u}_I$ are comparable, with relative mean squared errors 18 % and 22 %, respectively. The marginally larger error from the model using
 $\tilde {u}_I$ as input arises from inaccuracies within the ANN responsible for decomposing
 $u$ into
 $\tilde {u}_I$ and
 $\tilde {u}_R$. In a perfect scenario, the forecasting errors using either
 $u$ or
 $\tilde {u}_I$ as input would be identical, implying that
 $\tilde {u}_I$ contains all the information in
 $u$ to make predictions. In contrast, the model that utilises the residual component
 $\tilde {u}_R$ fails to accurately predict the wall shear stress (approximately by 100 % error), yielding values that are nearly constant and close to the time average of
 $\tilde {\tau }_{x}$. These findings demonstrate that when
 $u$ is used as input, the model extracts predictive information from
 $\tilde {u}_I$, while
 $\tilde {u}_R$ provides no predictive value.
Temporal reconstruction of the wall shear stress using ANNs in (3.8) trained with (a)  $u$, (b)
 $\tilde {u}_I$, and (c)
 $\tilde {u}_R$ as inputs, respectively. Solid black lines correspond to the actual wall shear stress; dashed orange lines correspond to the ANN reconstruction.

It is important to clarify that we are not advocating for the separation of inputs into informative and residual components as a standard practice for training models. Instead, our goal is to illustrate that the training process of a model implicitly discriminates between these components, supporting our claim that all the necessary information for reduced-order modelling is encapsulated in  $u_I$. An interesting consequence of this property is that the characteristics and structure of
 $u_R$ are not useful for understanding the predictive capabilities of the model; instead, they help to discern which factors are irrelevant. For further discussion on the role of information in predictive modelling, the reader is referred to Lozano-Durán & Arranz (Reference Lozano-Durán and Arranz2022) and Yuan & Lozano-Durán (Reference Yuan and Lozano-Durán2024).
Next, we reconstruct the spatially varying wall shear stress  $\tau _x(x,z,t+\Delta T)$ using
 $u(\boldsymbol {x}_{ref}, t)$, where
 $\boldsymbol {x}_{ref} = [x, y_{ref}, z]$ and
 $y_{ref}^*=10$. The steps followed are analogous to those described above for the time signal prediction. First, we train a model to approximately decompose
 $u(\boldsymbol {x}_{ref}, t)$ into its informative and residual parts without requiring information about
 $\tau _x(x,z,t+\Delta T)$. To that end, we use a temporal convolutional neural network (CNN) (Long, Shelhamer & Darrell Reference Long, Shelhamer and Darrell2015; Guastoni et al. Reference Guastoni, Güemes, Ianiro, Discetti, Schlatter, Azizpour and Vinuesa2021) of the form
 \begin{equation} [\tilde{u}_I(\boldsymbol{x}_{ref},t), \tilde{u}_R(\boldsymbol{x}_{ref},t)] = \text{CNN}_{I,R}( u(\boldsymbol{x}_{ref}, t), u(\boldsymbol{x}_{ref}, t-\delta t),\ldots, u(\boldsymbol{x}_{ref}, t-p\,\delta t) ),\end{equation}
where  $p=500$ and
 $\delta t^*=0.5$. The CNN is designed to process input data shaped as three-dimensional arrays, where dimensions represent spatial coordinates and temporal slices. The CNN comprises an image input layer, followed by three blocks consisting each of a convolutional layer, batch normalisation, and a ReLU activation function. Spatial dimensions are reduced through successive max pooling layers, while feature maps are subsequently upscaled back to original dimensions via transposed convolutional layers with ReLU activations. Further details of the CNN are provided in figure 10. A total of 12 000 snapshots are used, split into training (80 %) and validation (20 %). An example of the approximate decomposition from (3.9) is shown in figure 11.
Schematic of the architecture for the (temporal) CNNs in (3.9) and (3.10). The numbers below the convolution and transpose convolution blocks correspond to the size of the filter and the number of channels applied. For  $\text {CNN}_{{I,R}}$ in (3.9), and
 $\text {CNN}_U$ in (3.10c),
 $N_i = 500$; for
 $\text {CNN}_{I}$ and
 $\text {CNN}_{R}$ from (3.10a) and (3.10b),
 $N_i = 1$.

Example of approximate decomposition of  $u$ into informative
 $\tilde {u}_I$ and residual
 $\tilde {u}_R$ components using the CNN from (3.9) without need of
 $\tau _{x,+}$: (a)
 $u_I$, (b)
 $\tilde {u}_I$, (c)
 $u_R$, and (d)
 $\tilde {u}_R$.

The three models to predict the two-dimensional wall shear stress are
 $$\begin{gather} \tilde{\tau}_{x}^I(x,z,t + \Delta T) = \text{CNN}_I(\tilde{u}_I(\boldsymbol{x}_{ref}, t)), \end{gather}$$
 $$\begin{gather}\tilde{\tau}_{x}^R(x,z,t + \Delta T) = \text{CNN}_R(\tilde{u}_R(\boldsymbol{x}_{ref}, t)), \end{gather}$$
 $$\begin{gather}\tilde{\tau}_{x}^U(x,z,t + \Delta T) = \text{CNN}_U( u(\boldsymbol{x}_{ref}, t), u(\boldsymbol{x}_{ref}, t-\delta t),\ldots,u(\boldsymbol{x}_{ref}, t-p\,\delta t)). \end{gather}$$
Similarly to the previous case, the first two models use only one time step for  $\tilde {u}_I$ and
 $\tilde {u}_R$, respectively, whereas the last model uses multiple time lags for
 $u$ (with
 $p=500$ and
 $\delta t^*=0.5$).
The spatial reconstruction of the wall shear stress by the three models is shown in figure 12 for one instant. Consistently with our previous observations, the reconstructions using  $u$ and
 $\tilde {u}_I$ as inputs to the model are comparable in both structure and magnitude, yielding relative mean squared errors 28 % and 30 %, respectively. Conversely, the CNN that utilises the residual component
 $\tilde {u}_R$ is completely unable to predict the two-dimensional structure of the wall shear stress, yielding average relative error of 120 %. These results further reinforce the idea that models rely on the informative component of the input to predict the output variable, whereas the residual component is of no utility. Finally, it is worth noting that the CNNs used above have access to the two-dimensional spatial structure of
 $u$ and
 $\tau _x$; however, the aIND method, which was originally used to decompose the flow, used only pointwise information. This, along with the inability of
 $\tilde {u}_R$ to predict the wall shear stress, further confirms that the assumptions of the aIND method hold reasonably well in this case.
Example of spatial reconstruction of the instantaneous wall shear stress (a) using CNNs trained with (b)  $u$, (c)
 $\tilde {u}_I$, and (d)
 $\tilde {u}_R$ as inputs, respectively.

3.3. Control: wall shear stress reduction with opposition control
We investigate the application of the IND to opposition control in a turbulent channel flow (Choi, Moin & Kim Reference Choi, Moin and Kim1994; Hammond, Bewley & Moin Reference Hammond, Bewley and Moin1998). Opposition control is a drag reduction technique based on blowing and sucking fluid at the wall with a velocity opposed to the velocity measured at some distance from the wall. The hypothesis under consideration in this subsection is that the informative component of the wall-normal velocity is more impactful for controlling the flow compared to the residual component. The rationale behind this hypothesis is grounded in the information-theoretic formulation of observability introduced by Lozano-Durán & Arranz (Reference Lozano-Durán and Arranz2022). This formulation defines the observability of a variable ( $\tau _{x,+}$) in terms of the knowledge gained from another variable (
 $v$) as
 \begin{equation} O_{v\to\tau_{x,+}} = \frac{I(\tau_{x,+};v)}{H(\tau_{x,+})}. \end{equation}
The variable  $\tau _{x,+}$ is said to be perfectly observable with respect to
 $v$ when
 $O_{v\to \tau _{x,+}} = 1$, i.e. there is no uncertainty in the state to be controlled conditioned to knowing the state of the sensor. Conversely,
 $\tau _{x,+}$ is completely unobservable when
 $O_{u\to \tau _{x,+}} = 0$, i.e. the sensor does not have access to any information about
 $\tau _{x,+}$. The greater the observability, the more information is available for controlling the system. By substituting (2.5) and (2.7) into (3.11), it is easy to show that
 $\tau _{x,+}$ is unobservable with respect to the residual component (
 $O_{v_R\to \tau _{x,+}} = 0$), and perfectly observable from the perspective of the informative component (
 $O_{v_I\to \tau _{x,+}} = 1$).
Figure 13 shows a schematic of the problem set-up for opposition control in a turbulent channel flow. The channel is as in § 3.2, but the wall-normal velocity at the wall is replaced by  $v(x,0,z,t) = f(v(x,y_s,z,t))$, where
 $y_s$ is the distance to the sensing plane, and
 $f$ is a user-defined function. In the original formulation by Choi et al. (Reference Choi, Moin and Kim1994),
 $f \equiv -v(x,y_s,z,t)$, hence the name opposition control. Here, we set
 $y_s^* \approx 14$, which is the optimum wall distance reported in previous works (Chung & Talha Reference Chung and Talha2011; Lozano-Durán & Arranz Reference Lozano-Durán and Arranz2022). Two Reynolds numbers are considered,
 $Re_\tau = 180$ and
 $395$.
Schematic of the opposition control. The contour corresponds to the instantaneous vertical velocity on an  $(x,y)$-plane: the green line depicts the instantaneous velocity at the sensing plane
 $y_s$, and the yellow line depicts the velocity at the wall imposed by the classical opposition control technique. The colour map ranges from blue for
 $v^* = -1.8$ to red for
 $v^* = 1.8$.

We split  $v(x,y_s,z,t)$ into its informative (
 $v_I$) and residual (
 $v_R$) components to
 $\tau _x(x,z,t)$. Three controllers are investigated. In the first case, the function of the controller
 $f$ is such that it uses only the informative component of
 $v(x,y_s,z, t)$, namely
 $f(v(x,y_s,z,t)) \equiv -v_I(x,y_s,z,t)$. In the second case, the controller uses the residual component
 $f(v(x,y_s,z,t)) \equiv -v_R(x,y_s,z,t)$. Finally, the third controller follows the original formulation
 $f(v(x,y_s,z,t)) \equiv -v(x,y_s,z,t)$.
This is a more challenging application of the IND due to the dynamic nature of the control problem. When the flow is actuated, the dynamics of the system changes, and the controller should re-compute  $v_I$ (or
 $v_R$) for the newly actuated flow. This problem is computationally expensive, and we resort to calculating an approximation. The control strategy is implemented as follows.
(i) A simulation is performed with
$f \equiv -v(x,y_s,z,t)$, corresponding to the original version of opposition control.(ii) The informative term (
$v_I$) of $v(x,y_s,z,t)$ related to the wall shear stress $\tau _x(x,z,t)$ is extracted for $\Delta T = 0$.(iii) We find an approximation of the controller, such that
$\tilde {v}_I = f(v) \approx -v_I$. To obtain this approximation, we solve the minimisation problem
(3.12)where\begin{equation} \arg\min_{\tilde{v}_I} \| v_I - \tilde{v}_I \|^2 + \gamma\,\frac{I( \tau_x; \tilde{v}_R)}{H(\tau_x)}, \end{equation}$\gamma = 0.75$. The approximated informative term is modelled as a feedforward ANN with 3 layers and 8 neurons per layer.(iv) Two new simulations are conducted, using either
$\tilde {v}_I$ or $\tilde {v}_R = v - \tilde {v}_I$ for opposition control.


Note that the devised controller can be applied in real time (i.e. during simulation runtime), since the estimated information component  $\tilde {v}_I(t)$ is computed using only information from the present time instant,
 $v(t)$.
Figure 14 summarises the drag reduction for the three scenarios, namely  $f \equiv -v(x,y_s,z,t)$,
 $f \equiv -\tilde {v}_I(x,y_s,z,t)$ and
 $f \equiv -\tilde {v}_R(x,y_s,z,t)$. The original opposition control achieves drag reductions approximately
 $22\,\%$ and
 $24\,\%$ for
 $Re_\tau =180$ and
 $Re_\tau =395$, respectively. Similar reductions in drag using the same controller have been documented in the literature (Chung & Talha Reference Chung and Talha2011; Luhar, Sharma & McKeon Reference Luhar, Sharma and McKeon2014). The values show a marginal dependency on
 $Re_\tau$, in agreement with previous studies (Iwamoto, Suzuki & Kasagi Reference Iwamoto, Suzuki and Kasagi2002). Opposition control based on
 $\tilde {v}_I$ yields a moderate increase in drag reduction with a
 $24\,\%$ and
 $26\,\%$ drop for each
 $Re_\tau$, respectively. Conversely, the drag reduction is only up to
 $7\,\%$ for the control based on the estimated residual velocity,
 $\tilde {v}_R$. Note that
 $v_I$ is the component of
 $v$ with the highest potential to modify the drag. Whether the drag increases or decreases depends on the specifics of the controller. On the other hand, the residual component
 $v_R$ is expected to have a minor impact on the drag. As such, one might anticipate a 0 % drag reduction by using
 $v_R$. However, the approximation
 $\tilde {v}_R$ retains some information from the original velocity for intense values of the latter, which seems to reduce the drag on some occasions. Simulations using
 $f \equiv - k \tilde {v}_R$ – with
 $k$ adjusted to
 $f \sim \| v(x,y_s,z,t) \|^2$ – were also conducted, yielding no additional improvements in the drag reduction beyond 8 %. It is also interesting to note that after performing steps (i)–(iv) of the control strategy, the informative content in
 $v$ increases substantially (from
 $E_I^v \approx 0.1$ to
 $E_I^v \approx 0.8$). This phenomenon exposes the dynamic nature of the control problem highlighted above.
Drag reduction, computed as  $1-u_{\tau,c}^2/u_{\tau }^2$, where
 $u_{\tau,c}$ is the friction velocity for the controlled case. Each colour corresponds to a different controller: black for
 $f \equiv -v$, blue for
 $f \equiv -\tilde {v}_I$, and orange for
 $f \equiv -\tilde {v}_R$.

Figures 15(a,c) show the wall-normal velocity in the sensing plane for the controlled cases at  $Re_\tau = 180$ with
 $f \equiv -\tilde {v}_I$ and
 $f \equiv -\tilde {v}_R$, respectively. Larger velocity amplitudes are observed in figure 15(c) compared to figure 15(a), indicating that higher Reynolds stresses are expected, which aligns with a larger average wall shear stress. On the other hand, figures 15(b,d) display the negative wall-normal velocity imposed at the boundary for the cases with
 $f \equiv -\tilde {v}_I$ and
 $f \equiv -\tilde {v}_R$, respectively. The informative component
 $\tilde {v}_I$ closely resembles the original velocity but with smaller amplitudes at extreme events of
 $v$. This appears to play a slightly beneficial role in drag reduction. Conversely, figure 15(d) shows that the estimated residual component is negligible except for large values of
 $v$. This is responsible for the smaller reduction in the mean drag. Although not shown, similar flow structures are observed for
 $Re_\tau = 395$, and the same discussion applies. In summary, we have utilised an example of opposition control in a turbulent channel to demonstrate the utility of IND. However, it is important to emphasise that the primary focus of this section is not on the real-time applicability or the performance of the control in this specific case. Instead, the main message that we aim to convey is more fundamental: the informative component of the variable measured by the sensor holds the essential information needed to develop successful control strategies, while the residual component is not useful in this regard.
(a) Wall-normal velocity in the sensing plane,  $v(x,y_s,z)$ and (b) the minus velocity imposed at the wall for the case
 $f\equiv -\tilde {v}_I$. (c,d) Same as (a,b), but for the case
 $f\equiv -\tilde {v}_R$. Contours range from blue for
 $v^* = -0.9$ to red for
 $v^* = 0.9$.

4. Conclusions
We have presented informative and non-informative decomposition (IND), a method for decomposing a flow field into its informative and residual components relative to a target field. The informative field contains all the information necessary to explain the target variable, contrasting with the residual component, which holds no relevance to the target variable. The decomposition of the source field is formulated as an optimisation problem based on mutual information. To alleviate the computational cost and data requirements of IND, we have introduced an approximate solution, referred to as aIND. This approach still ensures that the informative component retains the information about the target, by minimising the mutual information between the residual and the target in a pointwise manner.
The IND is grounded in the fundamental principles of information theory, offering key advantages over other methods. As such, it is invariant under shifting, rescaling, and, in general, nonlinear  ${\mathcal {C}}^1$-diffeomorphism transformations of the source and target variables (Kaiser & Schreiber Reference Kaiser and Schreiber2002). The method is also fully nonlinear, and does not rely on simplifications such as the Gaussianity of the variables. This makes IND a suitable tool for studying turbulent phenomena, which are intrinsically nonlinear. In contrast, other linear correlation-based methods, such as LSE and EPOD, are not well equipped to capture nonlinearities in the flows. Additionally, we have shown that the pointwise formulation of the method (aIND) represents a cost-effective and memory-efficient implementation of IND without sacrificing performance compared to correlation-based methods. This approach also allows for the assimilation of experimental data.
The method has been applied to study the information content of the velocity fluctuations in relation to the wall shear stress in a turbulent channel flow at  $Re_\tau = 180$. Our findings have revealed that streamwise fluctuations contain more information about the future wall shear stress than the cross-flow velocities. The energy of the informative streamwise velocity peaks at
 $y^* \approx 10$, slightly below the well-known peak for total velocity, while the residual component peaks at
 $y^* \approx 30$. This suggests that the peak observed in the total velocity fluctuations results from both active and inactive velocities, with ‘active’ referring to motions connected to changes in the wall shear stress. Further investigation of the coherent structure of the flow showed that the informative velocity consists of smaller near-wall high- and low-velocity streaks collocated with vertical motions (i.e. sweeps and ejections). The spanwise informative velocity is weak, except close to the wall within the bottom root of the streamwise rolls. This informative streak–roll structure is embedded within a larger-scale streak–roll structure from the residual velocity, which bears no information about the wall shear stress for the considered time scale. We have also shown that ejections propagate information about the wall stress further from the wall than sweeps, while extreme values of the wall shear stress are attributed to sweeps in close proximity to the wall.
The utility of IND for reduced-order modelling was demonstrated in the prediction of the wall shear stress in a turbulent channel flow. The objective was to estimate the two-dimensional wall shear stress in the future, after  $\Delta T^*=25$, by measuring the streamwise velocity in a wall-parallel plane at
 $y^* \approx 10$ as input. The approach was implemented using a fully convolutional neural network as the predictor. Two cases were considered, using either the informative or the residual velocity component as input, respectively. The main discrepancies were localised in regions with high wall shear stress values. This outcome aligns with our prior analysis, which indicated that extreme wall shear stress events are produced by short-time near-wall sweeps not captured in the input plane. In contrast, the residual velocity component offers no predictive power for wall shear stress, as it has no observability of the wall shear stress, meaning that it lacks any information relevant to the latter. This example in reduced-order modelling reveals that models achieving the highest performance are those that utilise input variables with the maximum amount of information about the output.
Finally, we have investigated the application of IND for drag reduction in turbulent channel flows at  $Re_\tau = 180$ and
 $395$. The strategy implemented involved blowing/suction via opposition control. To this end, the no-transpiration boundary condition at the wall was replaced with the wall-normal velocity measured in the wall-parallel plane at
 $y^*=14$. We explored the use of three wall-normal velocities: the total velocity (i.e. as originally formulated in opposition control), its informative component, and its residual component. The largest reduction in drag was achieved using the informative component of
 $v$, which performed slightly better than the total velocity for both Reynolds numbers. The residual component was shown to yield the poorest results. The application to drag reduction demonstrated here illustrates that the informative component of
 $v$ contains the essential information needed for effective flow control. This paves the way for using IND to devise enhanced control strategies by isolating the relevant information from the input variables while disregarding the irrelevant contributions.
We conclude this work by highlighting the potential of IND as a post-processing tool for gaining physical insight into the interactions among variables in turbulent flows. Nonetheless, it is also worth noting that the approach relies on the mutual information between variables, which requires estimating joint probability density functions. This entails a data-intensive process that could become a constraint in cases where the amount of numerical or experimental data available is limited. Future efforts will be devoted to reducing the data requirements of aIND and extending its capabilities to account for multi-variable and multi-scale interactions among variables.
Acknowledgements
The authors acknowledge the Massachusetts Institute of Technology, SuperCloud, and Lincoln Laboratory Supercomputing Center for providing HPC resources that have contributed to the research results reported here. The schematics of the CNNs have been created using PlotNeuralNet.
Funding
This work was supported by the National Science Foundation under grant no. 2140775 and MISTI Global Seed Funds and UPM. G.A. was partially supported by the NNSA Predictive Science Academic Alliance Program (PSAAP, grant DE-NA0003993).
Declaration of interests
The authors report no conflict of interest.
Data availability
The code and examples of aIND are openly available at https://github.com/Computational-Turbulence-Group/aIND.
Appendix A. Numerical implementation
A.1. Solution for scalar variables using bijective functions
Here, we provide the methodology to tackle the minimisation problem posed in (2.10). For convenience, we write (2.10) again:
 \begin{equation} \arg \min_{\varPhi_{I},{\mathcal{F}}} I(\varPhi_{R};\varPhi_{I}) + \gamma\| \varPhi - \varPhi_{I} \|^2,\quad \mathrm{s.t.}\ \varPsi_+ = {\mathcal{F}}(\varPhi_{I}). \end{equation}
To solve (A1), we note that there are two unknowns:  $\varPhi _{I}$ and the function
 ${\mathcal {F}}$. If we assume that
 ${\mathcal {F}}$ is invertible, namely
 \begin{equation} \varPhi_{I}(t) = {\mathcal{F}}^{{-}1}(\varPsi_+ (t)) \equiv {\mathcal{B}}(\varPsi_+ (t)), \end{equation}
then (A1) can be recast as
 \begin{equation} \arg \min_{{\mathcal{B}}} \ I( \varPhi-{\mathcal{B}}(q_+);{\mathcal{B}}(q_+) ) + \gamma\,\| \varPhi - {\mathcal{B}}(\varPsi_+) \|^2, \end{equation}
which can be solved by standard optimisation techniques upon the parametrisation of the function  ${\mathcal {B}}$.
However, by imposing bijectivity, we constrain the feasible  $\varPhi _{I}(t)$ solutions that satisfy
 $H(\varPsi _+\, |\, \varPhi _{I}) = 0$ and could lead to lower values of the loss function than in the more lenient case, where
 ${\mathcal {F}}$ needs only to be surjective. To circumvent this limitation, we recall that a surjective function with
 $N-1$ local extrema points (points where the slope changes sign) can be split into
 $N$ bijective functions (see figure 16a). In particular, we define
 \begin{equation} \varPhi_{I}(t) = {\mathcal{B}}_i(\varPsi_+(t))\ {\rm s.t.}\ \varPhi(t) \in [ r_{i-1}, r_i), \end{equation}
where  $r_i$ is the
 $i$th local extremum, such that
 $r_i > r_{i-1}$,
 $r_0 \rightarrow -\infty$ and
 $r_N \rightarrow \infty$.
(a) Illustration of a surjective function  ${\mathcal {F}}(\varPhi _{I})$ and its decomposition into two bijective functions,
 ${\mathcal {B}}_1(\varPsi _+)$ and
 ${\mathcal {B}}_2(\varPsi _+)$. (b) Example of a DSF architecture with 2 hidden layers and 4 neurons per hidden layer. The functions plotted within boxes are the activation functions acting on the neurons. Adapted from Huang et al. (Reference Huang, Krueger, Lacoste and Courville2018).

Therefore, the final form of the minimisation equation is
 \begin{equation} \arg \min_{{\mathcal{B}}_{i}} \ I(\varPhi-{\mathcal{B}}^{{\cup}}(\varPsi_+);{\mathcal{B}}^{{\cup}}(\varPsi_+)) + \gamma \sum_i^N \| \varPhi - {\mathcal{B}}_i^0(\varPsi_+;\varPhi) \|^2, \end{equation}
with
 \begin{equation} {\mathcal{B}}_i^0(\varPsi_+;\varPhi) = \begin{cases} {\mathcal{B}}_i & \text{if}\ \varPhi(t) \in [r_{i-1}, r_i ), \\ 0 & \text{otherwise}, \end{cases} \quad {\mathcal{B}}^\cup(\varPsi_+) = \sum_i^N {\mathcal{B}}_i^0(\varPsi_+;\varPhi), \end{equation}
where the extrema ( $r_i$) are unknowns to be determined in the minimisation problem, and
 $\gamma$ and
 $N$ are the only free parameters. Once the functions
 ${\mathcal {B}}_i$ are computed, the informative component is obtained from
 \begin{equation} {\varPhi}_I(t) = {{\mathcal{B}}}_j(\varPsi_+(t))\ {\rm s.t.}\ j = \arg \min_{i} \ ( \varPhi(t) - {\mathcal{B}}_i(\varPsi_+(t)) )^2 \end{equation}
at every time step.
We use feedforward networks to find  ${\mathcal {B}}_i$, as they are able to approximate any Borel-measurable function on a compact domain (Hornik, Stinchcombe & White Reference Hornik, Stinchcombe and White1989). In particular, we use the deep sigmoidal flow (DSF) proposed by Huang et al. (Reference Huang, Krueger, Lacoste and Courville2018), who proved that a feedforward ANN is a bijective transformation if the activation functions are bijective and all the weights are positive. The details of the DSF architecture and the optimisation can be found in § A.2.
One must emphasise that the current minimisation problem posed in (2.10) differs from the classical flow reconstruction problem (e.g. Erichson et al. Reference Erichson, Mathelin, Yao, Brunton, Mahoney and Kutz2020) where the maximum reconstruction of  $\varPhi$ is sought. In those cases, we look for a function
 ${\mathcal {G}}(\varPsi _+)$ that minimises
 $\| \varPhi - {\mathcal {G}}(\varPsi _+)\|^2$. If the result is a non-bijective function, then the constraint
 $H( \varPsi _+\, |\, \varPhi _{I} ) = 0$ will not be satisfied.
A.2. Networks architecture and optimisation details
The present algorithm uses DSF networks to approximate bijective functions. This network architecture is depicted in figure 16(b). The DSF is composed of  $L$ stacked sigmoidal transformations. Each transformation produces the output,
 \begin{equation} x_l = \sigma^{{-}1} ( w_l^T \times \sigma ( a_l \times x_{l-1} + b_l) ), \quad l = 1,\ldots,L, \end{equation}
where  $x_{l-1}$ is the input,
 $\sigma (y) = 1/(1 + {\rm e}^{-y})$ is the logistic function,
 $\sigma ^{-1}$ is the inverse of
 $\sigma$,
 ${a}_l$ and
 ${b}_l$ are vectors with the weights and biases of the decoder part of the
 $l$-layer, and
 $w_l$ is a vector with the weights of the encoder part of the
 $l$-layer (see figure 16b). In addition, the weights for each layer have to fulfil
 $0 < w_{l,i} < 1$,
 $\sum _i w_{l,i} = 1$ and
 $a_{l,i} > 0$,
 $i = 1,\ldots,M$, where
 $M$ is the number of neurons per layer. These constraints are enforced via the softmax and exponential activation functions for
 $w_l$ and
 $a_l$, respectively, namely
 \begin{equation} w_{l,i} = \frac{\exp({w^\prime_{l,i}})}{\displaystyle\sum_{i=1}^N \exp({w^\prime_{l,i}})}, \quad a_{l,i} = \exp({a^\prime_{l,i}}). \end{equation}
More details on the DSF architecture can be found in Huang et al. (Reference Huang, Krueger, Lacoste and Courville2018).
To compute the optimal weights and biases that yield the optimal  ${\mathcal {B}}_i$ that minimise (A5), we use the Adam algorithm (Kingma & Ba Reference Kingma and Ba2017). This minimisation process requires all operations to be continuous and differentiable. To achieve that, we compute the mutual information using a kernel density estimator, and the piecewise-defined functions
 ${\mathcal {B}}_i^0$ are made
 ${\mathcal {C}}^1$ continuous by applying the logistic function
 \begin{equation} {\mathcal{B}}_i^0(\varPsi_+;\varPhi) = {\mathcal{B}}_i(\varPsi_+)\,\sigma( k ( \varPhi - \tilde{r}_{i-1} ) )\, \sigma ( k (\tilde{r}_i - \varPhi ) ), \end{equation}
where the parameter  $k>0$ can be chosen to control the steepness of the function, and
 $\tilde {r}_{j} = r_j \pm \log ( p / (p-1) ) / k$, which ensures
 ${\mathcal {B}}_i^0 = p {\mathcal {B}}_i$ at the boundaries.
In the present study, the first term in (2.10) is normalised with  $\| \varPhi \|^2$, and the second term is normalised with
 $H(\varPhi _I, \varPhi _R)/2$. Under this normalisation, free parameters
 $p=0.99$ and
 $k=500$ were determined to be adequate for the optimisation process. The number of bijective functions
 $N$ was selected to minimise (A5) while producing a continuous mapping, as illustrated in figures 2 and 16(a). In the study presented in § 3, an
 $N$ value of 1 was found to be optimal. We also explored different values for the regularisation constant
 $\gamma$. For
 $N = 1$, similar mappings were achieved for
 $0.5 \geq \gamma \geq 2$, and the results discussed in § 3 were calculated with
 $\gamma = 1$. In cases with
 $N \geq 1$, starting with a high
 $\gamma$ value, approximately
 $10$, during initial iterations proved beneficial for converging the solution. Subsequently,
 $\gamma$ was gradually decreased to emphasise the minimisation of the first term in (A5). Currently, this adjustment is performed manually, but future developments in aIND could automate this process (Groenendijk et al. Reference Groenendijk, Karaoglu, Gevers and Mensink2021). Finally, the DSF architecture was set to 3 layers with 12 neurons per layer.
Appendix B. Validation of aIND and comparison with EPOD and LSE
We include two additional validation cases of aIND applied to two-dimensional fields in a plane  $\boldsymbol {x} = (x,z)$. These synthetic examples have an exact analytic solution that enables us to quantify the error produced by the different methods. We consider the system
 \begin{align} \text{source}\quad &\varPhi(\boldsymbol{x},t) = \varPhi_I(\boldsymbol{x},t) + \varPhi_R(\boldsymbol{x},t), \end{align}
 \begin{align} \text{target}\quad &\varPsi_+(\boldsymbol{x},t) = F(\varPhi_I(\boldsymbol{x},t)), \end{align}
where the fields  ${\varPhi }_I$ and
 ${\varPhi }_R$ and the function
 $F$ are given. In particular,
 ${\varPhi }_I$ and
 ${\varPhi }_R$ are the velocity fluctuations in the planes
 $y^* \approx 5$ and
 $40$, respectively, of a turbulent channel flow with
 ${Re}_\tau = 180$ in a domain
 $8{\rm \pi}{h} \times 2{h} \times 4{\rm \pi}{h}$ in the streamwise, wall-normal and spanwise directions, respectively. Instantaneous snapshots of the fields are shown in figure 17. To ensure that the fields are independent (i.e.
 $I({\varPhi }_I, {\varPhi }_R) = 0$), the informative field is extracted at
 $y^* \approx 5$ from the bottom wall, whereas the residual field is extracted at
 $y^* \approx 40$ from the top wall at a shifted time step.
Instantaneous velocities used to create synthetic examples: (a) informative field and (b) residual field. The velocities are extracted from direct numerical simulations of a turbulent channel flow at  ${Re}_\tau = 180$ at
 $y^+ \approx 5$ and
 $40$, respectively.

We compare aIND with the extended POD method (EPOD) proposed by Borée (Reference Borée2003) and the spectral in space version of the LSE presented by Encinar & Jiménez (Reference Encinar and Jiménez2019). In the following subsections, we provide a small overview of each method.
B.1. Extended POD
The EPOD offers a linear decomposition of a source field  $\varPhi (\boldsymbol {x},t)$ into its correlated (
 $C$) and decorrelated (
 $D$) contributions to a given target field such that
 $$\begin{gather} \varPhi_C(\boldsymbol{x},t) = \sum_n a^n_\varPsi (t)\,U^n_\varPhi(\boldsymbol{x}), \end{gather}$$
 $$\begin{gather}\varPhi_D(\boldsymbol{x},t) = \varPhi(\boldsymbol{x},t) - \varPhi_C(\boldsymbol{x},t), \end{gather}$$
where  $n$ is the number of modes, and
 $a^n_\varPsi$ is the temporal coefficient of the
 $n$th POD mode of the target field
 $\varPsi _+$ and
 $U^n_\varPhi$ in the
 $n$th spatial mode. The latter is computed as
 \begin{equation}
U_\varPhi^n(\boldsymbol{x}) = \frac{\langle a^n_\varPsi\,\varPhi(\boldsymbol{x},t)\rangle_t}{\langle
a^n_\varPsi a^n_\varPsi \rangle},
\end{equation}
where  $\langle \cdot \rangle_t$ denotes temporal average. The EPOD decomposition has the following properties (Borée Reference Borée2003).
(i) The correlation between the original source field and the target field is the same as the correlation between the correlated field and the target field, namely
(B6)\begin{equation} \langle \varPhi \varPsi \rangle = \langle \varPhi_C \varPsi \rangle. \end{equation}(ii) The decorrelated field is uncorrelated with the target field, i.e.
(B7)\begin{equation} \langle \varPhi_D \varPsi \rangle = 0. \end{equation}


Therefore, we define the EPOD informative component as the correlated field ( $\varPhi _I^{EPOD} \equiv \varPhi _C$) and the EPOD residual component as the decorrelated field (
 $\varPhi _R^{EPOD} \equiv \varPhi _D$). In the following examples, the POD of the target field is obtained using 300 snapshots and the informative field is reconstructed using the 50 more energetic modes.
B.2. Spectral LSE
The LSE, proposed by Adrian & Moin (Reference Adrian and Moin1988), provides the best mean square linear estimate of the ‘response’ field  $\varPhi (\boldsymbol {x},t)$ given the ‘predictor’
 $\varPsi _+(\boldsymbol {x},t)$ (Tinney et al. Reference Tinney, Coiffet, Delville, Hall, Jordan and Glauser2006). Considering a collection of discrete spatial locations
 $\boldsymbol {x}_i$, the best linear estimate that minimises
 \begin{equation} \arg \min_{\tilde{\varPhi}} \langle (\varPhi(\boldsymbol{x}_i,t) - \tilde{\varPhi}(\boldsymbol{x}_i,t))^2\rangle_t \end{equation}
is given by
 \begin{equation} \tilde{\varPhi}(\boldsymbol{x}_i, t) = L_{ij}\,\varPsi_+(\boldsymbol{x}_j,t), \end{equation}
where repeated indices imply summation. The entries of the matrix  $L$ take the form (Adrian & Moin Reference Adrian and Moin1988)
 \begin{equation} L_{ij}(\boldsymbol{x}_m) = \frac{ \langle \varPhi(\boldsymbol{x}_i,t)\,\varPsi(\boldsymbol{x}_m,t) \rangle_t } {\langle \varPsi(\boldsymbol{x}_j,t)\,\varPsi(\boldsymbol{x}_m,t) \rangle_t}. \end{equation}
From (B8), we define the LSE informative and residual components as  $\varPhi _I^{LSE}(\boldsymbol {x},t) \equiv \tilde {\varPhi }(\boldsymbol {x},t)$ and
 $\varPhi _R^{LSE}(\boldsymbol {x},t) \equiv \varPhi - \tilde {\varPhi }(\boldsymbol {x},t)$, respectively.
In the following examples, we exploit the spatial periodicity of the flow field. To that end, we adopt the approach by Encinar & Jiménez (Reference Encinar and Jiménez2019) and use a spatial Fourier basis to project the fields. This procedure is usually known as spectral linear stochastic estimation (SLSE). Equation (B10) becomes
 \begin{equation} \hat{L}(k_x, k_z) = \frac{\langle \hat{\varPsi}(k_x, k_z,t)\,\hat{\varPhi}^{\dagger}(k_x, k_z,t) \rangle_t}{\langle \hat{\varPhi}(k_x, k_z,t)\,\hat{\varPhi}^*(k_x, k_z,t)\rangle_t }, \end{equation}
where  $\widehat {(\cdot )}$ denotes the Fourier transform,
 $(\cdot )^{\dagger}$ is the complex conjugate, and
 $k_x$,
 $k_z$ are the wavenumbers in the
 $x,z$ directions, respectively. It can be shown (see Tinney et al. Reference Tinney, Coiffet, Delville, Hall, Jordan and Glauser2006; Encinar & Jiménez Reference Encinar and Jiménez2019) that the optimal estimator is
 \begin{equation} {\varPhi}_I(\boldsymbol{x}_i,t) = \sum_{j} L(x_i - x_j, z_i - z_j)\,\varPsi(x_j,z_j,t). \end{equation}
B.3. Linear mapping
As a first validation case, we consider a linear mapping function
 \begin{align} \text{source}\quad &\varPhi(\boldsymbol{x},t) = \varPhi_I(\boldsymbol{x},t) + \varPhi_R(\boldsymbol{x},t), \end{align}
 \begin{align} \text{target}\quad &\varPsi_+(\boldsymbol{x},t) = \varPhi_I(\boldsymbol{x},t). \end{align}
The exact informative and residual fields are normalised such that their standard deviations are  $\langle \varPhi _I \varPhi _I \rangle = 1$ and
 $\langle \varPhi _R \varPhi _R \rangle = 1$, respectively. The instantaneous reconstructed fields are displayed in figure 18. To ease the comparison, the time instant is the same as in figure 17.
Instantaneous reconstructed fields of the informative and residual components for (B13) with (a,b,c) aIND, (d,e, f) SLSE, and (g,h,i) EPOD: (a,d,g) the reconstructed informative field, (b,e,h) the reconstructed residual field, and (c, f,i) the error between the exact and reconstructed informative fields. The colourmap for the errors range between  $\pm 0.5\langle \varPhi_i \varPhi_I \rangle$.

We can observe that aIND accurately reconstructs the informative and residual fields. The SLSE is also able to reconstruct the mapping, which is expected since the mapping is linear. On the contrary, EPOD fails to obtain the correct informative/residual field despite the linear character of the decomposition. Instead, it tends to reconstruct the original field  $\varPhi$.
B.4. Nonlinear mapping
As a second validation case, we consider the nonlinear mapping function
 \begin{align} \text{source}\quad &\varPhi(\boldsymbol{x},t) = \varPhi_I(\boldsymbol{x},t) + \varPhi_R(\boldsymbol{x},t), \end{align}
 \begin{align} \text{target}\quad &\varPsi_+(\boldsymbol{x},t) = \varPhi_I^2(\boldsymbol{x},t) - 0.2\,\varPhi_I(\boldsymbol{x},t). \end{align}
The exact informative and residual fields are normalised such that their standard deviations are  $\langle \varPhi _I \varPhi _I \rangle = 1$ and
 $\langle \varPhi _R \varPhi _R \rangle = 0.2$, respectively. The instantaneous reconstructed fields are displayed in figure 19 at the same time instant as in figure 17.
Instantaneous reconstructed fields of the informative and residual components for (B14) with (a,b,c) aIND, (d,e, f) SLSE, and (g,h,i) EPOD: (a,d,g) the reconstructed informative field, (b,e,h) the reconstructed residual field, and (c, f,i) the error between the exact and the reconstructed informative field. The colourmap for the errors range between  $\pm 0.4\langle \varPhi_i \varPhi_I \rangle$.

In this case, SLSE fails to correctly split the flow into the informative and residual fields. The same applies to EPOD: although the reconstruction of the informative resembles the original (due to higher correlation between the original and the informative terms from (B14a)), the error  $\varPhi _I - \varPhi _I^{EPOD}$ is significant everywhere. A similar error is observed for the residual field, which is not correctly identified by EPOD. The aIND, similar to the previous example, accurately reconstructs the informative and residual fields. The small discrepancies in
 $\varPhi _I - \varPhi _I^{IND}$ occur at the locations where
 $\varPhi _I \approx 0$, and stem from the approach followed to compute
 $\varPhi _I^{IND}$. Note that aIND accurately reconstructs the analytical mapping as shown in figure 20.

Appendix C. Analytical solution for Gaussian distributions
For the special case in which all the components in  $\boldsymbol {\varPhi }_{I}, \boldsymbol {\varPsi }_+$ are jointly normal distributed variables, we can write their mutual information as (Cover & Thomas Reference Cover and Thomas2006)
 \begin{equation} I(\boldsymbol{\varPsi}_+; \boldsymbol{\varPhi}_{I}) = \frac{1}{2} \log \left( \frac{|\varSigma(\boldsymbol{\varPhi}_{I})|\,|\varSigma(\boldsymbol{\varPsi}_+)|}{|\varSigma(\boldsymbol{\varPsi}_+{\oplus} \boldsymbol{\varPhi}_{I})|} \right). \end{equation}
In (C1),  $|\cdot|$ denotes the matrix determinant,
 $\varSigma (\boldsymbol {\varPhi }_{I})$ is the covariance matrix of
 $\boldsymbol {\varPhi }_{I}$ (and similarly for
 $\boldsymbol {\varPsi }_+$), a square matrix whose
 $i,j$ entry is defined as
 \begin{equation} \varSigma(\boldsymbol{\varPhi}_{I})[i,j] = \langle \varPhi_{I,i}(t)\,\varPhi_{I,j}(t) \rangle_t, \end{equation}
where  $\varPhi _{I,i}$ is the
 $i$th element of
 $\boldsymbol {\varPhi }_{I}$. The covariance matrix
 $\varSigma (\boldsymbol {\varPsi }_+ \oplus \boldsymbol {\varPhi }_{I})$ can be written in block matrix form as
 \begin{equation} \varSigma(\boldsymbol{\varPsi}_+{\oplus} \boldsymbol{\varPhi}_{I}) = \begin{bmatrix} \varSigma(\boldsymbol{\varPsi}_+) & \varSigma( \boldsymbol{\varPsi}_+ , \boldsymbol{\varPhi}_{I}) \\ \varSigma(\boldsymbol{\varPsi}_+ , \boldsymbol{\varPhi}_{I})^{\rm T} & \varSigma(\boldsymbol{\varPhi}_{I}) \end{bmatrix}, \end{equation}
where  $\varSigma (\boldsymbol {\varPsi }_+ , \boldsymbol {\varPhi }_{I})$ is the cross-covariance matrix
 \begin{equation} \varSigma(\boldsymbol{\varPsi}_+ , \boldsymbol{\varPhi}_{I})[i,j] = \langle \varPsi_{+,i}(t)\,\varPhi_{I,j}(t) \rangle_t. \end{equation}
The mutual information in (C1) is maximised when  $|\varSigma (\boldsymbol {\varPsi }_+ \oplus \boldsymbol {\varPhi }_{I})| = 0$, provided that
 $|\varSigma (\boldsymbol {\varPhi }_{I})| \neq 0$. Using the block determinant identity (Johnson & Horn Reference Johnson and Horn1985; Barnett, Barrett & Seth Reference Barnett, Barrett and Seth2009) gives
 \begin{align} |\varSigma(\boldsymbol{\varPsi}_+{\oplus} \boldsymbol{\varPhi}_{I})| &= |\varSigma(\boldsymbol{\varPsi}_+)|\,| \varSigma(\boldsymbol{\varPhi}_{I}) - \varSigma(\boldsymbol{\varPsi}_+ , \boldsymbol{\varPhi}_{I})\,\varSigma(\boldsymbol{\varPsi}_+)^{{-}1}\,\varSigma(\boldsymbol{\varPsi}_+ , \boldsymbol{\varPhi}_{I})^{\rm T} | \end{align}
 \begin{align} &=|\varSigma(\boldsymbol{\varPhi}_{I}+)|\,| \varSigma(\boldsymbol{\varPsi}_+) - \varSigma(\boldsymbol{\varPsi}_+ , \boldsymbol{\varPhi}_{I})^{\rm T}\,\varSigma(\boldsymbol{\varPhi}_{I})^{{-}1}\,\varSigma(\boldsymbol{\varPsi}_+ , \boldsymbol{\varPhi}_{I})|. \end{align}
The second term in (C5a) (resp. (C5b)) is the residual of a linear regression of  $\boldsymbol {\varPsi }_+$ on
 $\boldsymbol {\varPhi }_{I}$ (resp.
 $\boldsymbol {\varPhi }_{I}$ on
 $\boldsymbol {\varPsi }_+$) (Barnett et al. Reference Barnett, Barrett and Seth2009). Therefore, the mutual information in (C1) is maximised when
 $\boldsymbol {\varPhi }_{I}$ is a linear function of
 $\boldsymbol {\varPsi }_+$, or vice versa. However, only when
 $\boldsymbol {\varPsi }_+$ is a function of
 $\boldsymbol {\varPhi }_{I}$,
 $H( \boldsymbol {\varPsi }_+ | \boldsymbol {\varPhi }_{I} ) = 0$, as required by (2.5).
We assume that the number  $N_\varPhi$ of elements in
 $\boldsymbol {\varPhi }$ is larger than the number
 $N_\varPsi$ of elements of
 $\boldsymbol {\varPsi }_+$, so that if we find
 \begin{equation} \boldsymbol{\varPhi}_{I} = \boldsymbol{\mathsf{L}} \boldsymbol{\varPsi}_+, \end{equation}
then we can find the inverse mapping
 \begin{equation} \boldsymbol{\varPsi}_+ = \boldsymbol{\mathsf{L}}^{{-}1} \boldsymbol{\varPhi}_{I}. \end{equation}
The mutual information in (2.7) can be expanded as
 \begin{equation} I(\boldsymbol{\varPsi}_+; \boldsymbol{\varPhi}_{R}) = \frac{1}{2} \log \left( \frac{|\varSigma(\boldsymbol{\varPhi}_{R})|\,|\varSigma(\boldsymbol{\varPsi}_+)|}{|\varSigma(\boldsymbol{\varPsi}_+{\oplus} \boldsymbol{\varPhi}_{R})|}\right), \end{equation}
which will be equal to zero for  $|\varSigma (\boldsymbol {\varPsi }_+ \oplus \boldsymbol {\varPhi }_{R})| = |\varSigma (\boldsymbol {\varPsi }_+)|\,|\varSigma (\boldsymbol {\varPhi }_{R})|$. From the block determinant identity, this requires
 \begin{equation} | \varSigma(\boldsymbol{\varPsi}_+ , \boldsymbol{\varPhi}_{R})\,\varSigma(\boldsymbol{\varPsi}_+)^{{-}1}\,\varSigma(\boldsymbol{\varPsi}_+ , \boldsymbol{\varPhi}_{R})^{\rm T} | = 0. \end{equation}
In a general scenario, this requires
 \begin{equation} \varSigma(\boldsymbol{\varPsi}_+ , \boldsymbol{\varPhi}_{R})[i,j] = 0, \end{equation}
namely
 \begin{equation} \langle \varPsi_{+,i} (\varPhi_j - \boldsymbol{\mathsf{L}}[j,m]\,\varPsi_{+,m}) \rangle_t \equiv \langle \varPsi_{+,i} \varPhi_j \rangle_t - \langle \varPsi_{+,i}\,\boldsymbol{\mathsf{L}}[j,m]\,\varPsi_{+,m} \rangle_t = 0, \end{equation}
where  $\varPsi_{+,k}$ is the kth element of
 $\boldsymbol{\varPsi}_+$ and repeated indices imply summation. The solution to (C11) is given by Adrian & Moin (Reference Adrian and Moin1988), and it correspond to the LSE:
 \begin{equation} \boldsymbol{\mathsf{L}}[j,m] = \frac{\langle \varPsi_{+,i}\varPhi_j \rangle_t} {\langle \varPsi_{+,j} \varPsi_{+,m} \rangle_t }. \end{equation}
Therefore, for the special case in which all variables involved are jointly normal distributed variables, the solution to IND is LSE. From the previous results, it is straightforward to prove that the solution to aIND when  $\varPhi, \varPsi _+$ are jointly distributed is given by
 \begin{equation} \varPhi_{I}(t) = \frac{\langle \varPsi_+ \varPhi \rangle_t}{\langle \varPsi_+ \varPsi_+ \rangle_t }\,\varPsi_+(t). \end{equation}
We conclude by emphasising that the similarity between IND and higher-order versions of LSE does not extend to the most likely case where all the variables are not jointly normal distributed. In this scenario, higher-order versions of LSE attempt to obtain a better reconstruction of  $\boldsymbol {\varPhi }$ using
 $\boldsymbol {\varPsi }_+$, which will not fulfil the condition
 $H(\boldsymbol {\varPsi }_+| \boldsymbol {\varPhi }_{I}) = 0$, as discussed in the last paragraph of § A.1.
Appendix D. Computation of $\Delta \boldsymbol {x}^{max}$ for the turbulent channel flow

The aIND requires the value of  $\Delta \boldsymbol {x}_\square ^{max} = (\Delta x_{\square }^{max}, \Delta z_{\square }^{max})$ for each informative component
 $\square = u$,
 $v$ and
 $w$. To that end, we calculate their relative energies as functions of
 $\Delta x$,
 $\Delta z$ and the wall-normal distance:
 \begin{equation} E_I^u(\Delta x,\Delta z, y) = \frac{\|u_I^2\|}{\|u^2\|}, \quad E_I^v(\Delta x,\Delta z, y) = \frac{\|v_I^2\|}{\|v^2\|}, \quad E_I^w(\Delta x,\Delta z, y) = \frac{\|w_I^2\|}{\|w^2\|}. \end{equation}
The parametric sweep is performed using data for a channel flow at  $Re = 180$ in a computational domain of size
 ${\rm \pi} h \times 2h \times {\rm \pi}/2h$ in the streamwise, wall-normal and spanwise directions, respectively.
Figure 21 displays  $E_I^u$,
 $E_I^v$ and
 $E_I^w$ as functions of
 $\Delta x$ and
 $\Delta z$. Note that due to the symmetry of the flow,
 $E_I^{u}(\Delta x, \Delta z, y) = E_I^{u}(\Delta x, -\Delta z, y)$ (similarly for
 $E_I^v$ and
 $E_I^w$). For
 $E_I^u$ and
 $E_I^v$, the maximum is always located at
 $\Delta z = 0$, which is the plane displayed in figures 21(a,b). For the spanwise component, the maximum value of
 $E_I^w$ is offset in the spanwise direction, and its location varies with
 $y$. Figure 21(c) displays the horizontal section that contains its global maximum, which is located at
 $y^* \approx 6$. This offset is caused by the fact that
 $w$ motions travel in the spanwise direction until they reach the wall and affect the wall shear stress.
Informative regions quantifying the relative energy contained in the informative components  $u_I$,
 $v_I$ and
 $w_I$ for
 $\Delta T^* = 25$: (a)
 $E_I^u$ and (b)
 $E_I^v$ in the
 $\Delta z = 0$ plane; (c)
 $E_I^w$ in the plane
 $y^* \approx 6$. In (a,b), the black dashed line corresponds to
 $\Delta x^{max}(y)$.

Close to the wall, we find high values of  $E_I^u$, with peak value approximately
 $60\,\%$ at
 $y^*\approx 8$, and
 $\Delta x_u^{max}(y) \approx -h$, following an almost linear relationship with
 $y$. Farther from the wall (
 $y > 0.2h$),
 $\Delta x_u^{max}$ becomes more or less constant, although it should be noted that in this region, the values of
 $E_I^u$ for a fixed
 $y$ are low and relatively constant. This may induce some numerical uncertainty in the particular value of
 $\Delta x_u^{max}$, but the overall results are not affected. In contrast, high values of
 $E_I^v$ are located in a compact region further away from the wall (
 $y^*\approx 19$), and they tend to zero at the wall. The values
 $\Delta x_v^{max}(y)$ lie close to
 $-1.2h$ in this region, following a negative linear relationship with
 $y$. As before,
 $\Delta x_v^{max}(y)$ remains relative constant in low
 $E_I^v$ regions. Finally, although not shown,
 $\Delta x_w^{max}(y)$ and
 $\Delta z_w^{max}(y)$ lie in the intervals
 $[-h, -0.7h]$ and
 $\pm [0.1h, 0.2h]$, respectively, approaching zero at the wall. Nevertheless,
 $E_w^I$ becomes negligible for
 $y > 0.2h$.
We close this appendix by noting that although not explored in the present study,  $\Delta x^{max}$ computed with aIND might correspond to potential locations for sensor placement, since it maximises the mutual information with the target variable (Lozano-Durán & Arranz Reference Lozano-Durán and Arranz2022).
Appendix E. Validity of aIND of $u$ with respect to $\tau _x$


Figure 22 displays the mutual information between  $u_R(x_0, y_0, z_0)$ for
 $y_0^* \approx 10$ and
 $\tau _{x,+}(x_0-\Delta x_u^{max}-\delta x,z_0-\Delta z_u^{max}-\delta z)$ as a function of
 $\delta \boldsymbol {x} = [\delta x, \delta z]$, denoted as
 $I(u_R;\tau _{x,+})(\delta \boldsymbol {x})$. The mutual information is normalised by the total Shannon information of the wall shear stress,
 $H(\tau _x)$, such that
 $I( u_R; \tau _{x,+})(\delta \boldsymbol {x})/H(\tau _x) = 0$ means that
 $u_R$ contains no information about the wall shear stress at
 $\delta \boldsymbol {x}$, and
 $I( u_R; \tau _{x,+})(\delta \boldsymbol {x})/H(\tau _x) = 1$ implies that
 $u_R$ contains all the information about
 $\tau _{x,+}(\delta \boldsymbol {x})$. Note that aIND seeks to minimise
 $I(u_R;\tau _{x,+})(\boldsymbol {0})$. The results show that value of the
 $I( u_R; \tau _{x,+})(\delta \boldsymbol {x})/H(\tau _x)$ remains always low, reaching a maximum approximately 0.06 at
 $\delta x \approx -1.2h$ along the streamwise direction. Hence we can conclude that the residual term contains a negligible amount of information about the wall shear stress at any point in the wall, and aIND is a valid approximation of IND. For the sake of completeness, we also display in figure 22 the mutual information between
 $u_I$ and the wall shear stress. Since
 $\tau _{x,+} = {\mathcal {F}}(u_I)$, the mutual information
 $I( u_I; \tau _{x,+})(\delta \boldsymbol {x})$ has to be equal to
 $H(\tau _x)$ at
 $\delta \boldsymbol {x}=\boldsymbol {0}$, as corroborated by the results. For larger distances,
 $I( u_I; \tau _{x,+})(\delta \boldsymbol {x})$ decays following the natural decay of
 $I( \tau _{x,+}; \tau _{x,+})(\delta \boldsymbol {x})$, with values below 0.1 after
 $|\delta \boldsymbol {x}| \approx h$.
Mutual information between the streamwise wall shear stress and the residual field,  $I( u_R; \tau _{x,+})(\delta \boldsymbol {x})$ (blue circles) and the informative field
 $I( u_I; \tau _{x,+})(\delta \boldsymbol {x})$ (red circles). The dashed line corresponds to
 $I(\tau _{x,+};\tau _{x,+})(\delta \boldsymbol {x})$.


 Open access

