Organic vegetable growers consistently list weed control as a priority (Walz Reference Walz1999) and a major constraint to organic agriculture expansion (Bárberi Reference Barberi2002). Tillage and cultivation are the most commonly used methods for managing weeds in organic systems, but efficacy and timing of tillage often depends on ideal soil conditions. Further, conventional tillage disrupts soil structure, which accelerates surface runoff and soil erosion, resulting in reduction of soil organic matter, soil degradation, and water pollution (Dick Reference Dick1997; Hatfield et al. Reference Hatfield, Allmaras, Rehm and Lowery1998). Because of the negative impacts of tillage on environmental quality, conservation agricultural practices have been widely encouraged (Price et al. Reference Price, Balkcom, Culpepper, Kelton, Nichols and Schomberg2011).
Advances over the past several decades in PRE and POST herbicide chemistries, genetically modified crops, and seed treatments, coupled with low-cost herbicides, have allowed for the successful adoption of conservation tillage practices in agronomic crops (Uri Reference Uri2000). However, conservation tillage methods have been less practical for organic producers, especially organic vegetable farmers, for several reasons. There are few herbicides registered for use in organic vegetable systems, and none that can be applied PRE. Further, organic herbicides are used largely after crop emergence, which may result in crop injury, subsequently causing yield reductions (Rice et al. Reference Rice, Hapeman, McConnell, Sadeghi, Teasdale, Coffman, McCarty, Abdul-Baki and Starr2007; Stoklosa et al. Reference Stoklosa, Matraszek, Isman and Upadhyaya2012). Finally, most, if not all, organic herbicides are only moderately effective under ideal conditions and can be costly when sprayed over entire fields at rates required for adequate weed suppression (Evans et al. Reference Evans, Bellinder and Hahn2011). This makes using herbicides to support conservation tillage in organic cropping systems a less viable option. For organic producers, the inability to use herbicides makes conventional tillage even more critical for managing weeds (Price and Norsworthy Reference Price and Norsworthy2013).
Though cultivation following crop planting is the most commonly used method for weed control in organic vegetable production, it has several disadvantages. For example, cultivation may not be practical when plants are large, as it can damage the crop (Johnson et al. 2010). While weeds between crop rows can be managed with cultivation in some cropping systems, weeds within crop rows generally escape cultivation. Further, mechanical weed control following crop emergence is not possible for high-density crops, especially vining crops (Boyd et al. Reference Boyd, Brennan and Fennimore2006). These and other potential shortcomings suggest that relying on tillage and/or cultivation for weed management is unsustainable, and that conservation agriculture integrated with polyethylene or cover-crop mulch may be the best approach to achieving sustainability (Bajwa Reference Bajwa2014). Manual weeding is the most effective method of weed suppression, but can be significantly costlier than mechanical cultivation (Chandler and Cooke Reference Chandler and Cooke1992) and is often economically unfeasible (Melander et al. Reference Melander, Rasmussen and Barberi2005). Black plastic mulches provide a viable option for managing weeds within crop rows and can promote crop growth and early harvest (Johnson and Fennimore Reference Johnson and Fennimore2005; Sharma et al. Reference Sharma, Sharma and Singh2004). However, plastic mulches increase production cost and removal and disposal pose additional challenges. Biodegradable mulches could save significant labor and disposal costs, but are susceptible to deterioration, and weeds may break through or emerge from tears in the mulch (Miles et al. Reference Miles, Wallace, Wszelaki, Martin, Cowan and Walters2012).
In the mid-Atlantic states, cover crops are widely used in crop rotation schemes with field and vegetable crops (Delate et al. Reference Delate, Friedrich and Lawson2003; Duiker and Curran Reference Duiker and Curran2005; Schipanski et al. Reference Schipanski, Barbercheck, Douglas, Finney, Haider, Kaye, Kemanian, Mortensen, Ryan, Tooker and White2014; Teasdale et al. Reference Teasdale, Abdul-Baki and Park2008). Research has shown that cover crops can be used to help manage weeds in vegetable fields (Ngouajio et al. Reference Ngouajio, McGiffen and Hutchinson2003; Ngouajio and Mennan Reference Ngouajio and Mennan2005), and winter cover crops can be used as part of an integrated weed management program in vegetable systems (Isik et al. Reference Isik, Kaya, Ngouajio and Mennan2009). Radish (Raphanus sativus L. ‘Daikon’) has been widely adopted as a winter cover crop by farmers in the norther United States because of its capability to alleviate soil compaction and suppress weeds (Chen and Weil Reference Chen and Weil2010; Lawley et al. Reference Lawley, Weil and Teasdale2011). Cereal rye (Secale cereal L. ‘Wheeler’) is commonly used as a catch crop to reduce postharvest nutrient loss to watersheds and their tributaries (Coale et al. Reference Coale, Costa and Bollero2001). Moreover, cereal rye is also capable of suppressing weeds by forming a physical barrier on the soil surface, which prevents weed seed germination by releasing allelochemicals (Ogutu Reference Ogutu2007; Rice 1974; Ryan et al. Reference Ryan, Curran, Grantham, Hunsberger, Mirsky, Mortensen, Nord and Wilson2011; Stirzaker and Bunn Reference Stirzaker and Bunn1996). Crimson clover (Trifolium incarnatum L.) is a popular legume cover crop that can enhance crop growth and yield by adding nitrogen (N) (Parr et al. Reference Parr, Grossman, Reberg-Horton, Brinton and Crozier2011; Torbert et al. Reference Torbert, Reeves and Mulvaney1996). Similar to cereal rye, crimson clover has been shown to inhibit weed seed germination through allelopathy (Creamer et al. Reference Creamer, Bennett, Stinner, Cardina and Regnier1996), and its residue is capable of reducing weed density by forming a physical barrier (Reddy et al. Reference Reddy, Zablotowicz, Locke and Koger2003). When grown during the winter, crimson clover can decrease weed biomass at crop planting in the spring (Bàrberi and Mazzoncini Reference Barberi and Mazzoncini2001). If mixed with cereal grains, crimson clover provides weed suppression while retaining benefits of N fixation. Several studies have shown that when used in minimum-tillage systems, legume cover crops perform better when mixed with a grass than when grown alone (Brennan et al. Reference Brennan, Boyd, Smith and Foster2009; Burgos et al. 2006; Reberg-Horton et al. Reference Reberg-Horton, Grossman, Kornecki, Meijer, Price, Place and Webster2012; Yenish et al. Reference Yenish, Worsham and York1996). In addition to helping suppress weeds directly through competition, cover crop residue can inhibit growth of weeds through changes in N dynamics (Kumar et al. 2008) and environmental cues such as light and temperature fluxes (Liebman and Janke Reference Liebman and Janke1990).
The adoption of reduced tillage and no-till practices in organic vegetable production has been limited, partially due to the need for research efforts in this area. Additionally, a major concern of organic producers is that intensive tillage and cultivation are needed to prevent yield-reducing infestations of weeds, especially perennial weeds (Melander et al. 2012; Peigné et al. 2007), and that season-long weed suppression cannot be obtained under conservation tillage practices. Further, crop yields under conservation tillage may not be comparable with those obtained under conventional tillage if weeds are not managed effectively (Bottenberg et al. Reference Bottenberg, Masiunas, Eastman and Eastburn1997). Thus, for conservation tillage to be a viable option for organic producers, various weed management practices must be suitably integrated to better ensure its success (Bajwa Reference Bajwa2014). The aim of this study was to evaluate influences of different tillage methods combined with a mixed winter cover crop on weed suppression and crop yields in organically managed eggplant (Solanum melongena L.) and sweet corn (Zea mays L.). More specifically, the study assessed and compared impacts of two conservation and conventional tillage practices on 1) weed density, 2) time required for hand-weeding, and 3) crop yields.
Materials and Methods
Study Site and Experimental Design
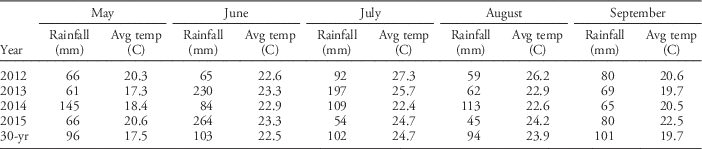
The experimental site was located at the University of Maryland Central Maryland Research and Education Center in Upper Marlboro, Maryland (38.86°N, 76.78°W). The annual precipitation at this location is 1,110 mm, of which 50% occurs from May to September. Mean daily temperature and total precipitation during the growing season ranged from 21.4 to 23.4 C and from 362 to 509 mm, respectively (Table 1). Soils at the study site were Annapolis series (fine-loamy, glauconitic, mesic Typic Hapludults) with 2% to 5% slope. The surface soil was sandy loam with a pHH2O of 6.2 and organic carbon content of 0.8%. The experiment was established in 2011 and completed in 2015 in the same field under organic transition.
Monthly rainfall and mean temperature during the 2012 to 2015 growing seasons, with 30-year averages.

The test crop in 2012 and 2014 was eggplant (‘Dancer’) and in 2013 and 2015, sweet corn (‘Luscious’). The experiment was arranged in a randomized complete block design with four blocks and four tillage treatments. Treatments included 1) conventional tillage without cover crop residue (bare ground) (CT-BG), 2) conventional tillage with black polyethylene plastic mulch (CT-BP), 3) strip-tillage with cover crop residue (ST), and 4) no tillage with cover crop residue (NT). Individual plots were 12 m by 12 m and separated by ≥4.6-m-wide alleys. Plots of CT-BG, NT, and ST treatments contained 12 crop rows with row spacing of 0.9 m. In the CT-BP treatment, there were six raised beds covered by 0.8-m-wide black plastic mulch, and neighboring beds were separated by 1.0 m of bare soil. Double crop rows with 45-cm row spacing were centered on each bed. This insured that all treatments contained the same number of crop rows and plants. Plant spacing was 41 and 47 cm for eggplant in 2012 and 2014, respectively, and 24 cm for sweet corn in both years. Planting holes in plastic mulches were 12 cm in diameter. Treatment applied to each plot remained consistent across all years to determine the cumulative treatment effect.
Field and Crop Management
The time line for all field operations is provided in Table 2. In September 2011, cover crops were drilled at approximately 18-cm row spacing and at seeding rates of 4.5 and 12.3 kgha−1 for radish and crimson clover, respectively, in all treatments. The experiment was originally designed to include a cover crop mixture of radish and crimson clover. However, volunteer cereal rye from a previous cover crop planting was observed in all plots during the spring of 2012. As such, it was decided to include cereal rye as part of the cover crop mixture for the remaining study years. In September 2012, 2013, and 2014, row spacing and seeding rates for radish and crimson clover remained the same as in 2011, and cereal rye seeding rates were 67.3 kgha−1 in 2012 and 44.8 kgha−1 in 2013 and 2014. Adjusting the cereal rye seeding rate in 2013 and 2014 allowed the cover crop dry matter, percent crimson clover, carbon to nitrogen ratio, and total nitrogen to more closely match the levels observed in 2011 when the cereal rye germinated adventitiously. Radish was frost-killed at its vegetative stage during winter months when air temperature dropped below −4C for several consecutive nights. Cover crop samples were collected a single time between late April and mid-May of each year, immediately before the cover crops were terminated by flail-mowing. Two quadrats (0.5 m by 0.5 m) were randomly placed in each plot, and plant samples within each quadrat were cut at soil level, placed in a paper bag, sorted by cover crop species, and oven-dried to determine the species composition and total dry matter at cover crop termination. Dried samples from the same plot were combined into one sample and machine-ground to pass through a 1.0-mm sieve for tissue nitrogen and carbon content determination. Nitrogen contribution from cover crops per unit area was thus calculated.
Timetable for field operations from cover crop planting through crop harvest.

a Abbreviations: CC, cover crop; CT-BG, conventional tillage without surface mulch (bare ground); CT-BP, conventional tillage with black plastic mulch; EP, eggplant; NT, no-till; SC, sweet corn, ST, strip-tillage.
Each study year, cover crop plantings in CT-BG and CT-BP treatments were flail-mowed with a John Deere 25A flail mower (John Deere, Moline, IL) during late April or mid-May. Cover crops in NT and ST were mowed 1 wk later than those in CT-BG and CT-BP treatments because less time was required to prepare beds in NT and ST treatments for planting vegetable crops. One week after the plots were mowed, CT-BG and CT-BP treatments were tilled to a depth of approximately 30 cm with a moldboard and chisel plow (John Deere) in 2012 and 2013 to 2015, respectively. One week after the plots were plowed, CT-BG and CT-BP treatments were disked to a depth of 15 cm twice (before and after fertilizer application), and afterwards the black plastic mulch was laid in the CT-BP treatment with a plastic mulch bed layer. Strip-tillage in the ST treatment and fertilizer application in the ST and NT treatments were done on the same day. A two-row strip-tiller (Bigham Brothers Inc, Lubbock, TX) was used in the ST treatment to till to a depth of 20 cm. The width of the tilled zone was approximately 25.5 cm, while the cover crop residue outside the tilled zone was left undisturbed. Preplant fertilizer was applied within the strip zones, after which the strip zones were tilled again to incorporate the fertilizer. For each study, test crops were planted in all treatments 1 day after application of the preplant fertilizer. Nine-week-old greenhouse-grown eggplant seedlings were machine-transplanted in late May of 2012 and 2014. Sweet corn was directly seeded in late May of 2013 and 2015. During each study year, sweet corn was replanted approximately 2 wk later in areas where seeds failed to germinate or were eaten by Canada geese (Branta canadensis).
The targeted N fertilization rate was 134 kilograms N per hectare for all crop plantings. Based on total N accumulated in the cover crop and the potential N release rate (Poffenbarger et al. Reference Poffenbarger, Mirsky, Weil, Kramer, Spargo and Cavigelli2015), the available N from the cover crop was estimated to be approximately 50 kilograms N per hectare during each crop season. In order to meet crop N demand, organic fertilizers were applied to provide N at a rate of 45 kilograms N per hectare at preplanting and at 39 kilograms N per hectare as a side-dressing 4 wk after planting. All fertilizers were banded by hand within crop rows. However, because of the black plastic cover, it was impossible to side-dress in the CT-BP treatment. Fertilizer application in the CT-BP treatment was therefore applied at full rate (84 kilograms N per hectare) at preplanting. In blocks I and II, blood meal (12-0-0, Seven Springs Farm, Floyd, VA) and feather meal (microSTART60 Plus 7-2-2, Perdue AgriRecycle LLC, Seaford, DE) were used to minimize phosphorus input because high soil phosphorus was detected in these blocks from past farming activities. Poultry litter (microSTART60 3-2-3, Perdue AgriRecycle, LLC) was used in blocks III and IV. Surface drip irrigation was established and used when rainfall events were insufficient to meet crops’ water demands.
Weed Assessment
Weed surveys were conducted three times in 2012 and twice in 2013, 2014, and 2015 in each plot after the crop was planted to estimate weed density. During each survey, a 0.25- by 0.25-m quadrat was placed in eight randomly selected areas within each plot. Weeds within the quadrats were identified and counted. The percentage of soil surface area covered by either crop residue or plastic mulch (CT-BP treatment only) within the quadrat was visually estimated. Weeds in intra- and inter-row areas were sampled and recorded separately. Intra-row area consisted of crop plants and ground area within 17.5 cm on either side (35-cm total width), and the remaining 55-cm-wide zone was considered the inter-row area. Weed surveys were conducted at 2, 4, and 6 weeks after transplanting (WAT) in 2012; 4 and 7 weeks after planting or transplanting (WAP/T) in 2013 and 2014; and 3 and 7 weeks after planting (WAP) in 2015. Following each weed assessment, weeds were removed by hand, with the exception that cultivation was used in CT-BG and CT-BP treatments at 2 and 4 WAT in 2012. Time spent on hand-weeding (hoeing and pulling) was recorded per individual row for a total of eight rows in each plot.
To further evaluate treatment impact on weeds, a 0.25-m2 (0.25 m wide by 1.0 m long) area within the crop row was flagged at two randomly selected locations within each plot. Weeds were allowed to grow in these designated (weedy) areas during the growing season and were removed by cutting at the soil surface at 7, 12, 10, and 11 WAP/T in 2012, 2013, 2014, and 2015, respectively. Weeds were placed in a paper bag, brought back to the lab for species identification and counts, and then dried at 65 C until dry to determine dry matter.
Yield
Eggplants were hand-harvested and fresh weight was recorded twice per week from 8 to 13 WAT in 2012 and three times per week from 8 to 15 WAT in 2014. Sweet corn ears were harvested and counted three times (at 9, 12, and 13 WAP) in 2013 because of the late replanting dates and once at 10 WAT in 2015. All rows were harvested, but yield data were taken only from eight interior crop rows. Eggplant and sweet corn plants in designated weedy areas (three plants per area) were harvested and their yield was recorded separately. In 2014, eggplant fruits in weedy areas were mismarked during some harvest events, and thus data for 2014 are not available. In an effort to determine how weeds in the weedy areas influenced crop productivity in 2014, in the absence of yield data, plants in the weedy area and three randomly selected plants in the weed-free area were cut at soil level and dried for dry matter comparison. Percent yield loss in designated weedy areas was estimated by subtracting yield in the weedy area from that in the hand-weeded area and dividing this by the yield in hand-weeded area. The same method was used to determine percent plant biomass reduction in weedy areas in 2014.
After harvest was complete, each plot was prepared for cover crop planting. All treatments were flail-mowed, and NT and ST treatments did not receive any additional preparation prior to cover crop planting. Plastic mulches in the CT-BP treatment were manually removed. In addition, CT-BG and CT-BP treatments were chisel-plowed and disked, and the CT-BP treatment received two passes with a pulvi-mulcher (Landoll Corporation, Marysville, KS).
Statistical Analyses
Analysis of variance was performed using PROC MIXED (SAS version 9.4, SAS Institute, Cary, NC). For weed density, soil surface residue or mulch coverage, and time required for hand-weeding, analyses were separated by year to differentiate impacts between treatments and sampling dates. In the model, treatment and location (intra- vs. inter-row) were treated as fixed factors, sampling date as a repeated measure, and block and sample number within plot as a random factor. When there was a significant three-way or two-way interaction among treatment, location, and date (P≤0.05), mean separation was done using the PDIFF option of the LSMEANS statement. For cumulative weed density, average soil surface residue or mulch coverage, total time required for hand-weeding, and weed biomass in weedy areas, treatment and year were fixed factors because of the potential cumulative effect of tillage from previous year(s), while location and block were random factors. For other variables, analyses were separated by year because of the differences of crop species and parts of the crop sampled each year. PROC CORR (SAS version 9.1, SAS Institute, Cary, NC) was used to explore relationships between weed density and soil surface coverage and between weed biomass and crop yield and biomass.
Results and Discussion
Cover Crop Biomass
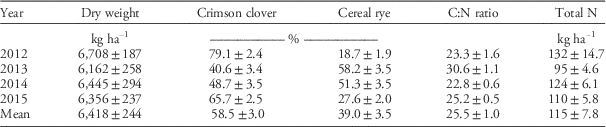
Cover crop dry biomass, species composition, and C:N ratio at termination are presented in Table 3. Radish was winter-killed during late December to mid-January, decomposed very quickly, and left no harvestable biomass by late April. Therefore, the only species of cover crops present at termination were crimson clover and cereal rye. Total cover crop dry matter was similar each year and averaged 6,418 kgha−1 during the four plantings. The highest proportion of total dry matter was crimson clover in 2012 and 2015, cereal rye in 2013, and equal proportions of crimson clover and cereal rye in 2014. The cover crop C:N ratio ranged from 22.8 (2014) to 30.6, and was highest in 2013. Higher cover crop C:N ratio may be associated with a greater cereal rye seeding rate or a late growth stage of cover crops at termination. The amount of cover crop total N content was negatively affected by C:N ratio because the portion of N in plant dry tissue was higher at a relative lower C:N ratio.
Mean (± SE) cover crop dry matter, species composition by dry matter, C:N ratio, and total N at cover crop termination.

Weed Density and Soil Surface Coverage
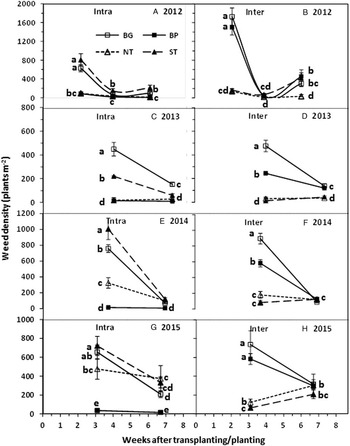
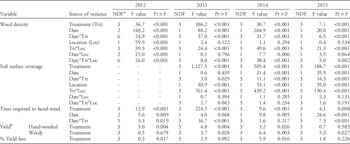
Among weeds observed during each survey, smooth crabgrass, goosegrass, and large crabgrass were the dominant grass weed species, and carpetweed and broadleaf plantain were the dominant broadleaf weeds. There was a significant interaction between effects of treatment, location (intra- vs. inter-row), and date on weed density in each growing season (Table 4). As such, weed density is presented separately by intra- and inter-row locations for each survey event (Figure 1). In 2012 within intra-row areas, weed density was consistently greatest in ST and lowest in CT-BP for each sampling event; weed density in NT was lowest (same as CT-BP) at 2 and 6 WAT and in CT-BG was greatest (similar to ST) at 2 WAT and intermediate at 4 and 6 WAT (Figure 1A). Weed density in inter-row areas in 2012 was greater in CT-BG and CT-BP than it was in NT and ST at 2 WAT and was lowest in NT at 6 WAT (Figure 1B). In 2013, intra-row weed density was highest in CT-BG and lowest in CT-BP and NT for both sampling events (Figure 1C), and inter-row weed density was highest in CT-BG and lowest in NT and ST for each sampling event (Figure 1D). In 2014, intra-row weed density was greatest in ST, followed by CT-BG, NT, and CT-BP at 4 WAT, but not different among treatments at 7 WAT (Figure 1E). Inter-row weed density was highest in CT-BG and lowest in NT and ST at 4 WAT (Figure 1F). In 2015, intra-row weed density was highest in ST and CT-BG and lowest in CT-BP at 3 WAP and lower in CT-BP at 7 WAP (Figure 1G). Inter-row weed density was greater in CT-BG and CT-BP than it was in NT and ST at 3 WAP, but was not different among treatments at 7 WAP (Figure 1H).
Weed density for each treatment in the intra-row (A, C, E, G) and inter-row (B, D, F, H) areas in 2012, 2013, 2014, and 2015. Values indicated by different letters in each subfigure are statistically different (α=0.05). Abbreviations: BG, conventional tillage without surface mulch (bare ground); BP, conventional tillage with black plastic mulch; NT, no-till; ST, strip-tillage.

F-statistic and P-values for treatment, location, and date effects on weed density, percent surface mulch coverage, hand-weeding time, and yield during each study year.

a Abbreviations: Loc, location; NDF, number of degrees of freedom; Pr > F, significance probability value associated with the F value; Trt, treatment.
b Plant biomass, not fruit yield, was measured in 2014.
There was a significant interaction effect of treatment and year on cumulative weed density (F=3.13, P=0.005). Therefore, mean comparison was conducted within each year. As shown in Table 5, cumulative weed density was the highest in CT-BG, lowest in NT, and intermediate in CT-BP and ST in 2012 and 2013. Cumulative weed density was greatest in CT-BG, lowest in NT, and intermediate in CT-BP and ST in 2014. Cumulative weed density was consistently greatest in CT-BG but was not different among the other three treatments in 2015.
Cumulative weed density during each study year.

a Abbreviations: CT-BG, conventional tillage without surface mulch (bare ground); CT-BP, conventional tillage with black plastic mulch; NT, no-till; ST, strip-tillage.
b Values in the same column followed by different letters are statistically different (α=0.05).
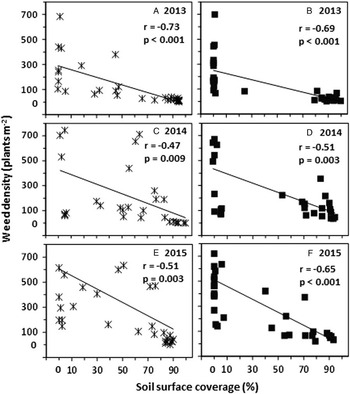
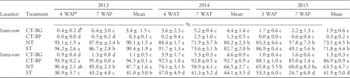
Data on soil surface coverage by cover crop residue or plastic mulch were not collected in 2012. In 2013, there was a significant interaction between treatment, location, and date on percentage of surface covered (Table 4). In 2014 and 2015, there were interactions between treatment and date as well as location and date on percentage of surface covered. Percentage of soil surface covered is presented in Table 6, which shows similar patterns among treatments in 2013 to 2015. In the intra-row area, soil surface coverage was greatest in CT-BP, followed by NT, ST, and CT-BG. Residue coverage in the NT and ST inter-row areas was similar during each growing season (>83% at 3 to 4 WAT/P), though it decreased from early to mid–growing season. For each growing season, there was a significant negative correlation between weed density and percent soil surface coverage for intra- and inter-row areas (Figure 2).
Correlation between weed density and soil surface coverage within intra-row (A, C, and E) and inter-row (B, D, and F) areas in 2013 (upper), 2014 (middle), and 2015 (bottom).

Variation of percent soil surface covered by cover crop residue or plastic mulch (BP) during each study year.

a Abbreviations: CT-BG, conventional tillage without surface mulch (bare ground); CT-BP, conventional tillage with black plastic mulch; NT, no-till; ST, strip-tillage; WAP, weeks after planting; WAT, weeks after transplanting.
b Values in the same column in each year followed by different letters are statistically different (α=0.05).
There were greater weed densities in intra-row areas of CT-BG and ST (787, 1,164, 110, and 132 weeds m−2 in 2012; 601, 281, 25, and 47 weeds m−2 in 2013; 828, 1,125, 20, and 422 weeds m−2 in 2014; and 863, 1,053, 52, and 850 weeds m−2 in 2015 for CT-BG, ST, CT-BP, and NT, respectively) and inter-row areas of CT-BG and CT-BP (2,062, 1,999, 190, and 655 weeds m−2 in 2012; 613, 363, 66, and 56 weeds m−2 in 2013; 982, 708, 299, and 207 weeds m−2 in 2014; and 1,053, 881, 425, and 272 weeds m−2 in 2015 for CT-BG, CT-BP, NT, and ST, respectively) during each growing season. This suggests that soil disturbance caused by conventional or strip-tillage stimulated weed emergence. Tillage activities conducted just prior to planting may have exposed weed seeds in the soil to light or transferred weed seeds from the deep profile to the soil surface, stimulating them to germinate (Clements et al. Reference Clements, Benoit, Murphy and Swanton1996). However, Rapp et al. (Reference Rapp, Bellinder, Wien and Vermeylen2004) reported that no-till and strip-tillage treatments suppressed weeds more effectively than conventional tillage treatment. In the present study, the ST treatment was strip-tilled on the same day that the test crops were planted. In addition, a preplanting fertilizer was applied in tilled zones 1 day prior to planting. The timing of N fertilizer application may influence weed germination and emergence and competitiveness of weeds (Sweeney et al. Reference Sweeney, Renner, Laboski and Davis2008). Thus, soil disturbance during tillage and incorporation of fertilizer may have contributed jointly to a heavy flush of weeds within crop rows in the ST treatment.
However, an exception occurred in the CT-BP treatment. Intra-row areas in these plots were covered shortly after tillage by black plastic mulch, which blocked sunlight and provided a physical barrier to weed seed germination. Weed density in intra-row spaces was similar between NT and CT-BP in 2012 and 2013, which suggests that NT could provide similar weed suppression as CT-BP under some circumstances. The possible explanation for lower weed density in NT intra-row areas in 2012 compared to other years is that low precipitation in May and June helped extend the period of residue coverage on the soil surface in the NT treatment. Residue decomposition has been shown to decline with a decrease in soil moisture (Hood Reference Hood2001). In 2013, the composition of cereal rye dry matter and the C:N ratio of the mixed cover crops at termination was highest among the four years, which corresponded to a higher cereal rye seeding rate (67 vs. 45 kgha−1). Ryan et al. (Reference Ryan, Curran, Grantham, Hunsberger, Mirsky, Mortensen, Nord and Wilson2011) reported that increasing cereal rye seeding rate increased weed suppression during the summer crop-growing season. The higher seeding rate and percentage of cereal rye residue could have enhanced weed suppression by providing a physical barrier for an extended period of time (Altieri et al. Reference Altieri, Lana, Bittencourt, Kieling, Comin and Lovato2011), reducing the amount of niche space for weed germination (Ryan et al. 2001) and increasing the release of compounds that are allelopathic to weed seedlings (Barnes and Putnam Reference Barnes and Putnam1987; Tabaglio et al. Reference Tabaglio, Marocco and Schulz2013).
There were negative correlations between weed density and soil surface coverage (cover crop residue or black plastic mulch) during 2013, 2014, and 2015 in intra- and inter-row areas. This is consistent with observations made by Ramakrishna et al. (2006), who showed that covering the soil surface with either straw or polyethylene plastic mulch reduced weed infestation. The underlying mechanism of weed suppression by surface coverage is the reduced light transmittance, which is reported to be more important than allelopathy or physical barriers (Teasdale Reference Teasdale1993). On the other hand, soil temperature and moisture measurements were lower in NT than they were in the CT-BG or CT-BP treatments in early growing seasons (data not shown), which was probably due to crop residue cover and decreased soil disturbance (Dabney et al. Reference Dabney, Delgado and Reeves2001). Cooler soil temperature in the NT treatment could have contributed to delayed weed seed germination and thus lower weed density.
Time Required to Hand-Weed
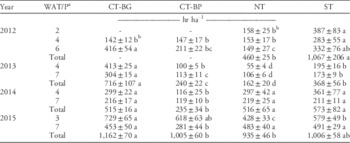
The CT-BG and CT-BP treatments were cultivated on June 7, 2012. Time to hand-weed was not recorded for these treatments for this sampling event. There was a significant interaction of date and treatment on hand-weeding time in 2012, 2013, and 2015. In 2014, there was no interaction effect, but main effects of date and treatment were significant (Table 4). There was a significant interaction of year and treatment on total time required for hand-weeding during each growing season (F=3.71, P=0.004). Time required to hand-weed is presented in Table 7. In 2012, ST required the most time to hand-weed at 2 WAT, and CT-BG and ST required more time than did NT at 6 WAT. The total time required to hand-weed was greater in ST than it was in NT in 2012. In 2013, hand-weeding time was greatest in CT-BG, followed by ST, CT-BP, and NT at 4 WAP. Hand-weeding time at 7 WAP and the total time required for hand-weeding for the whole growing season followed the same trend: greatest in CT-BG, followed by ST, CT-BP, and least in NT. In 2014, hand-weeding time was lowest in CT-BP for each sampling event. In 2015, hand-weeding time was greatest in CT-BG and CT-BP followed by ST and NT treatments at 3 WAP; hand-weeding time was lowest in CT-BP treatment at 7 WAP. Total cumulative time required to hand-weed plots was greater in CT-BG than it was in CT-BP and NT.
Time required to hand-weed each treatment during each study year.

a Abbreviations: CT-BG, conventional tillage without surface mulch (bare ground); CT-BP, conventional tillage with black plastic mulch; NT, no-till; ST, strip-tillage; WAT/P, Weeks after transplanting or planting.
b Values in the same row followed by different letters are statistically different (α=0.05).
Time required for hand-weeding was significantly correlated with weed density during each growing season (2012: r=0.73, P<0.001, n=40; 2013: r=0.71, P<0.001, n=64; 2014: r=0.40, P=0.001, n=62; and 2015: r=0.41, P=0.018, n=32), though there were variations among years. The overall correlation coefficient was lower in 2014 than it was in 2012 and 2013 because of poor correlation between weed density and hand-weeding time for the first hand-weeding event in 2014, especially for inter-row areas. The weather condition in 2014 early growing season was warmer and drier, which may have been more suitable for the germination and growth of some weed species. Dominant weed species were smooth crabgrass, goosegrass, and large crabgrass (57%) in inter-row areas of NT and ST treatments, and carpetweed (59%) in CT-BG and CT-BP treatments on June 23, 2014. The weed species were similar for the survey conducted on July 16, 2014. The hand-weeding crew reported that it required less effort and time to remove carpetweed compared with the other grass weeds. This may have contributed to the difficulties associated with removing weeds once their root systems have become well established (Shrestha et al. Reference Shrestha, Browne, Lampinen, Schneider, Simon and Trout2008). Therefore, weed species and density were both factors influencing time for hand-weeding. The same distribution trend of weed species was observed from the first weed survey in 2015. There was a greater percentage of smooth and large crabgrass in intra- and inter-rows of ST (77% and 80%) and NT (66% and 61%) than there was in CT-BG (49% and 60%). Further, soils in NT and ST inter-rows were compacted, thus hand-weeding required more effort and time than they did in the CT-BG and CT-BP treatments where soils were looser. Thus, weed density may be only one of the important factors contributing to the time needed for hand-weeding in 2015.
Weed Biomass in Designated Weedy Areas
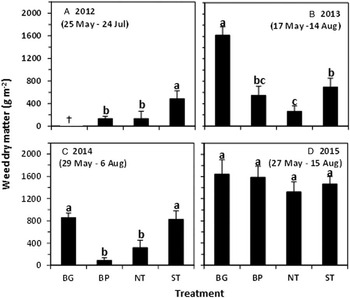
Weeds in designated weedy areas were left undisturbed from test crop planting until they were sampled. An exception was in 2012, when the CT-BG treatment was cultivated along with the other areas within the plot on June 7, while weedy areas in the CT-BP treatment were not affected by cultivation as they were within areas covered by plastic mulch. There was a significant treatment and year interaction effect on weed biomass (F=5.49, P<0.001). Therefore, mean comparison was restricted within year to evaluate treatment effects. Weed biomass was greater in ST than it was in CT-BP and NT in 2012 (Figure 3A), in the order of CT-BG>ST>NT. Weed biomass in CT-BP was less than that in CT-BG but not different from ST and NT in 2013 (Figure 3B). In 2014, weed biomass was greater in CT-BG and ST than it was in CT-BP and NT (Figure 3C). There were no treatment differences in weed biomass 2015 (Figure 3D).
Weed biomass harvested from the weedy area of each treatment in (A) 2012, (B) 2013, (C) 2014, and (D) 2015. Bars with different letters within each year are statistically different (α=0.05). Weed biomass for the BG treatment in 2012 was not included because weeds were partially removed in all BG plots by cultivation on June 7. Abbreviations: BG, conventional tillage without surface mulch (bare ground); BP, conventional tillage with black plastic mulch; NT, no-till; ST, strip-tillage.

Vegetable Yield and Plant Biomass
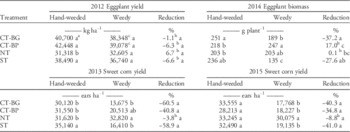
As shown in Table 4, in 2012 there was a significant treatment effect on eggplant yield in areas that were hand-weeded, but there was no treatment effect on yield or yield reduction in weedy areas. In 2014, there was a significant treatment effect on eggplant plant biomass in hand-weeded and weedy areas, and on biomass reduction in weedy areas. In 2012, yield in hand-weeded areas was lowest in the NT treatment (Table 8). In 2014, plant biomass within hand-weeded areas was in the order of CT-BG>NT=CT-BP, and within weedy areas in the order of CT-BP>CT-BG>ST. Reduction of plant biomass in weedy areas in 2014 was significant for CT-BG and ST treatments but insignificant for CT-BP and NT treatments; percent reduction was in the order of CT-BG>NT=CT-BP and ST>CT-BP. No yield differences were observed in weed-free areas in 2014 (data not shown). There was a significant negative correlation between eggplant yield and weed biomass in 2012 (r=−0.48, P=0.007) and plant biomass and weed biomass in 2014 (r=−0.71, P<0.001).
Vegetable yield and plant biomass in weedy and hand-weeded areas during each study year.

Abbreviations: CT-BG, conventional tillage without surface mulch (bare ground); CT-BP, conventional tillage with black plastic mulch; NT, no-till; ST, strip-tillage.
a Values in the same column followed by different letters are statistically different (α=0.05).
b Values for % reduction are not significantly different from zero (α=0.05).
c Weeds in the CT-BG and CT-BP were partially removed by cultivation at 2 weeks after transplanting but remained untouched from 2 to 7 weeks after transplanting (Jun 6 to Jul 24) 2012.
There was a significant treatment effect on corn ear production in hand-weeded and weedy areas in 2013, and only in weedy areas in 2015 (Table 4). In 2013, the ST treatment produced the greatest number of ears in hand-weeded areas, while NT produced a greater number of ears than did CT-BG and ST in weedy areas (Table 8). In 2015, no yield differences existed among treatments in hand-weeded areas, but the NT treatment produced the highest number of ears in weedy areas. In both years, there was a significant yield reduction in weedy areas in CT-BG, CT-BP, and ST but not in NT; however, percent reduction of yield was not different among treatments (Tables 4 and 8). Corn yield showed a significant negative correlation with weed biomass in 2013 (r=−0.66, P<0.001) but not in 2015 (r=−0.34, P=0.08).
One reason for the lower eggplant yield in 2012 and lower plant biomass in 2014 in the NT treatment may be related to its cooler soil temperature, which could have slowed crop growth. Eggplant plants require relatively high soil temperatures for optimal growth (Messiaen 1989). Soil temperatures are often lower in untilled than tilled soils, especially when cover crop residues are present (Wagner-Riddle et al. 1997). As recorded in 2014, average soil temperature in the growing season was 24.2, 24.7, 25.1, and 25.3 C in the NT, ST, CT-BG, and CT-BP treatments, respectively. Further, ground cover can alter the local climatic condition or microenvironment around plants and thus influence crop yield (Decoteau et al. 1990). Hooks et al. (Reference Hooks, Hinds, Zobel and Patton2013) reported that eggplant yield decreased significantly when the seedlings had been transplanted into crimson clover dying mulch compared to bare ground. However, the following year, when the crimson clover was strip-tilled and eggplant planted into tilled zones, yields were similar or higher in crimson clover compared to bare ground. Others investigating impacts of no-till on vegetable systems have shown similar harvest delays or yield reductions (Bottenberg et al. Reference Bottenberg, Masiunas and Eastman1999; Johnson and Mullinix Reference Johnson and Mullinix2000; Leavitt et al. Reference Leavitt, Sheaffer, Wyse and Allan2011; Mochizuki et al. Reference Mochizuki, Rangarajan, Bellinder, Bjorkman and van Es2007). In contrast to the results seen in eggplant, cooler soil temperature in the NT treatment did not delay sweet corn plant growth or ear production. Greater ear production in hand-weeded areas was associated with plant population density, which was higher in ST in 2013 and lower in CT-BP in 2015 (data not shown).
Weed density in the intra-row area was greater in ST and CT-BG treatments during each growing season. As such, it was foreseeable that weed biomass would be greater in these treatments than it was in CT-BP and NT. A negative correlation was observed between fruit yield and weed biomass in 2012, indicating potential yield loss due to weed competition; however, yield reductions in weedy areas were insignificant and did not differ from those seen in hand-weeded areas. This may be attributed to the time of weed removal. In 2012, weeds in weedy areas were removed at the beginning of eggplant reproductive stage (7 WAT), which may have reduced weed competition with crop in the critical period. In 2014, the reduction of plant biomass in the CT-BG and ST treatments was due to weed competition. In 2013, the number of sweet corn ears was negatively correlated with weed biomass in weedy areas. Sweet corn is a poorly competitive crop; therefore, it is important to suppress weeds within crop rows, especially at the critical period (Colquhoun et al. Reference Colquhoun, Bellinder and Kirkwyland1999, Williams Reference Williams2006). Weed pressure was high in the CT-BG and ST treatments, resulting in a 60% yield reduction, and was lowest in the NT treatment, where no yield loss occurred. Notable variation in corn ear production among treatments in 2015 made it difficult to detect treatment impact.
Organic farmers rely heavily on tillage and cultivation for managing weeds. However, tillage is the most energy-consuming task among all field operations, and growers can save from 30% to 40% in time, labor, machinery investment, and fossil fuels by practicing conservation agriculture compared with conventional agriculture (Hobbs et al. Reference Hobbs, Sayre and Gupta2008). During this study, the no-till treatment in combination with cover crop residue showed great promise for adoption in organic vegetable systems. Though NT resulted in the fewest weeds and required the least amount of time to hand-weed among treatments in 2012 and 2013, crops grew considerably more slowly under no-till conditions some years, resulting in a delayed harvest or yield reduction. Cooler soil temperature was culpable for slower plant growth and harvest delays in the NT treatment during this trial as plant growth and yields in ST were similar to or greater than those seen with conventional tilled treatments. Strip-tillage has been proposed as an alternative to NT in instances where residue cover may lower soil temperatures, or where hard pan development is a concern (Bottenberg et al. Reference Bottenberg, Masiunas and Eastman1999). However, in the current study, time required for hand-weeding was significantly greater in ST than it was in NT treatment during most years. This was mainly due to high weed density concentrated in tilled zones, as similar to NT, cover crop residue was mostly effective in suppressing weeds in inter-row areas. Thus, for strip-tillage to be a viable option for organic producers, alterations in methods from the current investigation will be required. First, applying fertilizers as post-plant surface bands close to crop rows may reduce weed seed germination and fertilizer uptake by weeds. Additionally, strip-tillage may require integration with other weed management tactics, such as the stale seedbed method, to improve weed suppression in intra-row areas. This method is executed by preparing a field and delaying crop planting to allow weed flushes, which can be killed just before planting. If killed with slight soil disturbances, the weed seedbank in the upper few centimeters of the soil may potentially be depleted, reducing weed pressure in the ensuing crop season (Caldwell and Mohler Reference Caldwell and Mohler2001). As such, it is proposed that fields are strip-tilled two to three weeks in advance of crop planting, and that germinated weeds are killed just prior to crop planting. Depleting the weed seed bank in the germination zone just prior to planting the vegetable crop allows more time for crop canopy closure prior to the next weed emergence. If an organic herbicide is used to kill the weed flush and applied solely to tilled zones, this will reduce the application cost while suppressing weeds in areas that are most crucial (Evans et al. Reference Evans, Bellinder and Hahn2011). It is believed that the stale seedbed tactic can improve weed control in vegetables grown under strip-tillage practices while reducing hand-weeding and weed management costs.
Acknowledgements
This study was funded by a United States Department of Agriculture National Institute of Food and Agriculture (USDA-NIFA) grant (2011-51106-31203) awarded through the Organic Transitions Program, and a USDA-NIFA grant (2014-70006-22551) through the Extension Integrated Pest Management program. We thank Dr Amanda Buchanan, Mr Peter Coffey, and Ms Lauren Hunt, who helped with field tasks associated with this study, and the crew at the Upper Marlboro Research Station for logistical support in preparation and planting of field plots.