


INTRODUCTION
Political parties are often identified with particular ethnic groups, and ethnicity is a major determinant of vote choice in sub-Saharan Africa. To account for this relationship, theories of instrumental ethnic voting propose that voters use the ethnic profile of a candidate or party as a cue or informational shortcut for the constituency a candidate or party will favor once in office. These voters then select the candidate or party most likely to deliver targeted benefits and access to government resources (Bates Reference Bates, Rothchild and Olorunsola1983). Vote choice may differ across individuals of the same ethnicity or for the same voter over time within this general framework because political institutions may affect which ethnic identities are salient for this calculation in a given election and induce strategic voting (Posner Reference Posner2005) or voters may differ in their beliefs about the ethnic credentials and credibility of candidates and parties (Ferree Reference Ferree2006).
Absent from these treatments of ethnic voting is consideration of the ethnic composition of a voter's local environment, which varies substantially even in rural areas often described as traditional homelands of particular ethnic groups. We propose that in rural areas this local ethnic geography affects vote choice because ethnic cues from candidates and parties impart different information to voters depending on where they live. Many goods sought by voters, such as health facilities and roads, can be geographically targeted by politicians and their benefits are not locally excludable. A voter's assessment of how likely she is to benefit from the election of a particular politician therefore depends on whether she lives among members of the ethnic group associated with that politician's party. Local ethnic geography is less important for vote choice in urban areas, where easier transportation makes these goods more like public goods. Incorporating local ethnic geography into theories of instrumental ethnic voting in this way helps account for the strong, but imperfect, correlation between ethnicity and vote choice.
We investigate our hypotheses on the relationship between local ethnic geography and vote choice for voters in rural and urban areas with unusually fine demographic and electoral data from Ghana, a new democracy with competitive two-party elections in which ethnicity plays a significant role. Our goal is to analyze the effect of local ethnic geography on vote choice rather than offer a complete explanation for voting behavior. We analyze the 2008 presidential election, because the president has substantial control over the distribution of resources in Ghana and elections for this office are competitive and use a single national district. Unlike parliamentary elections, this focus on the presidential election allows candidate ethnicity, candidate quality, and the competitiveness of the election to be fixed as local ethnic geography varies.
Using geocoded data from the 2000 Ghana Population and Housing Census, we calculate measures of local ethnic geography within a given radius around a voter or polling station and employ these measures in two separate analyses. The first is an analysis of 2008 presidential election results at the polling-station-level from the Brong Ahafo Region, a rural and ethnically diverse region of Ghana. We find that the vote share of a political party identified with a particular ethnic group is significantly greater for polling stations in areas where that ethnic group makes up a larger share of the surrounding population, even after controlling for estimates of the ethnic population shares at the polling stations themselves.
The second analysis combines the census data with geo-referenced nationally representative public opinion survey data from the Afrobarometer. We show that rural survey respondents are significantly more likely to support an ethnically affiliated political party when living in an area where the ethnic group affiliated with that party makes up a larger proportion of the population, even when this means voting against the party affiliated with the respondent's own ethnic group. This influence of local ethnic geography on vote choice is no less important than respondents’ evaluations of the economy. Consistent with our argument, but contrary to several alternative arguments, we find no such relationship for urban respondents. We also find little support in additional analyses for several alternative explanations for our results, such as endogenous sorting to more or less heterogeneous areas, the development of cross-ethnic social ties, or intimidation of local minority groups.
This study advances the literature on ethnic politics and voting in new democracies on several fronts. First and foremost, our work extends the theory of instrumental ethnic voting and offers a new explanation for variation in voting behavior by members of the same ethnic group, as documented in recent surveys in Africa (Bratton et al. Reference Bratton, Bhavani and Chen2011; Ferree et al. Reference Ferree, Gibson, Hoffman and Long2009; Hoffman and Long Reference Long and Gibson2012; Lindberg and Morrison Reference Lindberg and Morrison2008; Long and Gibson Reference Long and Gibson2012). Second, while a large literature on advanced democracies has examined the impact of the ethnic and racial composition of local environments on turnout and vote choice (e.g., Cho et al. Reference Cho, Gimpel and Dyck2006; Enos Reference Enos2011; Key Reference Key1949), intergroup attitudes (e.g., Gay Reference Gay2004; Oliver and Wong Reference Oliver and Wong2003), and support for redistribution and immigration (e.g., Hopkins Reference Hopkins2010; Rocha and Espino Reference Rocha and Espino2009), these relationships have not been explored in developing countries, where politics revolve around group identity and ethnicity more overtly.Footnote 1 Our work begins to fill this gap by highlighting how ethnic diversity in the local community affects vote choice and adds to a growing body of empirical studies that emphasize more macro-level contextual and temporal variation in the political salience of ethnicity (Eifert et al. Reference Eifert, Miguel and Posner2010; Posner Reference Posner2005). This contribution is made possible by using geographic demographic data at a level of detail that is not commonly available for the study of voting in Africa or elsewhere in the developing world. This is also one of only a handful of studies that analyze polling-station–level election results for an African country.Footnote 2
While we analyze data from only one country, local ethnic geography should similarly influence vote choice in elections where voters expect elected politicians to provide goods that are not locally excludable and to direct these goods to identifiable and locatable supporters. This includes much of sub-Saharan Africa, where ethnicity is considered a strong indicator of voters’ party affiliations (Kimenyi Reference Kimenyi2006), and many developing countries in Asia, where religion or caste can serve a similar role (Chandra Reference Chandra2004; Wilkinson Reference Wilkinson2004). It also includes rural areas in parts of Latin America, where voters may use other identity markers, past voting records, or other information to determine where club goods would likely be located by different parties, even though explicitly ethnic parties are traditionally rare (Madrid Reference Madrid2005; Van Cott Reference Van Cott2005).Footnote 3 In all of these areas, we expect similar results for elections at district or other subnational levels of offices that have significant authority over the location of club goods. But we do not expect our hypotheses to hold in postconflict settings or other areas where social divisions are so deep that voters would not expect to benefit from goods targeted toward other nearby groups.
The article proceeds as follows. First, we introduce the existing literature on ethnicity and voting. We then present our theoretical extension to theories of instrumental ethnic voting incorporating local ethnic geography before introducing the Ghanaian case. We next present our analysis of polling-station–level election returns in the Brong Ahafo Region and of individual-level survey data covering the entire country. The results from our analyses of these two data sources are broadly consistent with our extension of the theory of instrumental ethnic voting.Footnote 4 Finally, we discuss and find little support for several possible alternative mechanisms or explanations for our results.
ETHNIC VOTING IN AFRICA
A substantial literature in the study of African politics shows a broad correspondence between voters’ ethnicities and vote choice (e.g., Horowitz Reference Horowitz1985; Melson Reference Melson1971; Posner Reference Posner2005). Recent work views voting for co-ethnics as an instrumental action, as part of a larger model in which politicians mobilize voters along ethnic lines in pursuit of control over state resources, and voters seek targeted provision of state resources and other patronage from politicians in return for their support (Bates Reference Bates, Rothchild and Olorunsola1983; Chandra Reference Chandra2004; Ferree Reference Ferree2006; Posner Reference Posner2005). In exchange for their votes, voters demand from politicians private goods such as small gifts to individuals, as well as local club goods and preferential public policies (Wantchekon Reference Wantchekon2003).
Importantly, these instrumentalist theories are conceptually distinct from earlier theories of ethnic voting, which propose that voters support co-ethnic candidates because of intrinsic preferences for co-ethnics or as a fundamentally “expressive” act, affirming group membership by casting a ballot for representatives of their cultural group (Horowitz Reference Horowitz1985). As described by Ferree (Reference Ferree2006, 804), these theories hold that “voting is not an act of choice, based on a rational weighing of alternatives, but an expression of allegiance to a group.” Expressive voters may vote for parties affiliated with other ethnic groups if they feel weak attachment to their own ethnic group.
In contrast, proponents of instrumental ethnic voting do not view support for co-ethnic politicians as intrinsic to ethnic group membership. As Posner (Reference Posner2005, 91) writes for Zambia, “in a context where all politicians promise to distribute jobs and development resources . . . voters use ethnicity as a cue to help them distinguish promises that are credible. . . . [I]t is the information that ethnicity is assumed to convey about . . . patterns of patronage distribution . . . that explains why it plays such an important role.” Similarly, Chandra (Reference Chandra, Kitschelt and Wilkinson2007, 84) argues that benefit-seeking voters engage in ethnic voting as an “outcome of the information constraints that characterize patronage transactions” in new democracies, not because of innate preferences for co-ethnic politicians. In a self-reinforcing logic, a voter's incentive to support a co-ethnic candidate is strengthened by the belief that members of other ethnic groups are voting for their own candidate (Padro i Miquel Reference Padro i Miquel2007). Cross-ethnic voting is still possible if voters differ in their beliefs about the information conveyed by the ethnic cues given by candidates and parties (Ferree Reference Ferree2006).
Recent research on voting behavior in Africa emphasizes that voters do not always support the party affiliated with their own ethnic group. Rather than drawing on the expressive or instrumental ethnic voting hypotheses, these studies show in a variety of contexts that African voters are (retrospectively) responsive to the economic and policy performance of incumbent politicians (Hoffman and Long Reference Long and Gibson2012; Lindberg and Morrison Reference Lindberg and Morrison2008; Posner and Simon Reference Posner and Simon2002). For example, in a survey experiment in Kenya, Long and Gibson (Reference Long and Gibson2012) find that when offered a choice between a hypothetical non-co-ethnic candidate who delivered resources and a co-ethnic candidate who performed poorly in office, most respondents chose the high performing candidate from outside their group. Bratton et al. (Reference Bratton, Bhavani and Chen2011) find a similar pattern in Afrobarometer data, showing that approval of the incumbent government's handling of economic policy increases the probability that respondents will express support for the incumbent, even if they are not members of the ethnic groups controlling the government. Harding (Reference Harding2011) and Weghorst and Lindberg (Reference Weghorst and Lindberg2012) find that African voters reward incumbents who provide targeted state benefits.Footnote 5
Some of these results are presented as evidence against a logic of ethnic voting. They are indeed inconsistent with purely expressive or identity voting, since the strength of innate group attachments are unlikely to be affected by policy performance. However, these findings are not inconsistent with ethnicity serving as a cue for expected performance in low information contexts. The logic underlying instrumental ethnic voting is that voters use a politician's ethnicity or party's ethnic profile as an indicator of future performance; this does not preclude voters using additional information on past performance to inform their expectations of future performance when reliable information is available (Conroy-Krutz Reference Conroy-Krutz2012). From the instrumentalist view, it should not be a surprise that performance evaluations and ethnicity both contribute to voter decision making.
LOCAL ETHNIC GEOGRAPHY AND INSTRUMENTAL VOTING
We extend the logic of instrumental ethnic voting by incorporating local ethnic geography into the voter's decision. We begin with several standard elements of most theories of instrumental ethnic voting. First, voters and politicians belong to particular ethnic groups which are identified with particular locations or homelands.Footnote 6 Second, voters demand “development” and prefer to elect the politician or party that is more likely to provide goods and services once in office. Third, development may take the form of individual benefits or public policies which can be designed or implemented to primarily benefit a particular ethnic group because members of a group tend to live near one another and a group is often associated with a particular territory (Kasara Reference Kasara2007; Kimenyi Reference Kimenyi2006). Politicians often deliver targetable club goods, such as schools, roads, and health clinics, which benefit voters in a local area around those facilities but not beyond. From the politician's viewpoint, these club goods are more cost effective than private goods because they serve many people and voters can more easily observe and credit politicians for club goods delivery than for other types of goods (Armesto Reference Armesto2010).Footnote 7 Fourth, voters expect politicians to target these club goods and services to their core constituency of co-ethnics.
Theories of instrumental ethnic voting generally focus on the fourth point—by considering voters’ ideas about what constitutes a politician's core constituency, and thus the likely benefit of supporting that particular politician (Ferree Reference Ferree2006; Posner Reference Posner2005). Our argument takes a different approach and theoretically extends the third point. When politicians target club goods to their co-ethnics, they often cannot exclude non-co-ethnics from also enjoying the benefits because of the nature of these goods. A voter who is not a co-ethnic of a politician should therefore have a greater expectation of benefiting from the election of this politician when the local area around him has a higher proportion of that politician's co-ethnics.
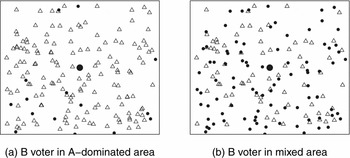
In other words, imagine a voter from ethnic group B surrounded by members of ethnic group A; this B voter is represented by the large circle in the center of Figure 1 panel (a) and members of group A are represented by the hollow triangles that surround him. This voter expects to benefit more from the election of a (non-co-ethnic) politician who will favor group A and locate club goods near this voter than from the election of a (co-ethnic) politician who will favor group B and fund club goods in another area with many members of group B. Consequently, a voter from group B becomes more likely to vote for the politician from group A and less likely to vote for his co-ethnic politician when surrounded by more voters from group A. For the presence of these group A members to affect the decision of this voter from group B, group A must be clearly identified in the voter's mind as part of the core constituency of an electorally viable party. This is most clearly the case when there is an electorally viable “ethnic party” associated with group A, even though such ethnic parties may have members and leaders from other ethnic groups.
Two Different Local Ethnic Geographies
Note: Group B voters are represented by circles, while Group A voters are represented by hollow triangles.

Local ethnic geography should also affect turnout, which can be illustrated by contrasting the incentives of this voter in panel (a) with those of an identical voter facing a more mixed local ethnic geography in panel (b). Members of groups A and B are roughly equally numerous in panel (b), and we again assume that there is a viable party associated with each group. By our logic, there is little difference in the expected benefit from the election of one party instead of the other for the voter, and hence little incentive to expend the effort to turn out to vote. By contrast, the B voter in the center of panel (a) has stronger incentives to turn out to vote (and to vote for the party associated with group A).
The strength of these relationships depends in part on the rules and political institutions that regulate state spending. Even where there are very few members of group A overall, as long as existing institutions create a greater expectation among voters of receiving targeted state spending from the election of the party of group A when there are more members of group A in a voter's area, the probability that a voter from group B supports the party of group A should be increasing in the prevalence of group A in the surrounding area.
Moreover, although rural and urban voters value and seek the same roads, market stalls, health facilities, and other goods, many of these club goods in rural areas are like public goods in urban areas. Paving a stretch of a minor road will benefit only the voters from near that road in a rural area, for example, but benefit urban voters who daily traverse the area from many distant parts of a city. The effective distance to a hospital or other facility is also shorter for an urban voter who has access to better transportation, so that this facility more easily serves a much larger population from a wider area. Although all voters prefer for these goods to be nearer, local ethnic geography has a much smaller impact on urban voters’ expectation of access to these goods under the election of different candidates because of the more public nature of these goods in urban areas. Local ethnic geography should therefore have little or no effect on vote choice for urban voters.
ETHNIC POLITICS IN GHANA
Although we lack measures of voter expectations, we can investigate the relationship between local ethnic demography and vote choice using uniquely detailed data from Ghana, an electorally competitive new democracy in sub-Saharan Africa. Recent Ghanaian elections have generally been free and fair, with no evidence of widespread violence or coercion.Footnote 8 Two political parties dominate Ghanaian politics—the National Democratic Congress (NDC) and the New Patriotic Party (NPP)—which traditionally draw strong support from different coalitions of ethnic groups, although the party leaders have not always been from the most prominent ethnic group in these coalitions.
The NPP (in power 2001–2009) is associated with the Akan, Ghana's largest ethnolinguistic group with 45% of the country's population, and particularly with the Ashanti subgroup. This strong association predates Ghana's current democratic period (1992–) to predecessor opposition parties led by Akan elites in the independence era. The NDC remains most closely associated with the Ewe ethnic group of its founder, former President Jerry Rawlings (in power 1981–2001), although the party was led from 2000 to 2012 by John Evans Atta Mills, who was a Fante (an Akan subgroup). Mills was elected president in 2008 in an election decided by less than 1% of the vote. The Ewe are concentrated most heavily in the Volta Region along the border with Togo, with 13% of the national population. Other groups, such as the Ga, based in the capital Accra, and those from northern Ghana, including the Dagomba and others comprising the “Mole-Dagbon” census category, are less closely affiliated with either party or are internally divided between the two parties. While there are status differences among ethnic groups, with southern groups and particularly the Akan being historically wealthier than the others, Ghana does not have a history of large-scale ethnic violence. Divisions between groups are not so hardened that members of different groups living in close proximity would not share access to the same local public services and facilities.
With its prominent ethnic cleavages in national electoral politics and ethnic favoritism by the government a concern for many citizens,Footnote 9 Ghana has been the site of several recent empirical studies on ethnic voting (Ferree et al. Reference Ferree, Gibson, Hoffman and Long2009; Hoffman and Long Reference Long and Gibson2012; Lindberg and Morrison Reference Lindberg and Morrison2008). Polling by Ferree et al. (Reference Ferree, Gibson, Hoffman and Long2009) shows that Ghanaian voters did not all express support for the party affiliated with their own ethnic group in the 2008 election, although the associations between each party and their traditional ethnic coalitions remained strong. In an exit poll conducted just after the 2008 election, Hoffman and Long (Reference Hoffman and Long2012) found that 67% of Akans supported the NPP presidential candidate, while 71% of Ewes supported the NDC candidate. Voters from other ethnic groups were more evenly divided between the parties.
The president is directly elected in a majoritarian run-off system in a single national constituency. All votes for president count equally across the entire country. These elections are held quadrennially and concurrently with elections to a 230-member parliament, with all members elected in single member districts. Parliament is weak and does not play a major policy-making role (Lindberg Reference Lindberg2010). Instead, the president and his appointees have broad, centralized control over state spending in Ghana, similar to many African countries in which control over resources is concentrated in the executive (van de Walle Reference van de Walle2003).
While the evidence is mixed for ethnic favoritism at the national level in the distribution of state spending and public goods (Banful Reference Banful2008; Franck and Rainer Reference Franck and Rainer2012), Lindberg (Reference Lindberg2003, Reference Lindberg2010) and Weghorst and Lindberg (Reference Weghorst and Lindberg2012) have found that Ghanaian voters demand patronage from politicians in the form of preferential spending on club goods for community and constituency development. In Ghana, local public goods such as roads and schools are delivered through a combination of direct allocations by national ministries and through formula-based district- and constituency-level allocations such as the District Assemblies Common Fund (DACF). Each district receives a population- and need-based level of funding through the DACF, but District Chief Executives (DCEs), who are appointed by the president and belong to the president's party, primarily determine how these funds are spent within the district. The president also directly appoints ruling party members to 30% of the seats in each of the District Assemblies, the local legislative bodies overseen by the DCEs. While locally elected Members of Parliament (MPs) have control over a small portion of the DACF funds in each district, the overwhelming majority of these funds are controlled by the president's appointees.
These features of the Ghanaian system have several implications for our analysis. First, because the national government maintains control over the distribution of most spending on local public goods, and voters understand that the outcome of the presidential election has significant consequences for the allocation of state resources at the local level, we focus on the presidential election. The same slate of presidential candidates is presented to voters everywhere, which allows us to fix candidate ethnicity and quality and separate these factors from local political dynamics. Furthermore, the District Assembly Common Fund (DACF) guarantees that some government spending on local public goods reaches all districts. Voters would expect whatever goods are distributed through the fixed allocations in each district to be more likely to go to areas within the district with more members of the groups associated with the president's political party, so that proximity to members of the group associated with the president's party should affect vote choice even in districts that have few members of that group.
PRESIDENTIAL ELECTION IN THE BRONG AHAFO REGION
Our first analysis examines results from Ghana's 2008 presidential elections from over 2000 polling stations in 22 parliamentary constituencies of the Brong Ahafo Region, one of ten administrative regions in Ghana.Footnote 10 We investigate how the vote share of the NPP, the party associated with Akans, varies with the presence of Akans in the local area around a polling station, after controlling for the ethnic composition of the population in the immediate vicinity of the polling station itself. Although we cannot infer individual-level voting behavior from analysis of this aggregated data, the results in this section establish patterns of ethnic voting across different local ethnic geographies that are borne out in the individual-level analysis in the next section.Footnote 11
While we would ideally have polling-station–level data for the entire country, the Brong Ahafo Region provides a good site to study the influence of local ethnic geography on the vote choice of rural voters for several reasons. First, the region's estimated average population density is 84 people per square kilometer, and we estimate that no 5-km × 5-km square area has more than 440 people per square kilometer. Second, it is ethnically diverse and lies between Ghana's two major economic regions, with the more prosperous, Akan areas to the south and a poorer, predominantly Muslim region to the north. As a result, Brong Ahafo contains a mix of ethnic groups from southern and northern Ghana, and the NPP and NDC are both politically competitive in this region. Fifty-eight percent of the region's 1.7 million inhabitants are Akan, with the NPP winning 15 constituencies and the NDC winning 9 constituencies in the 2008 general elections. The NDC and NPP presidential candidates each won more than 60% of the vote in only two constituencies in the region. We can thus focus on the relationship between support for the NPP (or the NDC) and the prevalence of Akans in the area around a polling station without potential complications from ceiling effects.
Polling-Station and Census Data
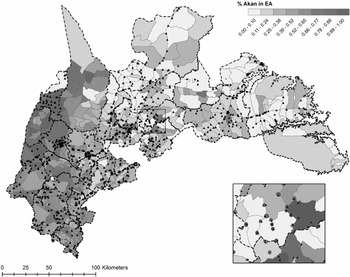
Using a combination of GPS coordinates, geographic data from the GNS gazetteer of place names, and digitized maps from the Land Survey Office in Accra,Footnote 12 we are able to locate 1635 polling stations within 631 localities/enumeration areas (EAs) from Ghana's 2000 Population and Housing Census.Footnote 13 We assume that the demographic characteristics for each polling station are captured by the census data from the EA in which each polling station falls, since voters must register and vote at the polling station nearest to their residence.Footnote 14 In more densely populated areas, multiple polling stations fall within a single EA. Where this is the case, we assume that all of these polling stations share the same demographic characteristics and other covariates. Figure 2 shows the location of each of these polling stations, with the thicker lines indicating constituency borders and thinner lines indicating EA boundaries. The shading indicates the population share of the Akan group in each EA.
Polling Stations in the Brong Ahafo Region
Notes: The triangles represent polling stations and the dark dashed lines are constituency boundaries. The shading represents the proportion Akan in each census enumeration area (EA) polygon for the entire Brong Ahafo Region. Note that the large polygons are often those with the lowest population, while the smaller circles and dots are towns. The inset shows in more detail how polling stations (triangles) are matched into the EA polygons from the census.

We also construct measures of the ethnic composition of the neighborhoods surrounding each polling station using the census data for the EAs surrounding the “home” EA of each polling station using seg in R (Hong and O'Sullivan Reference Hong and O'Sullivan2012). We measure the local ethnic geography of each polling station as the spatially weighted population share of group m around the polling station at point p. This is
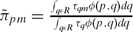 $\tilde{\pi }_{pm} = \frac{\int _{q\epsilon R} \tau _{qm} \phi (p,q) dq}{\int _{q\epsilon R} \tau _{q} \phi (p,q) dq}$
, where τ
q
is the population density at point q, τ
qm
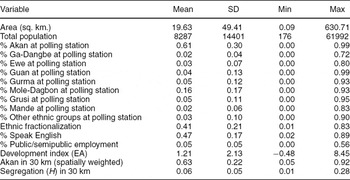
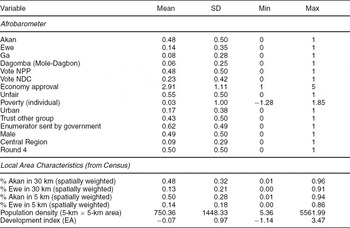
is the population density of group m at point q, dist(p,q) is the distance in kilometers from the home EA at point p to the centroid of a surrounding EA at point q, and EAs are weighted by the function φ(p, q) = [dist(p,q)+0.5]−1 (Reardon and O'Sullivan Reference Reardon and O'Sullivan2004). In the following analyses, we use measures that incorporate all information within a 30-km radius of the polling station's EA. Because the weights decay with distance from the home EA, our results are not very sensitive to changes in the size of this radius and are robust to measures based on 20- or 40-km radii instead (not shown). This process produces measures of population shares for each ethnic category in the census in the area around each polling station that are less dependent on arbitrary census or political boundaries. Summary statistics are reported in Table 1.
Summary Statistics for Enumeration Areas around Brong Ahafo Polling Stations

Note: n = 1633. Data sources described in the text.
Akan30km, the spatially weighted Akan share of the population in the 30-km around each polling station, varies sufficiently at different levels of the percentage of Akans at each polling station for our analysis. However, the NDC-associated Ewe ethnic group make up less than 20% of the population around most polling stations in the Brong Ahafo Region. Few polling stations are surrounded by roughly equal proportions of Akans and Ewes, ruling out an investigation of the relationship between local ethnic geography and turnout.Footnote 15
Polling-station–level Analysis
We examine how the NPP vote share in the first round of the 2008 presidential election at the polling-station-level varies with the spatially weighted population shares of the NPP-associated Akan around each polling station, controlling for the characteristics of the census EA in which each polling station falls.Footnote 16 We show that polling stations located in similar census EAs have different levels of support for the NPP when surrounded by different local ethnic geography in a pattern consistent with our theory.
We estimate variants of the following model
 \begin{eqnarray*}
y_{ij} = \alpha _{j} + \beta _1 Akan30km_{ij} + \beta _2 AkanPS_{ij} + \mathbf {X_{ij} \delta } + \epsilon _{ij},
\end{eqnarray*}
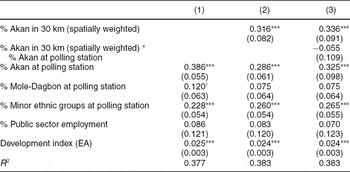
Local Ethnic Geography and NPP Vote Share in the 2008 Presidential Election

Notes: †Significant at p < 0.10; *p < 0.05; **p < 0.01; ***p<0.001. n = 1590. Weighted least squares with weights equal to total votes cast in the first round of the 2008 presidential election by polling station. All models include parliamentary constituency fixed effects (not shown). Standard errors in parentheses.
Column 1 shows that our estimate of the population share from the Akan group at each polling station is a strong predictor of NPP support, as would be expected by the existing literature on ethnic politics in Ghana. In column 2, however, we show that, consistent with our theory, NPP vote share is increasing in the spatially weighted population share of Akans in the area surrounding a polling station, even after controlling for each polling station's own ethnic composition. With values for all other variables held at their medians, a one standard deviation increase in the spatially weighted population share of Akans beyond a polling station (about 0.21) results in a predicted 6.9 percentage point greater NPP presidential vote share (95% CI: [5.7, 10.6]).Footnote 19
Moreover, this predicted difference in NPP vote share differs little for polling stations with high and low population shares of Akans. Using the interaction model in column 3 with values for all other variables held at their medians, a one standard deviation increase in the spatially weighted share of Akans around a polling station predicts a 7.2 percentage point increase in NPP vote share (95% CI: [6.0, 10.5]) for a polling station that is 20% Akan. For a polling station that is 50% Akan, the predicted difference in NPP vote share is 6.8 percentage points (95% CI: [5.7, 10.0]), and for a polling station that is 80% Akan, the predicted difference is 6.4 percentage points (95% CI: [5.1, 10.4]).
These results are consistent with an account of non-Akan voters being more likely to support the NPP with the greater presence of Akans in the surrounding area, but we must be cautious in inferring individual-level behavior from ecological data. We examine this question of which voters are more likely to support the NPP in different local ethnic geography in the next section.
AFROBAROMETER: INDIVIDUAL-LEVEL ANALYSIS
We extend the analysis by examining the relationship between local ethnic geography and vote choice at the individual level using the 2005 and 2008 rounds of the nationally representative Afrobarometer survey in Ghana.Footnote 20 In order to move from polling-station–level data to individual-level data, we must also move from actual election results to survey respondents’ self-reports of intended support for a particular candidate. However, the Afrobarometer includes other questions that allow us to investigate alternative interpretations of our results. Our findings from this survey data analysis support our theory and are consistent with our earlier analysis of actual polling-station–level results from the Brong Ahafo Region.
We use these two most recent survey rounds because they asked respondents which political party's candidate they would support if the presidential election were held “tomorrow.”Footnote 21 Fifty-one percent of respondents in the 2005 survey (Round 3) and 46% in the 2008 survey (Round 4) said they would support the incumbent NPP government in this hypothetical presidential election. Support for the opposition NDC was 22% in the 2005 survey and 23% in the 2008 survey, although the NDC ultimately won the December 2008 presidential election with 47% in the first round and 50% in the second round. There is likely underreporting of NDC support in both surveys, possibly due to fear of identifying oneself as an opposition party supporter.Footnote 22 However, as we elaborate in the next section, whether a respondent (mistakenly) believes that the survey enumerator was sent by the government, and thus may underreport support for the opposition, is not statistically related to our local ethnic geography variable. Therefore, we are reasonably confident in our estimates of the relationship between local ethnic geography and political support.Footnote 23
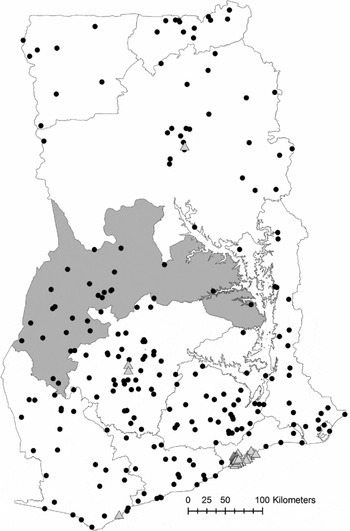
We use the enumeration area (EA) identifiers from the Afrobarometer sample frame to geo-reference and calculate local ethnic geography measures for each of the 2397 respondents, as we did for the polling stations in the Brong Ahafo Region. We also calculate the population density in a 5-km × 5-km square around each EA centroid and use a population density cutoff of 1000 people per square kilometer to distinguish between urban and rural respondents.Footnote 24 Figure 3 displays the location of our sample of Afrobarometer respondents from both survey rounds on a map of Ghana. Rural respondents are represented by circles and urban respondents are represented by triangles. Because the Afrobarometer uses stratified cluster sampling, a single point in Figure 3 represents eight or more respondents sampled from the same census EA. In our analysis below we drop respondents from Kumasi, Ghana's second largest city, because detailed EA-level census data were not available. Summary statistics for the remaining 2287 respondents are reported in Table 3.
Summary Statistics for Individual-Level Analysis

Notes: All Afrobarometer variable are binary, except for Economy Approval (1 to 5) and Poverty. Data sources described in the text. n = 2287, except for “Trust other group,” which is Round 3 only (n = 1108).
Locations of Round 3 and 4 Afrobarometer Respondents
Notes: The Brong Ahafo Region is the shaded region in the middle of the country. Clusters of rural respondents are represented by circles; clusters of urban respondents are triangles.

We focus on vote choice.Footnote 25 We estimate a series of logistic regressions with reported support for the NPP or NDC candidate as the outcome and the spatially weighted population shares of the Akan and Ewe ethnic groups in a 30-km-radius area around the respondent as the main explanatory variables. For rural areas, we expect the probability of supporting the NPP to be increasing (decreasing) in the population share of Akans (Ewes) surrounding a voter. We expect the opposite relationships when the outcome is support for the NDC associated with the Ewes and predict no such relationships for urban areas. These models take the form
 \begin{eqnarray*}
Pr(y_{ij} | G30km_{ij}, \mathbf {X_{ij}}) &=& logit^{-1}\big ( \alpha + \beta G30km_{ij} + \mathbf {X_{ij}} \gamma \big ),
\end{eqnarray*}
The Akan ethnic group comprises smaller subgroups speaking closely related languages. The largest subgroups include the Ashanti and Akyem, which are linked to the NPP, but also the Fante subgroup, to which the NDC presidential candidate for 2000, 2004, and 2008 belonged. Although disaggregated census data at the subgroup level is not available and the Afrobarometer aggregates responses to the category Akan, we know that the NDC-associated Fante make up the majority of Akans in the Central Region.Footnote 27 Therefore, we include an indicator variable for Central Region (CentralRegionj ) and its interaction with Akan30kmij . This allows us to estimate a different relationship between Akan30km and vote choice in Central Region than elsewhere and to account for heterogeneity in the partisan affiliations of the Akan subgroups.
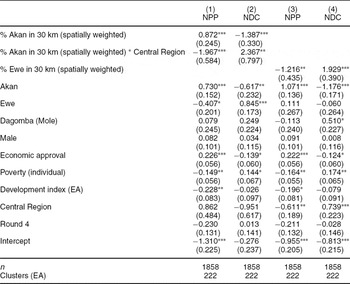
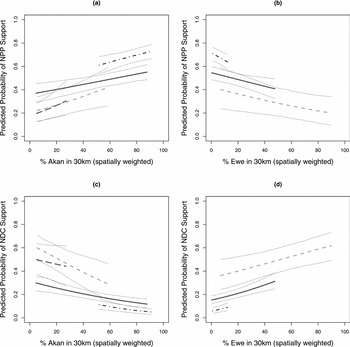
Because the local ethnic geography variables cover a much smaller range of values for urban respondents than rural respondents, we estimate these models separately for rural and urban respondents. Table 4 presents logistic regression coefficients for each of the models for our rural sample. All four models show statistically significant relationships between the spatially weighted population shares of the Akan and Ewe in the surrounding area and NPP and NDC support in directions supportive of our argument. To interpret these coefficients, Figure 4 plots predicted probabilities of support for each party against changes in the value of Akan30km and Ewe30km using models from Table 4. The solid line in each panel is the predicted probability of support for each party with 95% confidence intervals as the local ethnic geography variable on the x axis moves from the 10th to 90th percentile of its distribution.Footnote 28 In all four panels, the predicted probability of supporting each party changes in directions consistent with voters becoming more likely to support a party when surrounded by more members of the ethnic group affiliated with that party.
Local Ethnic Geography and Individual-Level Party Support: Rural

Notes: * p < 0.05, ** p < 0.01, *** p < 0.001. Logistic regression coefficients with standard errors clustered at EA level in parentheses. Outcome in columns 1 and 3 is support for NPP; outcome in columns 2 and 4 is support for NDC. Data are from Rounds 3 and 4 of the Ghana Afrobarometer, excluding respondents from local areas estimated to have more than 1000 people per sq. km.
Predicted Probabilities, Party Support and Local Ethnic Geography
Notes: Each of the four panels shows changes in the predicted probability of support for the NPP or NDC as the population share from each party's affiliated ethnic group around a hypothetical Afrobarometer respondent changes along the x axis. The predicted probabilities and 95% confidence intervals are calculated from 1000 simulations for four different subsets of the data: (1) the solid line is for the whole sample; (2) the short-dashed line is for Ewe respondents only; (3) the long-dashed line is for Dagomba respondents only; (4) the dot-dashed line is for Akan respondents only. The range of each line is restricted to the 10th to 90th percentiles of each sample's distribution of the variable along the x axis.

We also estimate these logistic regression models on subsets of the data, restricting the sample to respondents from each of the three ethnic groups for which we have sufficiently large sample sizes: the Akan, the Ewe, and the Dagomba (roughly equivalent to the Mole-Dagbon category on the census). Predicted probability estimates for each of these subsets are also shown in Figure 4 with 95% confidence intervals, with the dot-dashed line corresponding to the Akan subsample, the short-dashed line corresponding to the Ewe subsample, and the long-dashed line corresponding to the Dagomba subsample. The range of each line again corresponds to the 10th to 90th percentile of the distribution of the x-axis variable in each subsample. The panels on the right-hand side of Figure 4 exclude the Dagomba subsample because the population share of Ewes around Dagomba respondents is effectively 0 for all of these respondents.
These predicted probabilities of NPP and NDC support for each ethnic group in Figure 4 are generally consistent with our argument. This is clearest for the Ewe (short-dashed line), who have the most variation in the local ethnic geography variables. Ewe support for “their” party, the NDC, drops as the share of Akans in the surrounding area rises. In turn, Ewe support for the Akan-associated NPP increases. The opposite holds for the NDC, with Ewe respondents becoming much more likely to support the NDC when surrounded by more Ewes and less likely when surrounded by Akans. The results are less dramatic for Akans, however. For an Akan respondent (dot-dashed line), the probability of supporting the NPP or NDC does not change greatly with the presence of Akans in the surrounding area. Most Akan respondents in the Afrobarometer already live in areas where there are large numbers of Akans, and small changes in the number of Akans around a respondent may not significantly change the ethnic profile of the surrounding area. Nevertheless, the probability of an Akan respondent supporting the NPP or NDC changes substantially with the number of Ewes in his surrounding area (right-hand side of Figure 4).
The effect of local ethnic geography on vote choice is as substantial as the influence of evaluations of economic performance, central to models of retrospective performance voting (Bratton et al. Reference Bratton, Bhavani and Chen2011; Posner and Simon Reference Posner and Simon2002). Using the model for the overall sample of respondents (column 1 in Table 4) we simulate the predicted change in the probability a hypothetical respondent with the sample mean value of Akan30km supports the presidential candidate from the incumbent NPP as his evaluation of economic performance compared to one year before (EconomicApproval) moves from “worse” to “better” (the interquartile range of this variable). We estimate that such a respondent would be 11.3 percentage points [95% CI: (5.66, 16.6)] more likely to support the NPP candidate when holding a positive opinion of current economic performance as compared with holding a negative opinion. By comparison, if we fix the hypothetical respondent's opinion about the economy and instead change the proportion of Akans in the surrounding area (Akan30km) from its 25th to 75th percentile in the sample, we estimate that the respondent will become 15.2 percentage points [95% CI: (6.25, 23.75)] more likely to support the NPP candidate, a larger change than that brought about by the better evaluation of economic performance.
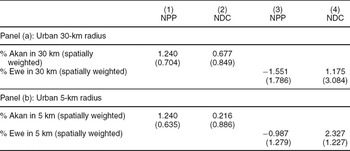
We find no relationship between local ethnic geography and support for either party for our urban respondents (Table 5, panel (a)).Footnote 29 Predicted probability plots for urban respondents similar to those in Figure 4 show no clear relationship between local ethnic geography and vote choice in these urban areas (not shown). This null result for urban respondents is consistent with our argument that local ethnic geography should have a much smaller or no effect in urban areas because goods that have a club nature in rural areas are more like public goods in urban areas. Furthermore, as we discuss in the next section, this result is inconsistent with several alternative explanations for our results.
Local Ethnic Geography and Individual-Level Party Support: Urban

Notes: * p < 0.05, ** p < 0.01, *** p < 0.001. n = 387 in 39 clusters for urban respondents (areas estimated to have more than 1000 people per square kilometer). Logistic regression coefficients with standard errors clustered at EA level in parentheses. Outcome in columns 1 and 3 is support for NPP; outcome in columns 2 and 4 is support for NDC. Data are from Rounds 3 and 4 of the Ghana Afrobarometer. Control variables not shown; see Supplemental Materials for the full tables. Panel (a) measures local ethnic geography for a radius of 30 km; Panel (b) uses a 5-km radius instead.
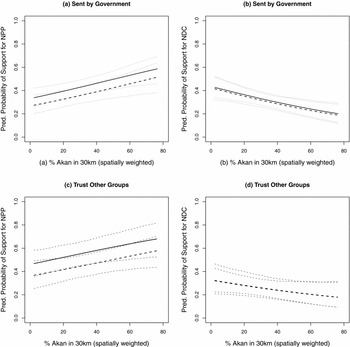
Finally, we use additional data from the Afrobarometer to examine two possible sources of bias which could compromise our estimates of the overall relationship between local ethnic geography and vote choice in rural areas. First, as we noted earlier, around 67% of rural respondents in both surveys reported that they believed the survey enumerators were sent by the (NPP) government (EnumeratorGov), although responses to this question do not vary systematically with the respondent's ethnicity or the prevalence of Akans or Ewes in the surrounding area (not shown). We re-estimate models 1 and 2 in Table 4 with only non-Akans respondents using EnumeratorGov and interacting this variable with our local ethnic geography variables and with the Central Region indicator variable (not shown). Figure 5 plots the predicted probability of support for the NPP in panel (a) and for the NDC in panel (b) for non-Akan respondents with all other variables held at their medians, with their 95% confidence intervals. The predicted probability of expressing support for the NPP is greater for those respondents who say that the enumerator was sent by the government (solid line), but within the 95% confidence interval for respondents who did not say that the enumerator was sent by the government (dashed line). The predicted probability of support for the NDC is not different across these two groups. Moreover, the overall relationships between Akan30km and support for the two parties are unaffected by this variable.
Predicted Probabilities, Party Support and Local Ethnic Geography, Controlling for Belief about Enumerator and for Trust in Other Ethnic Groups
Notes: Each panel shows changes in the predicted probability of support for the NPP or NDC as the spatially weighted population share of Akans around a hypothetical non-Akan Afrobarometer respondent changes along the x axis. The predicted probabilities and 95% confidence intervals are calculated from 1000 simulations for two different subsets of the data. In panels (a) and (b), the solid line is for a respondent who believes that the enumerator was sent by the (NPP) government and the dashed line is for a respondent who believes otherwise. In panels (c) and (d), the solid line is for a respondent who trusts Ghanaians from other ethnic groups and the dashed line is for a respondent who does not.

Second, settlement patterns of ethnic groups could be endogenous to the political outcomes we observe. An extreme version of this endogeneity would occur if, for example, non-Akan voters who support the NPP move into NPP strongholds to live closer to co-partisans. However, we have found no evidence suggesting that partisanship is a factor in settlement patterns. A more plausible source of confounding may be that non-Akan voters who choose to live in Akan areas have different pre-existing attitudes towards the Akan ethnic group than similar voters who live elsewhere, and that this attitude also affects their willingness to vote for the party associated with the Akan.
We use the Afrobarometer question on trust in other ethnic groups to examine the possibility of this type of sorting.Footnote 30 We re-estimate our model for only non-Akan respondents, including other-group trust (Trust) and its interaction with the local geography variable and the Central Region indicator (not shown). Figure 5 plots the predicted probability of support for the NPP in panel (c) and for the NDC in panel (d) for non-Akan respondents, with all variables other than local ethnic geography held at their medians, with their 95% confidence intervals. The predicted probability of expressing support for the NPP is greater for those respondents who say they trust Ghanaians of other ethnic groups (solid line), but within the 95% confidence interval for respondents who do not trust other ethnic groups (dashed line). The predicted probability of support for the NDC is not different across these two groups. Controlling for trust in other ethnic groups, the relationships between Akan30km and support for the two parties remain as in the original analysis.
ALTERNATIVE MECHANISMS
While our analyses in the previous sections support our theory of how local ethnic geography affects vote choice, we cannot directly observe the mechanism underlying this relationship. Local ethnic geography may affect vote choice through social interactions that change a voter's attachment to his own group, his intergroup attitudes, or his world view, rather than through his expectations of benefiting from local public goods as we propose. Another possibility is that local ethnic geography affects how likely members of one group are to use violence against or intimidate members of another group to change their vote. We elaborate on these possible mechanisms, and while we cannot definitively rule out these alternative explanations for our results, we find little support for them in additional analyses.
The first alternative mechanism focuses on differences in attitudes and intergroup interactions across local ethnic geographies. The literature on contact theory in social psychology (Allport Reference Allport1954) suggests that living as an ethnic minority in close proximity to members of a more prominent ethnic group may have a socializing effect that improves a voter's attitude towards the locally dominant group and increases the probability that the voter would consider supporting candidates representing that group. If non-Akan voters living closer to greater numbers of Akans develop similar attitudes as or more positive attitudes towards Akans and display greater trust in other groups, they may become more likely to support Akan-affiliated NPP politicians even without changes in their expectations of benefitting from targeted state spending by those politicians.
Such socialization may occur through family connections from interethnic marriages. Although the Afrobarometer does not ask questions about marriage or family, we can use the Ghana Living Standards Survey (GLSS, Round 5)—a nationally representative survey of 8687 households in Ghana conducted in 2005–6 by the Ghana Statistical Service—to measure the pervasiveness of interethnic marriages and multiethnic households in Ghana across different local ethnic geographies.Footnote 31 These data show that interethnic marriage is very rare in Ghana overall. Only 6% of Ghanaian households contain an interethnic marriage and only 9% of Ghanaians share a home with a member of another ethnic group, regardless of marital status. More importantly, the interethnic marriage rate does not systematically vary with our main explanatory variables (Akan30km, Ewe30km) in rural areas, even among non-Akans, casting doubt on this alternative explanation for our findings. In addition, interethnic marriage is more common in urban areas; 14% of urban marriages involve members of two groups, compared to 7.3% of marriages in rural areas. This suggests that the relationship between local ethnic geography and vote choice should be stronger in urban areas if our finding is due to socialization through family ties, but we find no effect of local ethnic geography on vote choice in urban areas.
Another possible mechanism is that even without such strong ties as marriage, interethnic interactions may lead to a convergence of world views, which in turn affects vote choice. This is unlikely to account for our results for rural respondents because the political parties in Ghana compete on providing “development” rather than distinct ideologies or world views. Additional Afrobarometer analyses also do not support this alternative explanation. We examine responses to the Afrobarometer question which best captures a key dimension of political ideology—the extent to which respondents favor government intervention in society over individual responsibility. Rural Akan respondents are more likely than rural non-Akan respondents to agree with the statement that “people should look after themselves and be responsible for their own success in life,” instead of the statement “the government should bear the main responsibility for the wellbeing of people.” However, non-Akan respondents, aside from Ewes, are not more likely to agree with the first statement when they are surrounded by more Akans. In addition, non-Akans, including Ewes, who agree with the first statement are no more likely to vote for the NPP than those who disagree. Controlling for ideological views with this item does not change the estimated overall relationship between local ethnic geography and vote choice (not shown).
Where politics revolves around ethnicity rather than ideology, local ethnic geography may affect vote choice through more general trust for members of other groups, rather than through beliefs about the role of government. Using the Trust variable from the previous section and now treating this as post- rather than pretreatment, we check the first stage of this socialization argument for our rural respondents. We find no consistent pattern in the share of non-Akans who say they trust Ghanaians of other ethnic groups by quartile of Akan30km or in the share of non-Ewes who say the same by quartile of Ewe30km (not shown). We also run logistic regressions for non-Akan respondents using the same models and subsets of the data from Table 4 and Figure 4 with other-group trust instead of vote choice as the outcome (not shown), both with and without controlling for trust in members of one's own ethnic group.Footnote 32 These regressions suggest no clear relationship between local ethnic geography and other-group trust.Footnote 33
Alternatively, a voter may feel a weaker attachment to his own co-ethnics when he is surrounded by more non-co-ethnics and become less likely to vote expressively for his own group. But a large literature from political science and social anthropology on ethnicity in Africa suggests that attachments to one's own ethnic identity have been strengthened, not reduced, by contact with other groups (Bates Reference Bates, Rothchild and Olorunsola1983; Cohen Reference Cohen1969; Mitchell Reference Mitchell1956; Posner Reference Posner2005; Schildkrout Reference Schildkrout1976). If living among other ethnic groups weakens respondents’ attachments to their own identities, we would expect a relationship between local ethnic geography and vote choice in urban areas as much as in rural areas. But our analysis in the previous section found no effect in urban areas.
Because of population density, urban respondents need not travel as far to markets and access services, and a greater proportion of urban respondents’ interactions may be with the people nearer to them than those of rural respondents. Therefore, it may be more appropriate to investigate this and other socialization mechanisms for urban respondents with local ethnic geography calculated for a smaller radius. Table 5, panel (b), reports our analysis of urban respondents using measures of local ethnic geography in the 5-km radius area around each respondent instead of 30 km. Still we find no relationship between these variables and vote choice, failing to support these socialization arguments.
The second alternative mechanism is violence or intimidation. One possibility is that members of an ethnic group that forms a majority in a local area might pressure members of a local minority group into supporting the majority group's political party. While we cannot rule out this mechanism explicitly, we have no reports of systematic intimidation of voters in the 2008 elections. Moreover, intimidation by a local majority group cannot account for the positive relationship in the Afrobarometer data between support for the NPP and the population share of Akans in the surrounding area where Akans are in the minority.Footnote 34 We also re-estimate the regression from Table 2, column 2, with the Brong Ahafo polling station results using a multilevel model that allows for a different coefficient on Akan30km for each parliamentary constituency (Gelman and Hill Reference Gelman and Hill2007). The marginal effect of Akan30km on NPP vote share is positive and statistically significant even in constituencies where less than 30% of the total population is Akan (not shown). It is implausible that minority Akans in these areas are intimidating voters from local majority groups into supporting the NPP.Footnote 35
Another possibility is that settlers are vulnerable to pressure from autochthons (or indigenes) on whose general approval they may depend for their security and livelihoods. Although many parts of Ghana suffer from autochthon-settler tensions and conflicts, these conflicts are generally between subgroups within the same census category and are thus unlikely to account for our findings. In northern Ghana, for example, the Bawku and Yendi conflicts are both between Mole-Dagbon subgroups, and the Konkomba-Bimoba conflict is between two groups in the Gurma category. In the cocoa-growing southern parts of Ghana, including large parts of Brong Ahafo Region, the “strangers” are generally Akans who bought their land outright from chiefs of other Akan subgroups over the last 120 years to establish cocoa farms in unsettled forest areas (Hill Reference Hill1963). Brong Ahafo has significant numbers of migrants from northern Ghana (Abdul-Korah Reference Abdul-Korah2007), but also autochthons of Guan and other ethnic groups generally identified with the north who are commercial and subsistence farmers in the savannah areas. There are increasing tensions between farmers and Fulani herders whose livestock sometimes damage crops in these areas (Tonah Reference Tonah2006), but Fulanis, who are found across West Africa, are generally considered non-Ghanaian and are not closely affiliated with either political party. Therefore, our results cannot be explained by this cleavage.
Finally, our results may be due to different patterns of political party organization and activity in different local ethnic geographies. For example, the NPP may have more local party activists in areas where there are more Akans and thus carry out greater mobilization efforts in these areas, resulting in greater NPP support at a particular polling station. In addition, if NPP candidates focus their campaign efforts on areas with more Akans, voters in areas surrounded by more Akans may be more likely to receive information and campaign messages. The same could hold for the Ewe and NDC. We do not see this mechanism as necessarily distinct from our own, however. The content of these campaign messages likely reinforces the logic underlying theories of instrumental ethnic voting, because politicians campaign by making promises of targeted distribution and delivering patronage to voters (Lindberg Reference Lindberg2003). Party activity may be one way through which local ethnic geography affects voter expectations about targeted state spending.
CONCLUSION
We proposed that local ethnic geography affects voter behavior by modifying the information conveyed by a politician or party's ethnic profile to a voter about the politician's future performance in office. Because voters expect that politicians in office will favor their supporters in rural areas with benefits that are not locally excludable, the ethnic composition of the area around a rural voter affects his prospective assessment of the probability of receiving targeted goods following the election of a particular politician or party. By examining the influence of local ethnic geography, our theory builds upon and extends existing research on instrumental ethnic voting that focuses on district- or other macro-level ethnic demography or the correspondence between the ethnicity of a voter and the ethnic profile of a candidate or party.
With fine-grained geocoded census data, we constructed new measures of local ethnic geography in Ghana to test this theory. Although the distribution of the data did not allow us to examine our turnout hypotheses, statistical analyses of polling-station–level results from the 2008 presidential election and individual-level Afrobarometer survey data from Ghana consistently supported our hypotheses on vote choice. These results help explain variation in ethnic voting in African democracies, where ethnicity is often a significant but imperfect predictor of vote choice.
This model of voter behavior also suggests that local ethnic geography affects the strategies that politicians use to interact with voters. As a result, the development of partisan identification and accountability relationships between voters and local politicians should also vary across ethnic contexts. Local ethnic geography also likely affects individual participation in local ethnic violence and the incidence of communal violence over access to local political power or resources that vary in the extent to which they are locally excludable. Theoretical consideration of the influence of local ethnic geography in the calculations of local politicians and empirical investigation of how these outcomes differ across communities and geographical contexts could advance research in these areas.
Our theory of voter behavior is also not limited to sub-Saharan Africa. Even where ethnicity is not highly salient in electoral politics, we expect the local density of people with other salient identity or partisan markers to affect voter behavior if voters expect politicians to target local public goods and other locally nonexcludable benefits to geographic areas identified with particular groups. The relevant local geography may be that of supporters of different political parties or poor voters in Latin America or of different religious groups or castes in South Asian democracies. Future research can explore the influence of local ethnic geography and other contextual factors on voter behavior and the interaction between politicians and voters in other developing countries.




Comments
No Comments have been published for this article.