Political scientists have developed regression-based statistical models to predict the outcome of elections in a large number of established democracies (Lewis-Beck Reference Lewis-Beck2005). Such models focus on a limited number of “fundamental” variables that structure election outcomes. The variables that are used to estimate such models vary quite a bit, though they generally include indicators of the state of public opinion or government approval at the outset of the campaign and indicators of the state of the economy (Campbell Reference Campbell2005; Lewis-Beck Reference Lewis-Beck2005). In contrast to election campaign polls, that also offer predictions of the election outcome, such structural forecasting models generally have a sizeable lead time. Most structural forecasting models offer an estimate of the predicted election outcome before the start of the election campaign. Despite this lead time, structural election forecasting models on average perform remarkably well (Lewis-Beck Reference Lewis-Beck2005; Campbell Reference Campbell2012).
The accuracy of predictions of structural forecasting models would seem to question the literature on campaign effects. If election outcomes can be predicted fairly accurately before the campaign has even started, campaigns do not appear to matter. But that impression is false. Campaigns still matter, in subtle and not-so-subtle ways. Simply assuming that campaigns have “minimal effects” does not mesh with the fact that vote intention polls vary strongly during the campaign, and in meaningful ways (Gelman and King Reference Gelman and King1993). An alternative explanation of the high level of predictability of structural models, that several scholars favor, is that fundamentals structure voters' behavior and that election campaigns help to “enlighten” and inform voters of those fundamentals (Gelman and King Reference Gelman and King1993; Bélanger and Soroka Reference Bélanger and Soroka2012; Wlezien and Erikson Reference Wlezien and Erikson2012).
A number of trends in voting behavior and campaign practices suggest that campaigns nowadays matter more than they did in the past. As a result, there are good reasons to question the continued importance of the “fundamentals”. Models that are based on such fundamentals may, in fact, be more error-prone today. Thus, we empirically examine the expectation that prediction errors of structural forecasting models have grown larger over time. To do so, we apply a straightforward structural forecasting model, that includes a political and an economic indicator, to data from six established democracies. We then trace the predictive power of this forecasting model over time. Surprisingly, our results do not give the slightest indication of a decline of the predictive power of structural forecasting models. As such, our work goes against the notion that voting behavior is increasingly “short-term”, while offering strong evidence of the continued importance of the fundamentals for predicting and explaining elections.
1. Do campaigns matter more than in the past?
First, students of voting behavior have drawn attention to a shift in weight of different factors that influence voters' choices. It has been argued that “anchor factors” are becoming less important (Costa Lobo Reference Costa Lobo2006; Walczak et al. Reference Walczak, van der Brug and de Vries2012). The case for the decline of long-term factors has many entries; scholars have argued that partisanship is in decline (Dalton and Wattenberg Reference Dalton and Wattenberg2002)Footnote 1, and there is strong evidence that cleavages such as religion (Knutsen Reference Knutsen2004) and social class (Evans and Tilley Reference Evans and Tilley2012) are shaping voters' choices less now than was the case some decades ago (Lipset and Rokkan Reference Lipset and Rokkan1967).
The decline of long-term factors is affecting voters' behavior.Footnote 2 This is clear from the fact that electoral behavior has become more volatile, with increasingly large groups of voters switching their preferences during the election campaign and from one election to another (Dalton and Wattenberg Reference Dalton and Wattenberg2002; Dassonneville Reference Dassonneville2013). At the same time, voters appear to make their vote choice increasingly late (Box-Steffensmeier et al. Reference Box-Steffensmeier, Dillard, Kimball and Massengill2015; Schmitt-Beck and Partheymüller Reference Schmitt-Beck and Partheymüller2015). Late-deciding voters are known to be more influenced by what happens during the campaign (Fournier et al. Reference Fournier, Nadeau, Blais, Gidengil and Nevitte2004; Johann et al. Reference Johann, Kleinen-von, Kritzinger and Thomas2018). As a result, trends as these make it plausible that campaigns matter more now than they did in the past.
Second, changes in campaign practices and in the media environment have potentially strengthened the impact of election campaigns. Political parties nowadays make intensive use of sophisticated techniques to persuade voters. Marketing professionals are employed by political parties to brand and sell the parties' platforms (Lees-Marshment Reference Lees-Marshment2014). In addition, technological changes allow parties to contact voters in a more targeted and personalized way (Hersh Reference Hersh2015; Kreiss Reference Kreiss2016).
Both patterns of change in voters' behavior and changes in campaign practices give credence to the expectation that structural forecasting models, that predict the election outcome months out, and that rely on national-level indicators, are performing less well now than they did in the past. Our expectation is therefore that prediction errors of structural forecasting models have grown larger over time.
2. A parsimonious forecasting model
For testing our hypothesis, we develop a fundamentals model, apply it to electoral data, and trace its performance over time. Because the claims of changes in voters' behavior apply to most established democracies, and because we do not want our results to be driven by a single case, we apply the model to as many advanced democracies as possible.
We opt for a parsimonious forecasting model, that follows standard practice in the field and model the incumbent vote as a function of a political and an economic variable (Lewis-Beck Reference Lewis-Beck2005):

We thus focus on predicting the vote of the incumbent, and model it as a function, first, of the economy. The theory guiding our “fundamentals model” is therefore the economic voting theory, which serves as the theoretical foundation for most structural forecasting models (Lewis-Beck Reference Lewis-Beck2005). Because our goal is to apply a similar parsimonious model to predicting the incumbent vote in different countries, we include GDP growth as the economic variable. After all, GDP growth has been referred to as the most “global” economic indicator (Norpoth et al. Reference Norpoth, Lewis-Beck and Lafay1991).
Our second indicator is a political one and captures citizens' general appreciation of the incumbent government before the start of the election campaign (Campbell Reference Campbell2005). Forecasters regularly rely on measures of public approval of the President's job (Campbell Reference Campbell2005) or government approval (Lewis-Beck et al. Reference Lewis-Beck, Nadeau and Bélanger2004) to capture this sentiment. However, only a handful of countries have long time-series of government or presidential job approval data. As an alternative, we rely on vote intention data, for the incumbent, measured three months before the election. Such a measure reflects “the public's general impressions of the in-party and its opposition on a wide range of issues (from war to the economy)” (Campbell Reference Campbell2005, p. 74).
Using vote intention data as the political variable and GDP growth as our economic indicator, our fundamentals model takes the following form:

where V is the incumbent vote share, VI is the vote intention for the incumbent, GDP is the GDP growth rate, and ε is an error term.
3. Data, operationalization and methods
For six established democracies, we have vote intention data since at least the early 1950s, and these countries therefore constitute our sample. We apply the model to forecast 114 elections held between 1955 and 2017 in six countries: Australia (1958–2016), Canada (1957–2015), Denmark (1960–2015), Germany (1957–2017), the UK (1957–2017) and the USA (1956–2016). These countries are established democracies and also present some institutional variety. Our focus is on legislative elections, except for the USA, where we apply the model to presidential elections.
Our sampling period covers more than six decades, a time span during which changes in parties' and voters' behaviors may have increased the importance of campaigns and rendered electoral results less predictable. Since we are primarily interested in the overall trend, we merged the data for the six countries to form a balanced survey pool.Footnote 3
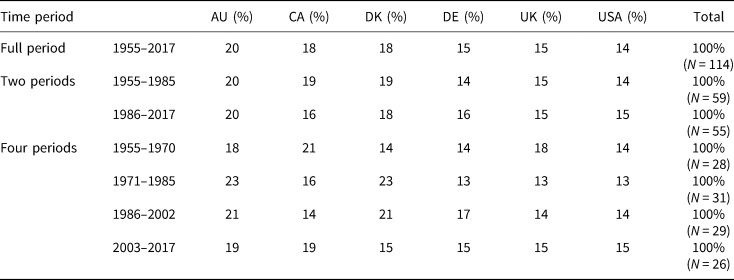
The entries in Table 1 highlight a number of interesting features of our dataset. First, the data include a sufficient number of elections (114 in total) to compare the performance of our forecasting model for meaningful sub-periods. These sub-periods, regardless of whether we define two or four sub-periods, are characterized by the good balance of their composition. That is, single countries never represent less than 13 percent and never more than 23 percent of the sample. Second, as the entries (columns by country) in Table 1 show, the distribution of elections among countries remains quite stable over time. This means that a change in performance of our forecasting model cannot be attributed to changes in the composition of our sample over time.
Distribution of national elections over time

The dependent variable measures the level of support garnered by all the members of the incumbent coalition. The coalition can consist of single party governments or administrations (USA, Canada and, with one exception, Great Britain), it can include quasi-permanent coalitions (like the Alliance and CDU/CSU partnerships in Australia and Germany) or larger and changing coalitions (like in Denmark and Germany). Details about the definition of the dependent variables are provided in Appendix A.
Vote intentions are measured three months before the elections (sources are reported in Appendix A). This implies that our model predicts the election outcome with information that is available before the start of formal electoral campaigns (or the post-Labor Day stretch for the USA) in virtually all cases. If campaigns indeed matter more now than in the past for voters' choices, models that rely on such a long lead time should perform less well now.
Finally, information on GDP growth was obtained from the OECD. Following common practice, we lag the GDP growth rate three months.Footnote 4 The three-month lead time is conventional (Nadeau et al. Reference Nadeau, Lewis-Beck and Bélanger2009).
We use OLS to estimate Equation 2 on the pooled dataset. To account for the nested structure of the data, with different elections by country, we include country fixed effects, and we cluster the standard errors by country. In addition, the data are weighted to ensure that the results are not overly driven by countries (like Australia) holding more frequent elections.Footnote 5
After estimating this model, we evaluate its predictive power and how this evolves over time. In the first step, we evaluate the MAE (mean average error) statistics of the model, and do so for different time periods. We then analyze the prediction errors in a more systematic way by saving the prediction errors that the model produces. We plot and visually inspect the absolute prediction errors and also use them as the dependent variable in a regression model in which the main independent variable is time.
4. Results
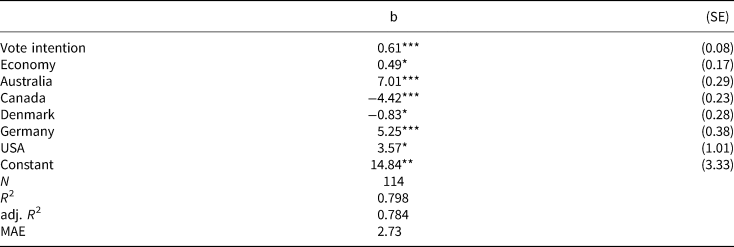
Table 2 summarizes the results of our main model, that is estimated by means of OLS on the pooled dataset. The overall performance of the model is good, with an R 2 of 0.80 and an average forecasting error of 2.74 percentage points. The variables that are of substantive interest—vote intentions and GDP growth rate—are both correctly signed and significant. The effect of GDP growth is 0.48, indicating that all else equal, a one-point increase of economic growth (three months prior to the election) yields an incumbent vote share that is about half a point higher.
Linear regression models for incumbent vote share in Australia, Canada, Denmark, Germany, the UK and the USA (1955–2017)

Notes: Entries are unstandardized regression coefficients with standard errors in parentheses (clustered by country). The data are weighted to account for the under- and overrepresentation of countries in the dataset. For country dummy variables, the UK is the reference category. Significance level: *p < 0.05, **p < 0.01, ***p < 0.001 (two-tailed tests).
The results that are reported in Table 2 are encouraging and show that it is possible to develop a general and parsimonious model that predicts elections in different countries quite accurately.
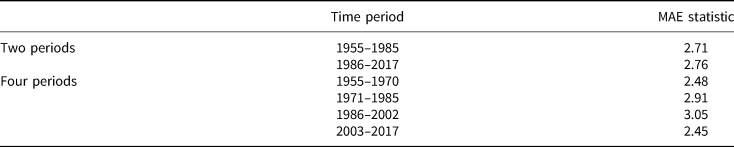
A first way to assess whether prediction errors of structural forecasting models have grown larger over time is to look at the MAE statistic and to break the statistic down for different time periods. The results of two different break-downs (in two and four sub-periods, respectively) are reported in Table 3. First, separating between two sub-periods, before and after the mid-1980s, the MAE statistic is virtually the same (2.71 and 2.76). Second, distinguishing between shorter sub-periods (i.e., four periods) does not reveal any significant pattern of growing unpredictability either. As a matter of fact, the lowest average for the errors of prediction (2.45 percentage points) is observed for the most recent period (2003–2017). Overall, the results in Table 3 do not offer much support for the expectation that structural forecasting errors have grown larger over time.
Mean absolute prediction error for different time periods

Notes: Average absolute prediction errors from the pooled model (Table 2).
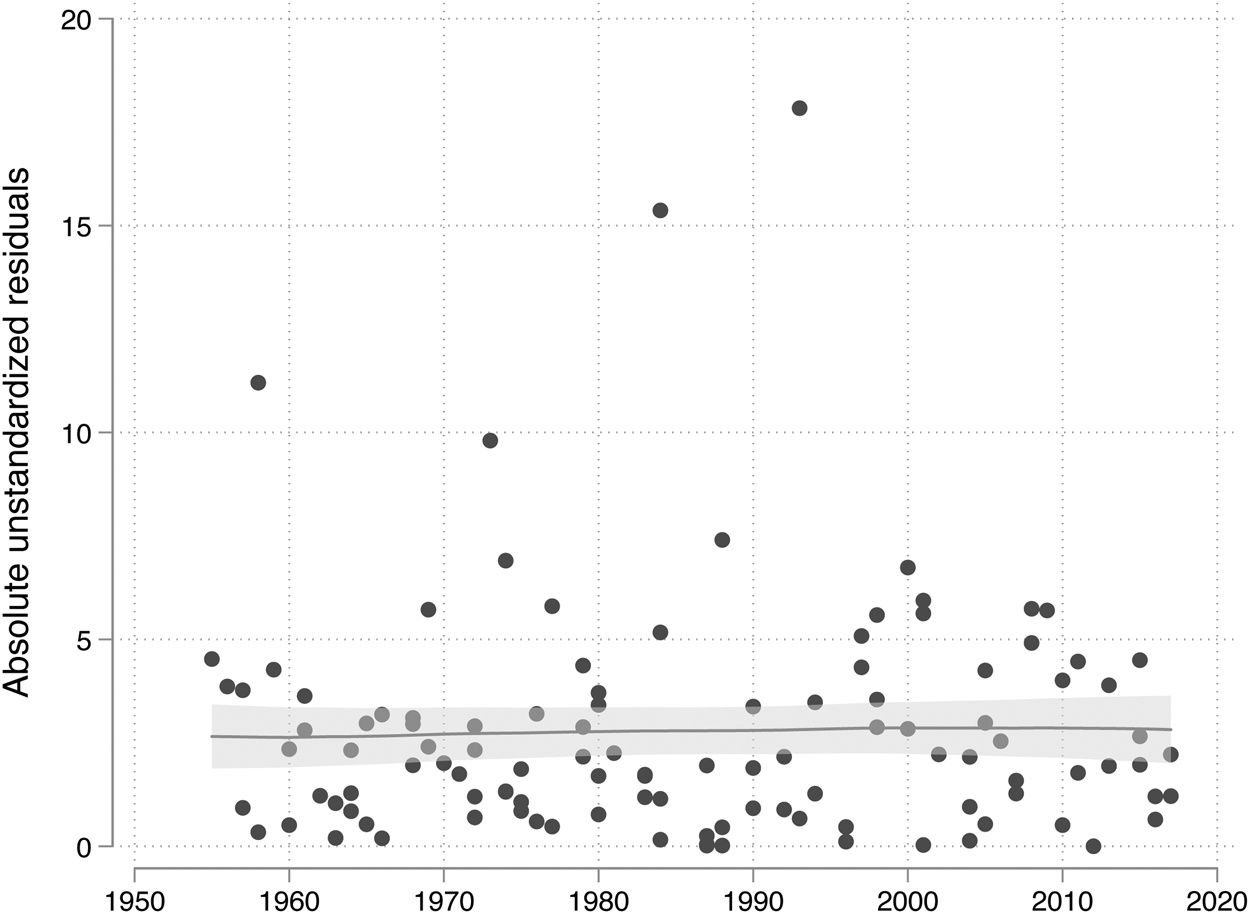
In Figure 1, we plot the absolute prediction errors of our pooled model over the year of the election.Footnote 6 Eyeballing the errors that are depicted here we see, first, that a large majority of errors are below three points—which is the conventional margin of error of vote intention polls. Further, the local polynomial smoother line that is fitted on the data further confirms that there are no indications of a clear trend in the size of the errors that our structural forecasting model produces.
Absolute unstandardized residuals for the incumbent vote model in Australia, Canada, Denmark, Germany, the UK and the USA (1955–2017).
Note: Absolute unstandardized residuals and local polynomial smoother line. Grey area represents the 95 percent confidence intervals.

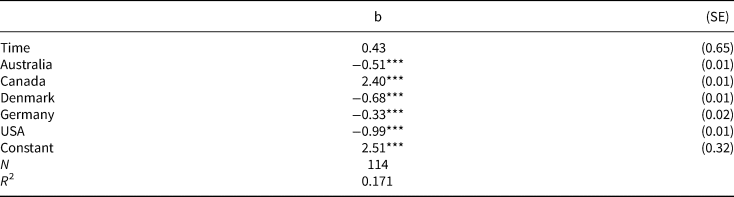
Finally, consider the independent variable of interest is time, measured as a counter variable that takes the value of 0 for the first election in our sample (the May 1955 election in the UK) then runs upwards in fractions until 1 is reached for the most recent election (the September 2017 election in Germany). Estimating a regression model allows taking into account country-level heterogeneity in the data, by means of country fixed effects and clustered standard errors. In line with the main equation that we estimated, the data are weighted to take into account the over- and underrepresentation of particular countries in the dataset.
The results of this regression model are summarized in Table 4. These results lead us to conclude that the errors of structural forecasting models have not grown over time. It should be pointed out that this essentially null result still holds when estimating a non-linear effect of time, or when changing the time count variable for a continuous measure of years since 1955 (Appendix C).
Linear regression for absolute residuals of the incumbent vote model in Australia, Canada, Denmark, Germany, UK and USA (1955–2017)

Notes: Entries are unstandardized regression coefficients with standard errors in parentheses (clustered by country). The data are weighted to account for the under- and overrepresentation of countries in the dataset. For country dummy variables, the UK is the reference category. Significance level: *p < 0.05, **p < 0.01, ***p < 0.001 (two-tailed tests).
5. Robustness of the results
These results can be challenged in a number of ways, which we address in a set of supplemental analyses.
First, we validated that our results are driven by outliers. The analyses that are reported in Appendix D suggest that even when excluding potential outlier elections, the time variable still fails to reach significance.
Second, some might question our reliance on vote intention data. We address this issue by replicating our analyses with a more standard government approval indicator in three of the six countries; Germany, the UK and the USA. These additional analyses nicely replicate our main results (see Appendix E).
6. Discussion
We have applied a parsimonious model to predict elections in these six countries, and despite its simplicity, our structural forecasting model performs well. Even more surprisingly, our results do not give the slightest indication of a trend in the size of the prediction errors of this model.
The absence of a clear trend in the error of structural forecasting models suggests that elections have not, over time, become more unpredictable. This interpretation also matches with the findings of Jennings and Wlezien's (Jennings and Wlezien Reference Jennings and Wlezien2018) analysis of polling errors over time.Footnote 7 They, like us, find no indication of change over time—suggesting that elections are as predictable now as they were some decades ago.
Our results do not imply that campaigning lacks importance. To the contrary, campaigning has perhaps become more valuable than ever for candidates in today's context, in order to counteract opponents' intense flows of communication (Zaller Reference Zaller1989). Furthermore, campaigns may attract or divert voters' attention from the fundamentals at election time (Lewis-Beck and Tien Reference Lewis-Beck and Tien2018; Nadeau and Lewis-Beck Reference Nadeau and Lewis-Beck2012; Vavreck Reference Vavreck2009). If structural forecasting models still manage to have a good record predicting election outcome, it is thus because the “fundamentals” that are included in those models are strong predictors of voters' electoral behavior. Those factors are thought to ultimately influence voters' choices, even if some voters need the election campaign to become enlightened about those fundamental variables.
Supplementary Material
The supplementary material for this article can be found at https://doi.org/10.1017/psrm.2019.24
Acknowledgments
We are very grateful to El Hadj Touré for excellent research assistance.