1. Introduction
The pricing of insurance products issued on multiple lives, such as couple members, requires the use of statistical models which can best predict their future lifetimes. The assumption of independent lifetimes can sensibly reduce the model complexity and ease the implementation of computational routines for pricing. However, this assumption is not tenable in practice. For example, partners are likely to share the same socioeconomic characteristics, which affect their living standards and their exposure to similar risks (Denuit and Cornet, Reference Denuit and Cornet1999; Denuit et al., Reference Denuit, Dhaene, Le Bailly De Tilleghem and Teghem2001).
Furthermore, the use of the simplistic independence assumption can have a material impact on actuarial valuations. For example, Denuit and Cornet (Reference Denuit and Cornet1999) use a Markov model where the force of mortality depends on marital status and show how the premium of a widow pension annuity is 10% lower compared to the case where lifetime independence between husband and wife is assumed. Frees et al. (Reference Frees, Carriere and Valdez1996) employ a one-parameter copula model, demonstrating the presence of a positive dependence between husband and wife lifetimes and show that the annuity value is 5% lower compared to the case of independent lifetimes.
A wealth of approaches have been proposed for the analysis of dependent lifetimes, especially in the biostatistical and in the actuarial fields, with copula models being among the most employed ones. The aforementioned paper of Frees et al. (Reference Frees, Carriere and Valdez1996) analyzes a one-parameter Frank copula with Gompertz marginals for the lifetimes of the male and the female within a couple. Carriere (Reference Carriere2000) extends this analysis by considering other marginal distributions for the future lifetime, as well as other types of copulas, and Deresa et al. (Reference Deresa, Van Keilegom and Antonio2022) focus on the statistical properties of copula models in presence of left-truncation and dependent censoring. Bivariate survival data are also modeled using Archimedean copulas for the spouses’ stochastic intensities, see Luciano et al. (Reference Luciano, Spreeuw and Vigna2008), and the non-parametric estimators of Lopez (Reference Lopez2012) and Gribkova and Lopez (Reference Gribkova and Lopez2015). Youn and Shemyakin (Reference Youn and Shemyakin1999) were the first to account for covariates when modeling dependence. More precisely, they employ a Gumbel copula with Weibull marginals, with dependence parameter which accounts for the age difference between the spouses. They find that this feature is likely to influence the statistical association between husband and wife lifetimes. Dufresne et al. (Reference Dufresne, Hashorva, Ratovomirija and Toukourou2018) use Gompertz marginals for the time to death of the male and of the female within a couple and observe how the gender of the eldest partner has also an influence on the lifetime dependence. A first alternative to copula models to account for lifetime dependence is the use of Markovian models, drawing on the earlier idea of Norberg (Reference Norberg1989), such as the papers of Denuit and Cornet (Reference Denuit and Cornet1999), Spreeuw and Owadally (Reference Spreeuw and Owadally2013) and Ji et al. (Reference Ji, Hardy and Li2011). In particular, Ji et al. (Reference Ji, Hardy and Li2011) and Spreeuw and Owadally (Reference Spreeuw and Owadally2013) also consider the temporary impact of bereavement on the mortality of the surviving spouse through a semi-Markov model. Ji et al. (Reference Ji, Hardy and Li2012) discuss the application of this semi-Markov model when analyzing reverse mortgage terminations. We refer to Ji et al. (Reference Ji, Hardy and Li2011) for an account of the key differences between Markov models and copulas to model dependent lifetimes.
Another possibility to model-dependent lifetimes is given by models using random effects (or frailty components, see Vaupel et al., Reference Vaupel, Manton and Stallard1979) to capture the dependence between lifetimes. This means that conditional on a latent variable, then lifetimes are independently distributed. For example, the paper of Gourieroux and Lu (Reference Gourieroux and Lu2015) extends a Freund model accounting for the bereavement effect through a common gamma-distributed frailty for the analysis of mortality dependence between couple members, and Yashin and Iachine (Reference Yashin and Iachine1995) develop a correlated gamma frailty model for the analysis of the joint lifetime of Danish twins. The lifetime dependence of the latter was analyzed also in the paper of van den Berg and Drepper (Reference van den Berg and Drepper2022) using a mixed proportional hazard model à la Abbring and van den Berg (Reference Abbring and van den Berg2003) with a frailty which follows a Cherian bivariate Gamma distribution. They find that the dependence can be chiefly attributed either to genetic features or to early childhood upbringing, rather than the bereavement effect. Similarly, the paper of Lu (Reference Lu2017) analyzes the mortality profile of couples in a portfolio of joint life annuities of a French insurer using a flexible bivariate semi-parametric model based on the Gamma distribution, which is motivated by its mathematical tractability.
In the field of biostatistics, a closely related problem is given by modeling dependent time to event and time to censoring. Huang and Wolfe (Reference Huang and Wolfe2002) address this problem by assuming a Cox proportional hazard model for the hazard function of two random variables, whose linear term includes a normally distributed log-frailty component. Gorfine and Hsu (Reference Gorfine and Hsu2011) consider other parametric functions for the distribution of the individual frailty.
The current approaches based on copula, Markov multi-state models and random effects are based on specific parametric or semi-parametric assumptions about lifetime dependence. Their possible misspecification may have the impact of yielding biased estimates for the joint (conditional) distributions of interest. The papers of Ungolo and van den Heuvel (Reference Ungolo and van den Heuvel2022, Reference Ungolo and van den Heuvel2024) overcome this potential misspecification issue by using a multivariate random effect with a discrete distribution and unknown location and number of levels, which are to be estimated.
On the other hand, existing approaches using random effects do not account for covariates in their distribution in order to explain the dependence among time to events.
This paper contributes to the literature by proposing the augmented variable Dirichlet process mixture (AVDPM) model, which consists of a joint probability distribution of the time to events and of the group-specific covariates, where all these variables are independently distributed, conditional on a multivariate latent variable, whose discrete probability distribution is drawn from a Dirichlet process. In this way, we can flexibly account for the lifetime dependence among units within a group, and at the same time we can account for those common covariates which capture the dependence between lifetimes. The model parameters are estimated by means of a fully Bayesian analysis, which may include the information available to the researcher. In addition, we show how this approach can easily account for right censoring and left truncation.
This paper is organized as follows: Section 2 briefly introduces the Dirichlet process and the Dirichlet process mixture model, and Section 3 presents the AVDPM model for the analysis of dependent lifetimes. Section 4 describes the empirical dataset used for illustrating the model and the additional parametric features for the joint lifetime of male–female couples and for the couple-specific covariates. Section 5 describes the Bayesian inferential framework for the analysis of the AVDPM model. Section 6 presents the results of the empirical analysis, and Section 7 shows how the model can be used when pricing joint life and last survivor annuities, and how it compares with approaches assuming independent lifetimes. Section 8 extends the AVDPM to the analysis of more general groups of dependent lifetimes, and Section 9 concludes.
2. Dirichlet processes and Dirichlet process mixtures
The Dirichlet process (DP) was first introduced by Ferguson (Reference Ferguson1973) to specify a probability model for the random masses of a discrete distribution G. We thus say that G follows a Dirichlet process on the measurable space
 $\left(\Gamma,\mathcal{G} \right)$
if for any measurable partition
 $\left(W_1,\ldots, W_q \right)$
of
 $\Gamma$
, then
 \begin{align*} \left(G\left(W_1 \right), \ldots, G\left(W_q \right)\right) \sim \text{Dirichlet}\left(\phi G_0\left(W_1 \right), \ldots, \phi G_0\left(W_q \right) \right)\end{align*}
which we write
 $G \sim \text{DP}\left(G_0,\phi\right)$
. Hence, a random draw from the DP yields an almost sure discrete probability distribution over a countably infinite number of points drawn independently from a base distribution denoted as
 $G_0$
, which specifies the DP together with the concentration parameter
 $\phi$
(see Gelman et al., Reference Gelman, Carlin, Stern, Dunson, Vehtari and Rubin2013, Chapter 23 and De Iorio et al., Reference De Iorio, Müller, Rosner and MacEachern2004). The
 $\phi$
parameter captures the degree of shrinkage of G toward
 $G_0$
, or in other words, the strength of the prior assumption
 $G_0$
over G, analogous to the prior assumption about the parameters of a probability distribution in Bayesian statistics.
Sethuraman (Reference Sethuraman1994) outlines a construction of G as a mixture distribution with a countably infinite number of components, indexed by k:
 \begin{align}G= \displaystyle\sum_{k=1}^{\infty} \pi_k \delta_{\gamma_k},\end{align}
where
 $\gamma_k \overset{\mathrm{i.i.d.}}{\sim} G_0$
for
 $k=1,2,\ldots$
, and
 $\delta_{\gamma_k}$
denotes the Dirac measure that assigns unitary mass if
 $\gamma=\gamma_k$
and zero otherwise. The mixture weights
 $\pi_k$
are randomly generated using the so called stick breaking procedure (SBP), which rescales a set of i.i.d. random variables
 $\psi_k \overset{\mathrm{i.i.d.}}{\sim} \text{Beta}\left(1,\phi\right)$
as follows:
 \begin{align} \pi_k \equiv \pi_k \left(\psi_{1:k} \right) = \psi_k \displaystyle\prod_{j=1}^{k-1} \left(1 - \psi_j \right).\end{align}
where
 $\psi_{1:k} = \left(\psi_{1},\ldots,\psi_k \right)$
. The “stick breaking” definition refers to the decreasing size of the mixture weights as the index k increases. From this characterization, we can observe how a random draw from a Dirichlet process yields a discrete distribution over a countably infinite number of atoms from
 $G_0$
.
In this paper, we are interested in a flexible model for the probability distribution of a random variable
 $T_i$
, eventually multivariate, for the ith unit, whose density
 $f\left(\cdot;\;\beta,\gamma_i\right)$
is indexed by a global parameter vector
 $\beta$
, common to all units, and by a unit-specific parameter vector
 $\gamma_i$
. Unit-specific parameters, commonly referred as random effects in biostatistics, are introduced in a probability model to characterize the heterogeneity among the units due to unobservable variables.
To achieve this goal, we assume that
 $\gamma_i$
are drawn from a discrete distribution G, which follows a Dirichlet process. Therefore, convolving the density of
 $T_i$
with
 $G \sim \text{DP}\left(G_0,\phi \right)$
yields a Dirichlet process mixture (DPM) model (Lo, Reference Lo1984):
 \begin{align} f \left(t \mid \beta, G \right) = \int_{\Omega{\gamma}} f \left(t \mid \beta, \gamma \right) \mathrm{d}G\left(\gamma\right) = \displaystyle\sum_{k=1}^{\infty} \pi_k f \left(t \mid \beta,\gamma_k \right)\end{align}
where
 $\Omega{\gamma}$
denotes the sample space of
 $\gamma$
.
The DPM model hereby defined allows for a more flexible distribution of
 $T_i$
, which can capture complex features in the data, such as fat tails and multimodality, as opposed to the case where we specify a parametric model for
 $\gamma_i$
, such as the normal distribution.
This DP construction is flexible since despite its apparent nonparametric nature, it regularizes the distribution of G toward a simple parametric form
 $G_0$
through the concentration parameter
 $\phi$
.
From another perspective, a discrete distribution for
 $\gamma_i\sim G$
is akin to the creation of ties among the units, which can configure clusters of observations with the same values of
 $\gamma$
. Let
 $s_i=k$
to indicate that the ith unit belongs to the kth cluster characterized by the parameter
 $\gamma^*_k$
. We use the superscript
 $^*$
to denote the common values of
 $\gamma_i$
across the n units in the sample. The clustering procedure, tuned by the parameter
 $\phi$
, allows to sequentially group the observations through a sampling process known in the literature as the Chinese restaurant process (see Heinz, Reference Heinz2014 for an illustration). In words, as we observe the units in a sequence, these are more likely to be in a certain class with a probability that depends on the number of units already therein, or to belong to a newly created class with a probability which depends on
 $\phi$
(see Blackwell and MacQueen, Reference Blackwell and MacQueen1973 for a characterization in terms of the Pólya urn distribution).
The use of Dirichlet processes can also be seen as a method to infer the number of components of a mixture distribution, as opposed to strategies based on appropriate model selection criteria (see Ungolo and van den Heuvel, Reference Ungolo and van den Heuvel2022 for a discussion). Their advantage is to avoid the specification and the estimation of several models with different numbers of mixture components, which can be time consuming.
Summing up, the DPM model assumes the following data generating process for a sample
 $t_1,\ldots,t_n$
:
 \begin{equation}\begin{aligned}& \pi_k \mid \phi \sim \text{SBP}\left(\phi\right), \quad \text{ }k=1,2,\ldots; && \\[5pt] & \gamma^*_k \mid G_0 \overset{\mathrm{i.i.d.}}{\sim} G_0, \quad \text{ }k=1,2,\ldots; && \\[5pt] & s_i \mid \pi_1, \pi_2,\ldots \overset{\mathrm{i.i.d.}}{\sim} \text{Discrete}\left(\pi_1, \pi_2,\ldots \right), \quad \text{ }i=1,\ldots,n; &&\\[5pt] & t_i \mid \beta,\gamma_{s_i}^* \overset{\mathrm{i.i.d.}}{\sim} f\left(t_i \mid \beta,\gamma_{s_i}^* \right) \quad \text{ } i=1,\ldots,n.\end{aligned}\end{equation}
3. The Augmented Variable DPM model
This section introduces the augmented variable Dirichlet process mixture (AVDPM) model for the analysis of nonexchangeable joint dependent lifetimes within a group, where individual as well as group-specific covariates are available. For example, husband and wife lifetimes are likely to be positively associated (Denuit et al., Reference Denuit, Dhaene, Le Bailly De Tilleghem and Teghem2001), since they share the same living conditions (e.g. diet, socioeconomic factors), are exposed to similar risks (e.g. during a catastrophic event they are likely to be in the same place), or eventually subject to the broken-heart syndrome (Parkes et al., Reference Parkes, Benjamin and Fitzgerald1969). Other examples include the joint lifetimes of the primary and secondary head of an insurance policy, families with husband, wife and one child, and so on. We describe the framework in the context of a model for the joint lifetime of male–female couples. In Section 8, we discuss how to extend the framework to more general cases of groups with different numbers of exchangeable lifetimes.
Let
 $T_i=\left(T_{i,1},\ T_{i,2}\right)$
, where
 $T_{i,1}$
and
 $T_{i,2}$
denote the random future lifetime of husband and wife, respectively, for the ith couple, with individual-specific vector of characteristics
 $x_{i,1}$
and
 $x_{i,2}$
(such as age, medical status, and so on) fixed and observable, and couple-specific covariates vector
 $Z_i$
, which can include for example household income and geo-demographic profile (an indicator of the socioeconomic status, see Ungolo et al., Reference Ungolo, Christiansen, Kleinow and MacDonald2019), which we treat as a random variable. Therefore,
 $Z_i$
includes any features that can explain the statistical association between the lifetimes of the husband and of the wife. For example, the household income can explain the heterogeneity in the longevity profile of each couple member since a wealthy couple can access better healthcare services all else being equal, compared to a deprived one. Similarly, the geo-demographic profile, capturing the effect of the area where the couple lives (e.g. urban or rural), can also be a proxy for the socioeconomic characteristics of a couple.
For the ith couple, we assume that conditional on a couple-specific bivariate random effect
 $\gamma_i=\left(\gamma_{i,1},\gamma_{i,2}\right)$
, then
 $T_{i,1}$
and
 $T_{i,2}$
are independently distributed. This is, for example, the approach followed in Ungolo and van den Heuvel (Reference Ungolo and van den Heuvel2022) when analyzing a joint model for the time to event and the time to censoring and by Ungolo and van den Heuvel (Reference Ungolo and van den Heuvel2024) where they develop a joint model for the time to competing risk events.
The AVDPM model “augments” the joint probability distribution of
 $\left(T_{i,1},T_{i,2}\right)$
by specifying a joint probability model for
 $\left(T_{i,1},T_{i,2}, Z_i\right)$
:
 \begin{align} f & \left(t_{i,1},t_{i,2}, z_i \mid x_{i,1},x_{i,2}; \beta_1,\beta_2,G\right)\nonumber \\[5pt] &= \int_{\Omega_{\gamma,\zeta}} \left[\displaystyle\prod_{j=1}^2 f\left(t_{i,j} \mid x_{i,j}; \beta_j, \gamma_{i,j}\right) \right] f \left(z_i \mid \zeta_i\right) \mathrm{d}G\left(\gamma_{i,1},\gamma_{i,2},\zeta_i \right)\end{align}
where
 $\beta_j$
is the parameter specific to the future lifetime density of the husband (
 $j=1$
) or of the wife (
 $j=2$
),
 $\zeta_i$
is the couple-specific parameter vector indexing the distribution of
 $Z_i$
(which can also include global parameters, i.e. not couple-specific), and
 $\Omega_{\gamma,\zeta}$
denotes the sample space of
 $\left(\gamma_1,\gamma_2,\zeta\right)$
. We generically denote by f the probability density function of continuous variables and the mass function of the discrete ones.
The joint distribution of Equation (3.1) allows to capture the dependence between
 $T_{i,1}$
and
 $T_{i,2}$
and between
 $\left(T_{i,1},T_{i,2} \right)$
and
 $Z_i$
through the joint distribution of
 $\left(\gamma_{i,1},\gamma_{i,2},\zeta_i \right)$
. The individual-specific fixed covariate vector
 $x_{i,j}$
directly enters the regression function of
 $T_{i,j}$
. On the other hand, the ith couple-specific covariate vector
 $Z_i$
is assumed to affect the individual lifetime distribution only indirectly, through
 $\left(\gamma_{i,1},\gamma_{i,2},\zeta_i \right)$
. Indeed, it is reasonable to assume that individual variables like medical status and age affect the individual mortality directly, while couple-specific variables like household income can have an indirect effect on mortality through the affordability of good quality healthcare services. This model differs from treating
 $Z_i$
as an exogenous variable, for example by including this observable variable among the set of fixed covariates within a regression function, such as in the paper of Deresa et al., (Reference Deresa, Van Keilegom and Antonio2022). Both approaches allows to estimate the effect of
 $Z_i$
on the distribution of
 $T_{i,j}$
, as shown in Equation (3.3) below. In addition, the density of Equation (3.1) allows to have an understanding of the differing strength of the statistical association between
 $T_{i,1}$
and
 $T_{i,2}$
as we show in the empirical analysis of Section 6.
We complete the model specification by assuming that the multivariate discrete distribution G is a random draw from a Dirichlet process, and write
 $G\sim \text{DP}\left(G_0,\phi \right)$
. For simplicity, we assume
 $G_0=G_{0,\gamma}\times G_{0,\zeta}$
, that is
 $\gamma$
and
 $\zeta$
are independently distributed in the base distribution. This specification still induces a dependence between
 $\gamma$
and
 $\zeta$
through the concentration parameter
 $\phi$
. A further simplification can be to specify
 $G_{0,\gamma}=G_{0,\gamma_1}\times G_{0,\gamma_2}$
, leaving the distribution of
 $\left(\gamma_{i,1},\gamma_{i,2},\zeta_i \right)$
fully tuned by
 $\phi$
. However, the former approach allows to account for the prior information from the researcher about the joint distribution of the parameters, including the statistical association between
 $\gamma_1$
and
 $\gamma_2$
, as more reasonable for the analysis of male–female couples.
An additional feature of this factorization, which enhances the flexibility of this joint model is that we can specify different parametric models for
 $T_{i,1}$
and
 $T_{i,2}$
, and that it allows for both positive and negative dependencies between lifetimes, similarly to the model of Lu (Reference Lu2017).
As in Equation (2.3), we can rewrite the density in (3.1) as a mixture distribution with an infinite number of components, obtaining the augmented variable DPM (AVDPM)model:
 \begin{align} f & \left(t_{i,1},t_{i,2}, z_i \mid x_{i,1},x_{i,2}; \beta_1,\beta_2,G\right) \nonumber \\[5pt] &= \displaystyle\sum_{k=1}^{\infty} \pi_k \left[\displaystyle\prod_{j=1}^2 f\left(t_{i,j} \mid x_{i,j}; \beta_j, \gamma_{k,j}^*\right) \right] f \left(z_i \mid \zeta_k^* \right)\end{align}
where
 $\pi_k$
(
 $k=1,2,\ldots$
) is the mixture weight characterized by the stick-breaking procedure described in Section 2, and the superscript
 $^*$
denotes the unique values of
 $\gamma_{i,j}$
and
 $\zeta_i$
.
The flexibility of this factorization allows to understand the impact of
 $Z_i$
on the distribution of
 $T_{i,j}$
(or of
 $\left(T_{i,1},T_{i,2}\right)$
) by using standard probability calculus:
 \begin{align} f\left(t_{i,j} \mid x_{i,j},z_i;\;\beta_j, \gamma_{\cdot,j}^*, \zeta_{\cdot}^* \right) = \frac{\displaystyle\sum_{k=1}^{\infty} \pi_k f\left(t_{i,j} \mid x_{i,j};\;\beta_j, \gamma_{k,j}^* \right) f\left(z_i \mid \zeta_{k}^* \right)}{\displaystyle\sum_{k=1}^{\infty} \pi_k f\left(z_i \mid \zeta_{k}^* \right)} \,.\end{align}
where
 $\gamma_{\cdot,j}^* = (\gamma_{1,j}^*,\gamma_{2,j}^*,\ldots )$
and
 $\zeta_{\cdot}^* = (\zeta_{1}^*,\zeta_{2}^*,\ldots )$
.
In a similar fashion, we can derive the probability distribution of the time to death of the last survivor
 $T_{\overline{1,2}}=\text{max}\left(T_1,T_2 \right)$
. We omit the subscript i for notational convenience. The corresponding survivor function, simplistically denoted as
 $S_{\overline{x_1,x_2}}\left(t \mid z \right)$
, is useful especially in actuarial calculations, as we illustrate in Section 7:
 \begin{align} S_{\overline{x_1,x_2}}\left(t \mid z \right) := \mathbb{P} \left(T_{\overline{1,2}} \gt t \mid x_1,x_2,z \right) = 1 - \mathbb{P} \left(T_{1} \lt t, \enspace T_{2} \lt t \mid x_1,x_2,z \right),\end{align}
where
 \begin{align}\nonumber \mathbb{P} \left(T_{1} \lt t, \enspace T_{2} \lt t \mid x_1,x_2,z \right) &= \frac{\displaystyle\sum_{k=1}^{\infty} \pi_k f\left(z \mid \zeta_{k}^* \right) \left[ \displaystyle\prod_{j=1}^2 \int_0^t f\left(u \mid x_{j};\;\beta_j, \gamma_{k,j}^* \right)\mathrm{d}u \right]} {\displaystyle\sum_{k=1}^{\infty} \pi_k f\left(z \mid \zeta_{k}^* \right)} \,. \end{align}
Analogous formula can be used for the joint life survival probability, denoted as
 $S_{x_1,x_2}\left( t \mid z\right)$
, characterizing the random variable
 $T_{1,2}=\text{min}\left(T_1,T_2\right)$
.
The DPM naturally clusters each couple into different classes. If we say that W is the random class allocation for a couple, we can calculate the probability of belonging to a certain class k conditional on the value of Z:
 \begin{align} \mathbb{P}\left(W=k \mid Z=z \right) = \frac{\pi_k f\left(z \mid \zeta_k^*\right) }{\displaystyle\sum_{h=1}^{\infty}\pi_h f\left(z \mid \zeta_h^*\right)} \,.\end{align}
In this way, we can understand how the various couples belonging to the kth class can share the same mortality profile and husband–wife mortality dependence relationships.
Compared to earlier literature in the field, the AVDPM model extends the mixture model analyzed by Ungolo and van den Heuvel (Reference Ungolo and van den Heuvel2022) since the authors consider a discrete random component (independent of Z) with unknown number of levels, chosen by means of a model selection procedure. The limitation of this approach is the need of estimating several models, which can be particularly time consuming for larger datasets as mentioned in Section 2. Ungolo and van den Heuvel (Reference Ungolo and van den Heuvel2024) overcome this issue by assuming that the random component is drawn from a discrete distribution following a Dirichlet process as in this paper. However, their joint lifetime model does not account for the statistical association among competing risks due to common factors.
To the best of our knowledge, the aforementioned papers (Section 1) of Youn and Shemyakin (Reference Youn and Shemyakin1999) and Dufresne et al. (Reference Dufresne, Hashorva, Ratovomirija and Toukourou2018) are the sole contributions accounting for the common variable Z (the absolute value of the age difference between the spouses and gender of the oldest partner) within the copula dependence parameter.
The factorization implied by the AVDPM model can also find application in the analysis of the time to competing causes of death, where Z accounts for those genetic factors affecting the dependence between the causes. Alternatively, the AVDPM model can be used to jointly model dependent frequency and/or severity of claims in nonlife and health insurance by type of event or line of business, without necessarily specifying a strong parametric assumption on the dependence, as can be the case with copula models.
4. Data and parametric model
We showcase the approach outlined in Section 3 to the analysis of the Canadian life insurance dataset initially studied by Frees et al. (Reference Frees, Carriere and Valdez1996) and then by Deresa et al. (Reference Deresa, Van Keilegom and Antonio2022) and Dufresne et al. (Reference Dufresne, Hashorva, Ratovomirija and Toukourou2018) among others. After some data processing operations, briefly described in Section 1 of the Supplementary Material, we have information about 13,482 joint and last-survivor annuity contracts in force between December 29, 1988 and December 31, 1993 (the observation period).
Specifically, we focus on a joint model for the lifetime distribution of individual members of male–female couples, for which we observe the starting date of the contract, the date of birth (thus their age at the start of the contract), and the date of death if any couple member dies within the observation period. This dataset contains a large number of censored units: indeed, we only observe 1,424 deaths among males and 500 deaths among females, while the remaining units are all right censored. In addition, most couples’ lifetime data are subject to left truncation. This means that we are able to observe the annuity contract only if both couple members are alive at the start of the observational period. Right censoring and left truncation must then be taken into account when deriving the likelihood function of the observations, as we have shown in Section 5.
In this dataset, the age at the start of the contract is the only individual-specific covariate (average of 65.54 for males and 62.64 for females), which we denote as
 $x_{i,j}$
for the jth member of the ith couple. As in Dufresne et al. (Reference Dufresne, Hashorva, Ratovomirija and Toukourou2018) and Youn and Shemyakin (Reference Youn and Shemyakin1999), we consider also the age difference (mean of 2.91 years) through the random variable
 $Z_i^A = \ln \left( |X_{i,1} - X_{i,2} | \right)$
and the indicator variable
 $Z_i^M$
, which is equal to 1 if the male is older than the female and 0 otherwise (the male is the oldest policyholder in 76.9% of the couples in the dataset). According to their analysis, a model including these two variables captures some additional features of the association between the lifetime of the husband and of the wife. More precisely, they claim that the larger the age difference, the lower the lifetime dependence. In addition, Dufresne et al. (Reference Dufresne, Hashorva, Ratovomirija and Toukourou2018) observe how the
 $Z_i^M$
covariate has an influence in the relationship between husband and wife, consequently affecting their lifetime dependence. Therefore, we will consider
 $Z_i^A$
and
 $Z_i^M$
as the two elements of the couple-specific covariates,
 $Z_i=\left(Z^A_i,Z^M_i\right)$
.
We randomly split the dataset into a training set, corresponding to 75% of the policyholders within the dataset (10,112 units), and use the remaining 25% to assess the out of sample performance of the model (3,370 units).
Following Frees et al. (Reference Frees, Carriere and Valdez1996) and Carriere (Reference Carriere2000), we specify a Gompertz-type hazard function to characterize the probability distribution of the male (
 $j=1$
) and the female (
 $j=2$
) lifetime within the ith policy:
 \begin{align} \mu \left(t \mid x_{i,j};\;\alpha_j, \beta_j, \gamma_{i,j}\right) = \exp \left(\alpha_j + \beta_j \left(x_{i,j} - \overline{x} + t\right) + \gamma_{i,j} \right),\end{align}
where
 $\overline{x}=70$
is set in order to decrease the posterior correlation between
 $\alpha_j$
and
 $\beta_j$
, which improves the convergence of the MCMC sampler. The choice of
 $\overline{x}$
is based on an indicative average value of x as calculated across males and females. For example, Ungolo et al. (Reference Ungolo, Kleinow and Macdonald2020) set
 $\overline{x}=77.5$
since they analyzed a pension scheme dataset with older scheme members.
We consider the male–female lifetime dependence by assuming a couple-specific frailty term
 $\exp\left(\gamma_{i,j}\right)$
and a joint model for
 $\left(\gamma_{i,1}, \gamma_{i,2}\right)$
. The parameter
 $\alpha_j$
denotes the log-baseline hazard function and
 $\beta_j$
measures the log-linear increase in the hazard function due to the individual age. The probability density function of
 $T_{i,j}$
can be written as:
 \begin{align} f \left(t \mid x_{i,j}; \alpha_j, \beta_j, \gamma_{i,j}\right) = \exp \biggl[ -\int_0^t \mu \left(s \mid x_{i,j};\;\alpha_j, \beta_j, \gamma_{i,j}\right) \mathrm{d}s \biggr] \mu \left(t \mid x_{i,j};\;\alpha_j, \beta_j, \gamma_{i,j}\right) .\end{align}
For the couple-specific covariates, we assume that
 $Z_i^A \sim \text{N}\left( \zeta_{i}^A,\sigma^2_A \right)$
and
 $Z_i^M \sim \text{Bernoulli}\left(\zeta^M_i\right)$
. The density of
 $T_{i,j}$
as a function of
 $x_{i,j}$
and
 $z_i$
follows from Equation (3.3). In this way, we can easily observe how the resulting joint model for
 $\left(T_{i,1},T_{i,2},Z_i\right)$
has an additional layer of flexibility since the effect of
 $Z_i$
on the hazard function (through dependent
 $\gamma_{i,j}$
,
 $\zeta^A_i$
and
 $\zeta^M_i$
) is not necessarily proportional nor monotone.
The ith couple-specific parameters are drawn from a multivariate random discrete distribution G,
 $\left(\gamma_{i,1},\gamma_{i,2},\zeta_{i}^A,\zeta_{i}^M\right)\sim G$
, where G is a draw from a Dirichlet process with concentration parameter
 $\phi$
and base measure
 $G_0$
:
 \begin{align}G_0=\underbrace{g\left(\gamma_{i,1}, \gamma_{i,2} \mid \textbf{0}, \Sigma_{\gamma} \right)}_{\text{MVN}\left( \textbf{0}, \enspace \Sigma_{\gamma} \right)} \underbrace{g\left(\zeta_{i}^A \mid m_{A}, s_A^2 \right)}_{\text{N}\left( m_{A}, \enspace s_{A}^2 \right)}\underbrace{ g \left(\zeta_{i}^M \mid 13.31,4.44 \right)}_{\text{Beta} \left( 13.31,\ 4.44 \right)} \,.\end{align}
This model for the base distribution is motivated by the need to carry out a computationally efficient Bayesian inference by exploiting the conditional conjugacy of the parameters where possible, whilst keeping the model simple and flexible enough to capture the complex features of the data.
The parameters of the Beta distribution for
 $\zeta_{i}^M$
follow from an elicitation process where we specify a weakly informative distribution. Indeed, we expect that for most contracts the male couple member is the oldest in the couple; therefore, we set
 $\zeta_i^M$
to have mean 0.75 and standard deviation equal to 0.1 in the base distribution. In our analysis, we have also tried a prior distribution with a standard deviation of 0.05, which did not significantly impact the final results in terms of the convergence of the chain towards a stationary distribution, posterior distribution of the other parameters, and cluster allocation of the couples.
For all the other parameters of the base distribution, we assume that these are random to enhance the robustness of the inference, as from the prior elicitation process and the sensitivity analysis described in Section 5.1.
5. Inference
First of all, we approximate the mixture distribution of Equation (3.2) by setting an upper bound
 $K=25$
to the number of mixture components as in Ungolo and van den Heuvel (Reference Ungolo and van den Heuvel2024), which results in the truncated SBP of Ishwaran and James (Reference Ishwaran and James2001). Indeed, as motivated in Section 5.1, this is a conservative choice since only few components are sufficient to model the additional heterogeneity in the data, while all other components turn out to have a mixture weight nearly equal to zero. This simplifies the implementation of the Markov Chain Monte Carlo (MCMC) sampler compared to the use of the bound-free slice samplers of Walker (Reference Walker2007) and Kalli et al. (Reference Kalli, Griffin and Walker2011), or the retrospective sampler of Papaspiliopoulos and Roberts (Reference Papaspiliopoulos and Roberts2008).
5.1. Prior elicitation, specification, and sensitivity
In this paper, we carefully consider the specification of the prior distribution of the parameters. This is motivated by the number of layers of the hierarchical model hereby proposed and the large number of coarsened observations in this dataset, which can hinder the convergence of any MCMC scheme and cause poor mixing whenever different starting values are used.
As already observed by Dunson (Reference Dunson2010) and Beraha et al. (Reference Beraha, Guglielmi, Quintana, Iorio, Eriksson and Yap2023), specifying base distributions with large variances implies that all couples will tend to be allocated in the same mixture component, which does not capture the heterogeneity in the data.
Therefore, we specify at least weakly informative prior distributions, especially for the lowest levels of the model. Where possible, we assume that the parameters (or groups of parameters) are pairwise independently distributed and use conditionally conjugate prior distributions in order to facilitate the computation of the posterior distribution.
Previous analyses of mixtures involving proportional hazard models (see for example Ungolo et al., Reference Ungolo, Kleinow and Macdonald2020 and Ungolo and van den Heuvel, Reference Ungolo and van den Heuvel2022) show how three components can be useful to explain the heterogeneity in the data. Given the sample size of this dataset and the dimensionality of G, we specify a conjugate Gamma
 $\left(6,12\right)$
prior for
 $\phi$
(Escobar and West, Reference Escobar and West1995), which yields a right-skewed prior probability distribution for the number of occupied components (the number of classes with at least one observation) with mean 5.5 and mode equal to 4. Conversely, a lesser informative Gamma
 $\left(1,1\right)$
prior increases the number of occupied components a priori and a posteriori, without any impact on the posterior inference for the other parameters.
The parameter
 $\Sigma_{\gamma}$
follows a conjugate inverse-Wishart distribution with positive-definite scale matrix
 $\lambda \times \begin{bmatrix} 1 & 0.6 \\[0.3em] 0.6 & 1\end{bmatrix}$
and 5 degrees of freedom. We set the scalar
 $\lambda=2$
in order to strengthen the prior assumption toward a covariance matrix, which induces a positive correlation between
 $\gamma_{i,1}$
and
 $\gamma_{i,2}$
. In our prior-posterior sensitivity analysis, we notice how the posterior distribution of
 $\Sigma_{\gamma}$
turns out to be sensitive with respect to
 $\lambda$
, hence the specification of an informative prior distribution plays an important role in the inference for this parameter. The posterior distribution for all other parameters is robust with respect to this assumption.
The location parameter of
 $\zeta_i^A$
,
 $m_A$
is drawn from a conjugate normal distribution with mean 3 and variance 0.5, while the scale
 $s^2_A$
is assumed to follow an inverse-Gamma
 $(3,0.5)$
distribution, ensuring that mean and variance of
 $s^2_A$
are defined. Our sensitivity analysis, which used a lesser informative prior on these two parameters, showed how the posterior distribution of
 $m_A$
is robust with respect to the specification of a weaker prior distribution with a larger variance, while the opposite holds for
 $s^2_A$
. In the latter case, we observe a shift in the posterior distribution for
 $m_A$
toward larger values, and the posterior density of of
 $s^2_A$
is very flat and centered toward very large values. This evidence suggests the necessity to carefully specify the prior distribution for
 $s^2_A$
.
We complete the full specification of the prior distribution by assuming that
 $\exp\left(\alpha_j \right)\sim \text{Gamma}\left(1,1\right)$
(which ensures conditional prior-posterior conjugacy) and
 $\beta_j$
(
 $j=1,2$
) follows a priori a truncated normal distribution with mean 0.1 and variance 0.25, bounded below at zero to ensure biologically reasonable mortality rates, which should increase with age. The location parameter was chosen on the basis of previous analyses of similar models, which estimated a value of
 $\beta$
around 0.10 (see for example Ungolo et al., Reference Ungolo, Kleinow and Macdonald2020 and Richards, Reference Richards2008). Finally, we assume that
 $\sigma^2_{A} \sim \text{Inv-Gamma}\left( 2,1\right)$
.
Our sensitivity analysis shows how the posterior inference for
 $\beta$
and
 $\sigma^2_A$
is robust with respect to the specification of weaker prior distributions and that the posterior distribution of the other model parameters are unaffected by this. On the other hand, the posterior distribution for
 $\alpha$
can be affected by its posterior correlation with the parameters
 $\gamma_{k,1}^*$
and
 $\gamma_{k,2}^*$
, as we discuss in Section 6.
5.2. Likelihood
Let
 $d_{i,j}$
denote an indicator variable that is equal to 1 if the male (
 $j=1$
) or the female couple member (
 $j=2$
) is observed to die throughout the observational study and 0 otherwise (hence, the lifetime variable is right censored). We assume that the censoring mechanism can be ignored since the censoring event for a couple member is caused by the end of the observation period (Type I censoring). Furthermore, we assume that the individual times to event for each couple member are independently distributed, conditional on the covariates and the multivariate random effect.
As discussed in Section 4, data are subject to left truncation since each contract is observable upon survival of both members at the start of the study. The level of left truncation for each couple is denoted by the variable
 $a_i$
, denoting the time (in years) from the start of the contract to the start of the observational study. This means that we need to work with the lifetime density function conditional on both couple members being alive at the beginning of the observation period. Note that
 $a_i$
is equal to zero if the contract starts during the observation period.
Let
 $\textbf{t}=\left(t_{1,1},t_{1,2},\ldots,t_{n,1},t_{n,2} \right)$
,
 $\textbf{x}=\left(x_{i,1}, x_{i,2},\ldots,x_{n,1}, x_{n,2} \right)$
,
 $\textbf{d}=\left(d_{1,1}, d_{1,2},\ldots,d_{n,1}, d_{n,2} \right)$
,
 $\textbf{z}^{\textbf{A}}=\left(z^A_1,\ldots,z^A_n \right)$
,
 $\textbf{z}^{\textbf{M}}=\left(z^M_1,\ldots,z^M_n \right)$
,
 $\textbf{a}=\left(a_1,\ldots,a_n \right)$
,
 $\alpha=\left(\alpha_1,\alpha_2 \right)$
,
 $\beta=\left(\beta_1,\beta_2 \right)$
,
 $\psi=\left(\psi_1,\ldots,\psi_{K-1} \right)$
,
 $\gamma^*=\left(\gamma^*_{1,1},\gamma^*_{1,2},\ldots,\gamma^*_{K,2}\right)$
,
 $\zeta^{A*}=\left(\zeta^{A*}_1,\ldots,\zeta^{A*}_K\right)$
and
 $\zeta^{M*}=\left(\zeta^{M*}_1,\ldots,\zeta^{M*}_K\right)$
. We introduce the latent indicator variable
 $s_{i,k}$
, which is equal to 1 if the ith couple belongs to the kth class, and zero otherwise. This auxiliary variable facilitates an efficient computation of the posterior distribution (Müller et al., Reference Müller, Erkanli and West1996).
The likelihood function of the parameters conditional on
 $\textbf{t}$
,
 $\textbf{x}$
,
 $\textbf{a}$
,
 $\textbf{d}$
,
 $\textbf{z}^{\textbf{A}}$
,
 $\textbf{z}^{\textbf{M}}$
and the latent allocation variable
 $\textbf{s}=\left(s_{1,1},\ldots,s_{n,K}\right)$
is given by
 \begin{align} & L \left(\alpha, \beta,\gamma^*, \zeta^{A*},\zeta^{M*}, \sigma^2_{A}, \psi \mid \textbf{t}, \textbf{x},\textbf{d},\textbf{a}, \textbf{z}^{\textbf{A}}, \textbf{z}^{\textbf{M}}, \textbf{s} \right)\nonumber \\[5pt] &\propto \displaystyle\prod_{i=1}^n \displaystyle\prod_{k=1}^K \pi_k^{s_{i,k}} \Bigg\lbrace \left[\displaystyle\prod_{j=1}^2 f \left(t_{i,j} \mid x_{i,j}, d_{i,j}, a_i;\;\alpha_j,\beta_j,\gamma^*_{k,j} \right)\right] f\left(z^A_i \mid \zeta^{A*}_{k}, \sigma^2_{A} \right) \left({\zeta^{M*}_k}\right)^{z^M_i} \left(1 - {\zeta^{M*}_k}\right)^{1 - z^M_i} \Bigg\rbrace^{s_{i,k}}\end{align}
where
 $f\left(\cdot \mid \zeta^{A*}_{k}, \sigma^2_{A} \right)$
denotes the probability density function of the normal distribution with mean
 $\zeta^{A*}_{k}$
and variance
 $\sigma^2_{A}$
, and
 $\left({\zeta^{M*}_k}\right)^{z^M_i} \left(1 - {\zeta^{M*}_k}\right)^{1 - z^M_i}$
is the probability mass function of the Bernoulli-distributed random variable
 $Z^M_i$
with parameter
 ${\zeta^{M*}_k}$
. The jth couple member likelihood contribution
 $f \left(t_{i,j} \mid x_{i,j}, d_{i,j}, a_i;\;\alpha_j,\beta_j,\gamma^*_{k,j} \right)$
is derived to account for right censoring and left truncation by simple algebra as follows:
 \begin{align}\nonumber f &\left(t_{i,j} \mid x_{i,j},d_{i,j},a_{i};\;\alpha_j, \beta_j,\gamma^*_{k,j} \right) &&\\[5pt] &= \frac{\exp\left[ -\int_0^{t_{i,j}+a_i} \mu \left(s \mid x_{i,j}; \alpha_j, \beta_j,\gamma_{k,j}^*\right) \mathrm{d}s \right] \mu \left(t_{i,j}+a_i \mid x_{i,j};\;\alpha_j, \beta_j,\gamma_{k,j}^*\right)^{d_{i,j}}}{\exp\left[ -\int_0^{a_i} \mu \left(q \mid x_{i,j};\;\alpha_j, \beta_j,\gamma_{k,j}^*\right) \mathrm{d}q \right]}\end{align}
where the numerator is the likelihood contribution for a noninformative right-censored observation, which is divided by the probability of being alive between policy inception (time 0) until the start of the observation period. Given the specification of the hazard function in Equation (4.1), the logarithm of the likelihood contribution is given by
 \begin{align}\nonumber \ln\, & f \left(t_{i,j} \mid x_{i,j},d_{i,j},a_{i};\;\alpha_j, \beta_j,\gamma^*_{k,j} \right) &&\\[5pt] \nonumber &= -\frac{\exp\left[ \beta_j \left(t_{i,j} + a_i \right)\right] - \exp\left(\beta_j a_i \right)}{\beta_j} \exp \left(\alpha_j + \beta_j \left(x_{i,j}-\bar{x}\right) + \gamma^*_{k,j} \right)&&\\[5pt] & \quad + d_{i,j} \left(\alpha_j + \beta_j \left(x_{i,j} - \bar{x} + t_{i,j} + a_i\right) + \gamma^*_{k,j} \right) \,.\end{align}
5.3 Posterior distribution
The (unnormalized) posterior distribution follows as the product of the likelihood and the prior distribution. In this latter, we assume that all parameters are pairwise independently distributed, with densities generically denoted by p:

In order to efficiently learn the posterior distribution of Equation (5.4), we propose to first data augment the dataset of the missing value of the latent class
 $s_{i,k}$
and then use a blocked Gibbs sampler scheme (Ishwaran and James, Reference Ishwaran and James2001), consisting of a sequential draws of the parameters (exploiting their conditional conjugacy where possible). The steps of this data augmentation-blocked MCMC sampler are detailed in Appendix A. We implement this sampler in R (R Core Team, 2013) in order to have a full control over the MCMC sampling process. The code implementing the sampler is available at the GitHub repository https://github.com/ungolof/AVDPM.
6. Results
6.1. Convergence
The steps of the MCMC sampler devised for the analysis of the posterior distribution outlined in Section 5.3 are iterated 100,000 times. We discard the first 80,000 iterations (burn-in) and we thin the chain every 20 draws to reduce the degree of autocorrelation between iterations, resulting in a final posterior sample of 1000 draws. We run the sampler four times, based on sparse starting values, in order to assess the mixing of the chains and the convergence of the MCMC sampler toward a stationary distribution.
The trace plots of the parameters show that the chains converge toward a stationary distribution for all parameters, except for
 $\gamma^*_{k,1}$
,
 $\gamma^*_{k,2}$
,
 $\zeta^{A*}_{k}$
,
 $\zeta^{M*}_{k}$
, and
 $\pi_k$
for those mixture components where few units are allocated at each iteration of the MCMC sampler.
Furthermore, the overlap of the four trace plots for each parameter show a good mixing for all of those, and the marginal densities are all unimodal with similar location. The chains for the parameter
 $\alpha_j$
converge toward a stationary distribution, although they do not mix with one another. Nevertheless, the marginal posterior densities for this parameter from all the chains do not differ significantly. This result is likely to be connected with the correlation in the posterior distribution between
 $\alpha_j$
and
 $\gamma_{k,j}$
.
We do not analyze these two aspects for
 $\left(\gamma^*_{k,1}, \gamma^*_{k,2}, \zeta^{A*}_{k}, \zeta^{M*}_{k} \right)$
due to the label switching problem, which characterizes mixture distributions as discussed in Betancourt (Reference Betancourt2017), Ungolo et al. (Reference Ungolo, Kleinow and Macdonald2020) and Ungolo and van den Heuvel (Reference Ungolo and van den Heuvel2022). This issue affects solely the interpretation of the groups from the results of one chain compared to another. Indeed, when looking at the occupancy of the classes across iterations, we note a tendency of the sampler to have a similar number of units. Nevertheless, this does not represent an issue when making predictions, or when the purpose is to learn the global parameters, such as
 $\beta_j$
.
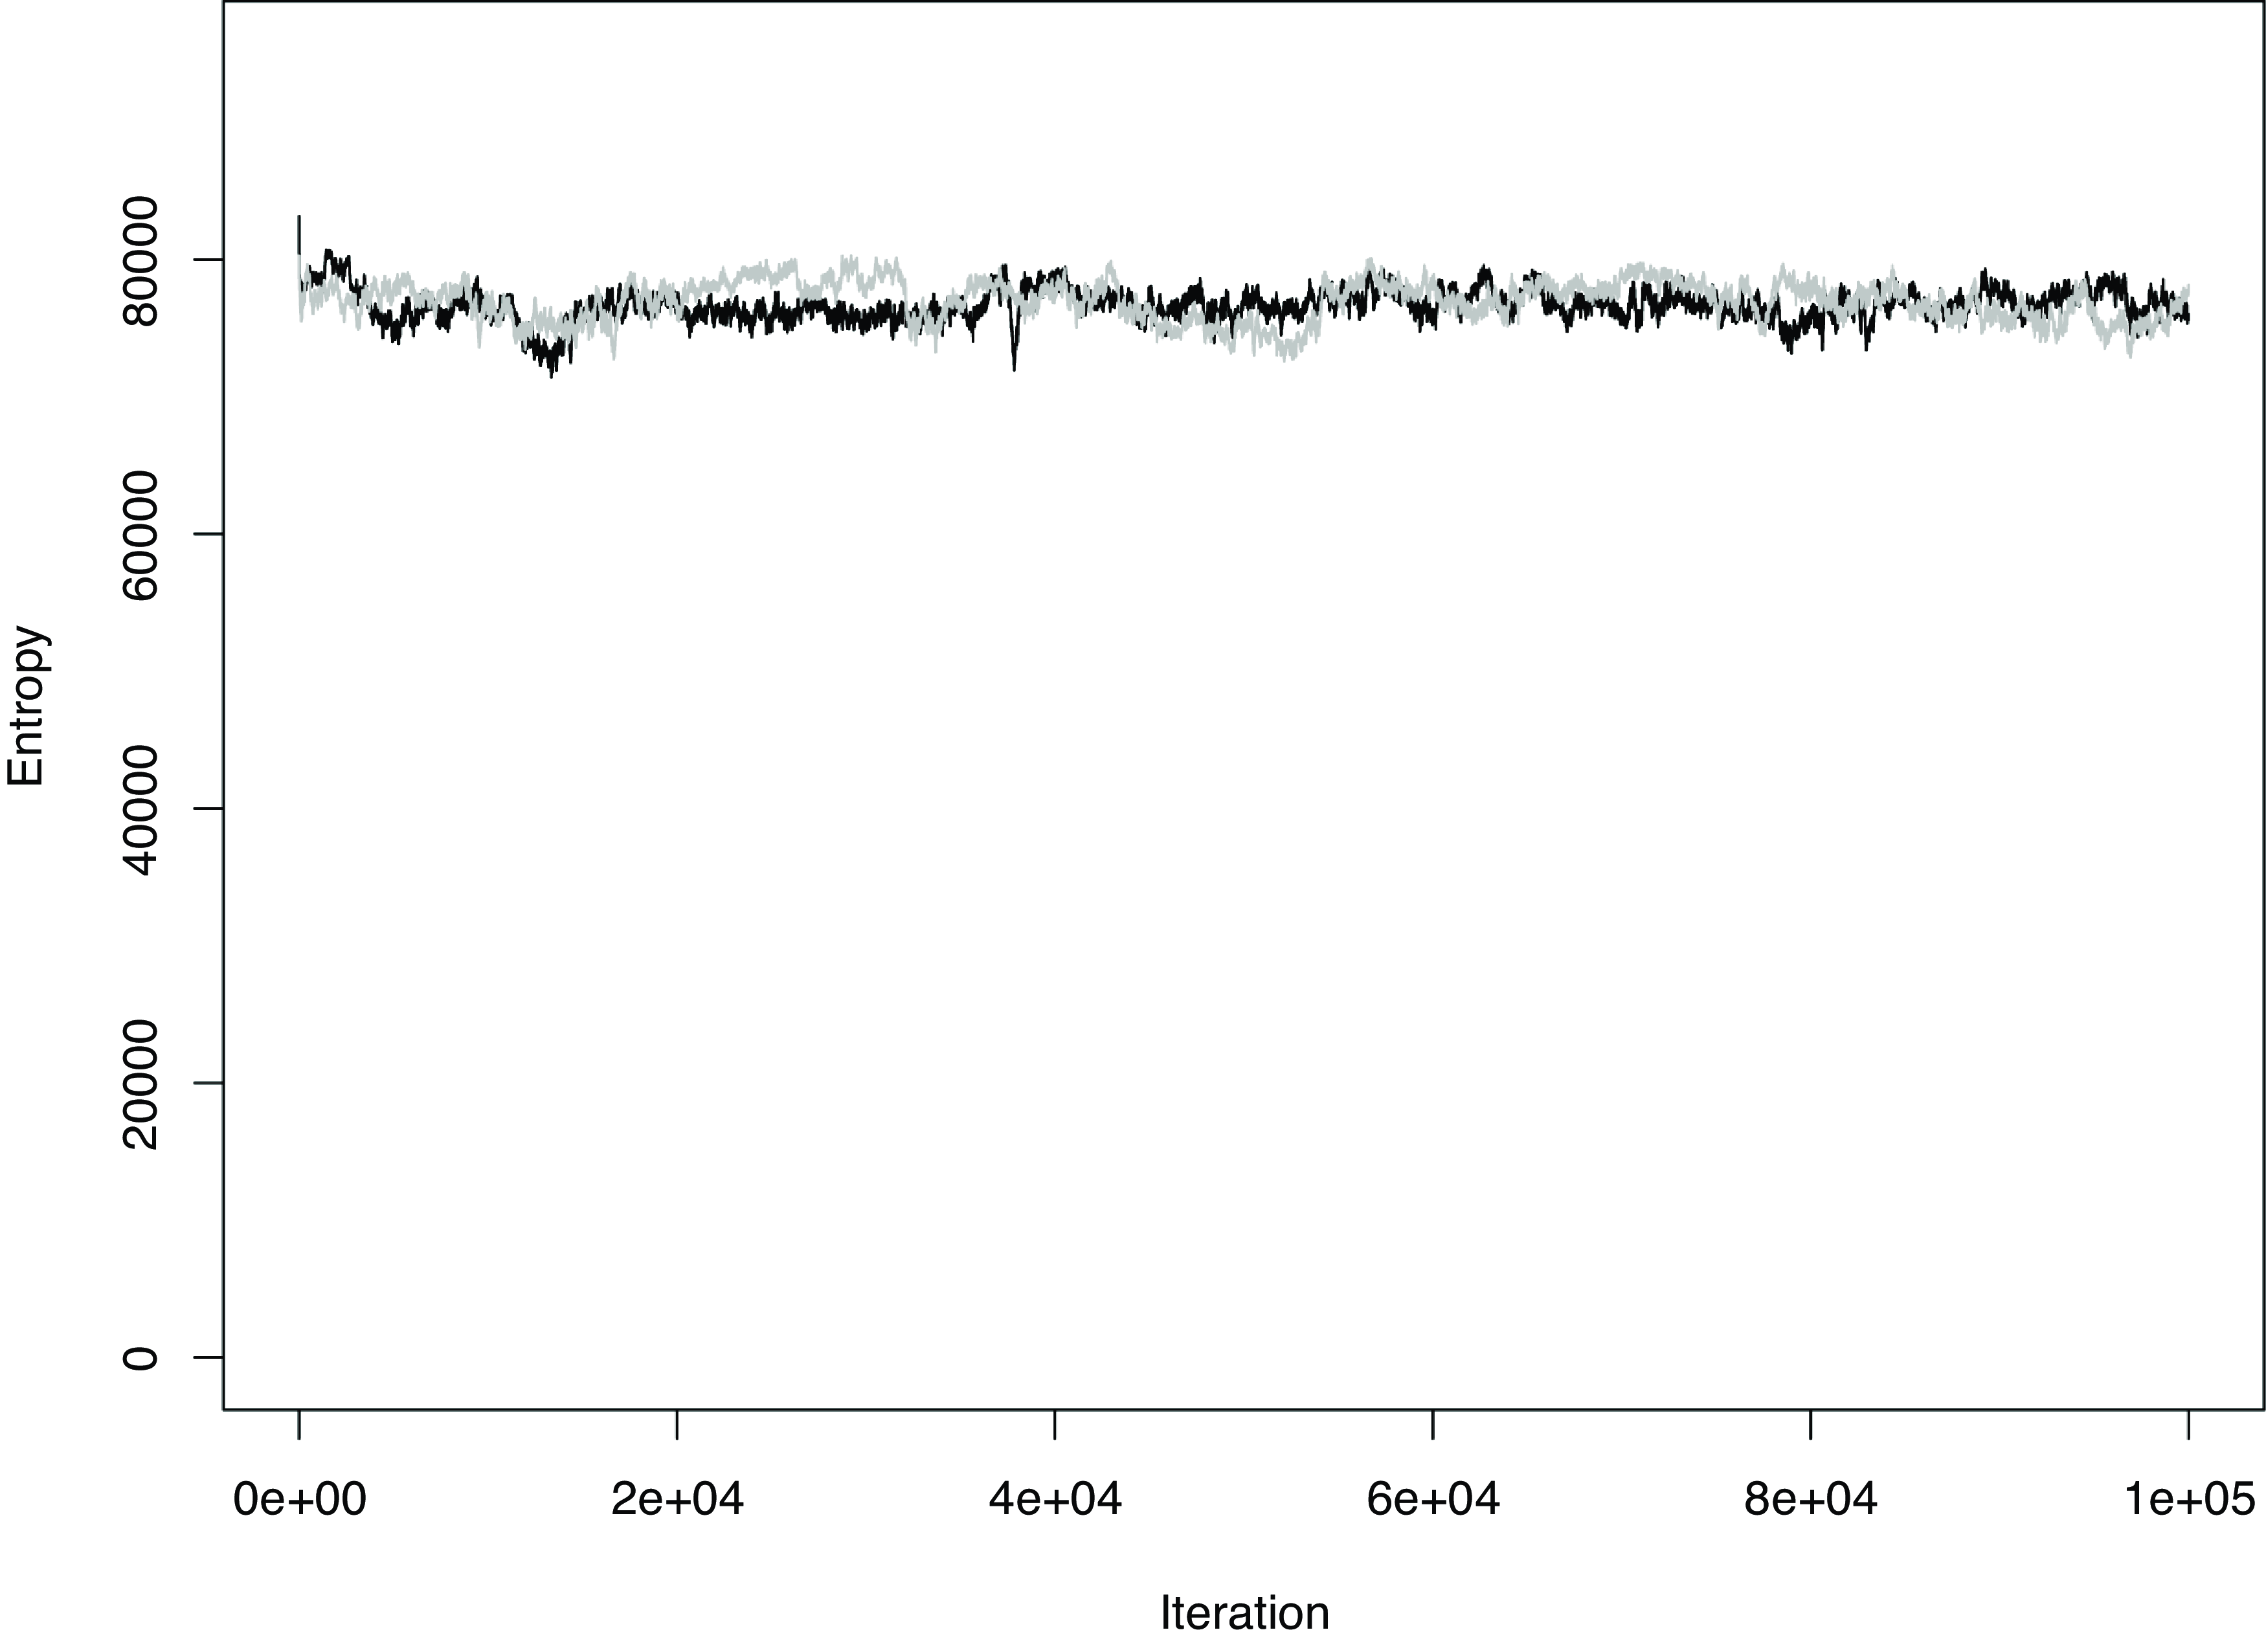
The overall convergence of the MCMC sampler is further analyzed through the trace plot of the clustering entropy shown in Figure 1 for two chains, as used for the analysis of mixture models (Beraha et al. Reference Beraha, Guglielmi, Quintana, Iorio, Eriksson and Yap2023). The entropy is calculated at the
 $\ell$
th iteration as follows:
 \begin{equation*} \text{Entropy}\left(\ell \right) = \displaystyle\sum_{k=1}^K n_k^{\left(\ell\right)} \cdot \ln n_k^{\left(\ell\right)}\end{equation*}
We note that all chains converge toward the same value. This is also observed when these chains are compared to those obtainable under the different prior distributions discussed in Section 5.1. This is an indication of the stability of the allocation of each couple to the groups characterized by the mixture components.
Trace plot of the entropy across all iterations of the MCMC sampler for two different runs.

6.2. Model analysis
Model results
The analysis of the histogram of the number of occupied classes across all iterations shows that a minimum of 8 and a maximum of 24 mixture components have at least one observation (Figure 2.1 in the Supplementary material). The posterior mean of the number of couples allocated in each mixture component shows that only six of these contain at least 2.5% (253 couples) of the total number of observations, and the sum of these six components totals 9,458 observations (93.5% of the total). These two results show that a truncation level of
 $K=25$
on the number of mixtures is sufficient to approximate the joint distribution of
 $\left(T_{i,1},T_{i,2},Z^A_{i},Z^M_{i} \right)$
.
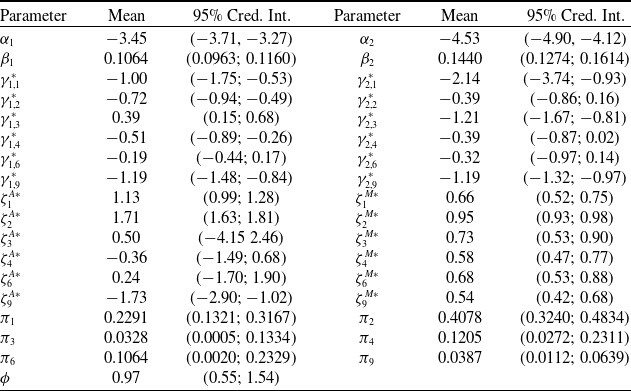
Table 1 shows the summary statistics of the posterior distribution of the most relevant parameters for the AVDPM approach of this paper. The log-baseline mortality (
 $\alpha$
) for females is lower than for males, as we can see also from the value of the 95% credible interval extremes which do not overlap. On the other hand, the female members of the couple are characterized by a larger sensitivity of the hazard function with respect to the age as measured by the parameter
 $\beta$
compared to males.
Posterior summaries of
 $\alpha$
,
 $\beta$
,
 $\gamma_{k}^*$
,
 $\zeta_{k}^{A*}$
,
 $\zeta_{k}^{M*}$
,
 $\pi_{k}$
for
 $k=1,2,3,4,6,9$
and
 $\phi$
.

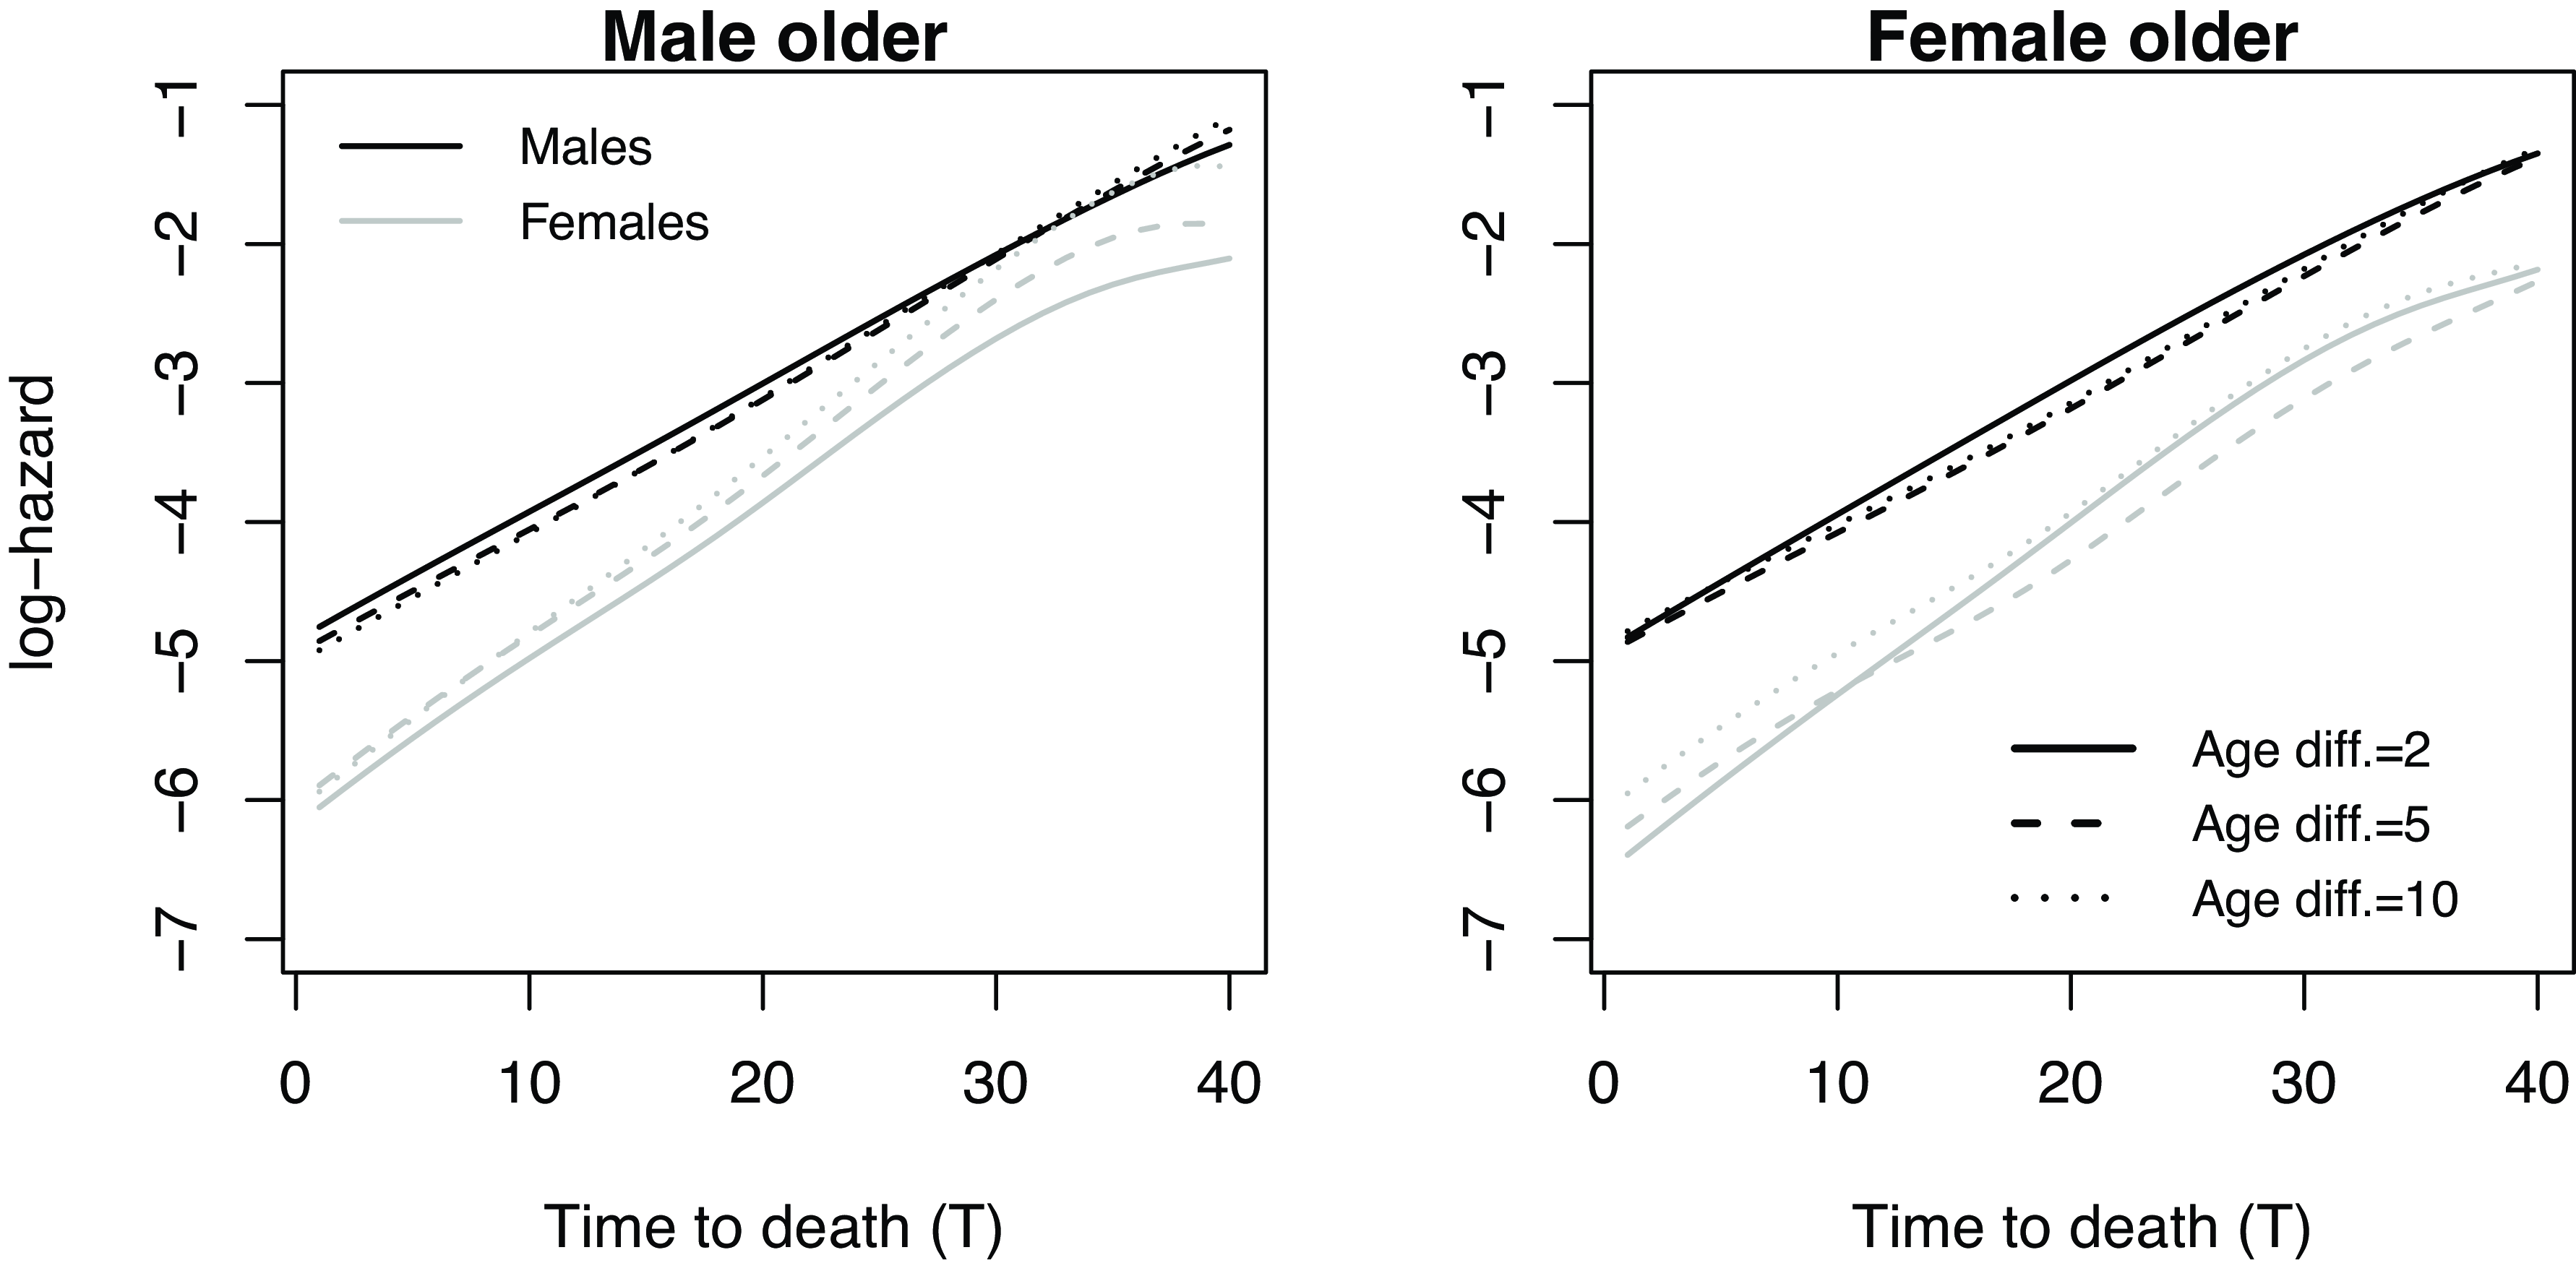
Hazard function for males (black) and females (gray) aged
 $x_{\cdot,j}=60$
within a couple for different values of the covariates male older and age difference (
 $\exp(Z^A)$
).

Six mixture components are associated with mixture weights
 $\pi_k$
whose posterior mean totals around 93.5% (
 $k=1,2,3,4,6,9$
), twelve have mixture weights below 0.1%, and the remaining ones are associated with mixture weights below 2%. Each component is characterized by different values of the class-specific parameters
 $\left(\gamma_{k,1}^*,\gamma_{k,2}^*,\zeta_{k}^{A*},\zeta_{k}^{M*} \right)$
.
These parameters, which capture the level of heterogeneity among the observations, allow to obtain hazard functions which can take a flexible shape, and where the effect of the other covariates is not necessarily proportional, nor monotone as we can see for the age difference in Figure 2. For example, at younger ages, when the female is five years older than the male couple member, the hazard function for the females is higher compared to the case of an age difference of two years, while this relationship reverts around age 75.
Analysis of the effect of couple-specific covariates
We plot the value of the log-hazard function of males and females for different values of
 $Z^A$
and
 $Z^M$
(Figure 2). This hazard function is calculated as follows:
 \begin{align}\nonumber \mu & \left(t \mid x_{\cdot,j},z^A, z^M;\;\alpha_j,\beta_j,\gamma^*_{\cdot,j}, \pi, \zeta^{A*}, \zeta^{M*} \right) &&\\[5pt] &= \frac{\displaystyle\sum_{k=1}^K \pi_k f \left(t \mid x_{\cdot,j};\;\alpha_j,\beta_j,\gamma^*_{k,j} \right) f\left(z^A \mid \zeta_{k}^{A*}, \sigma^2_{A} \right) \left({\zeta^{M*}_k}\right)^{z^M} \left(1 - {\zeta^{M*}_k}\right)^{1 - z^M} }{\displaystyle\sum_{k=1}^K \pi_k \left(1-F\left(t \mid x_{\cdot,j};\;\alpha_j,\beta_j,\gamma^*_{k,j} \right) \right)f\left(z^A \mid \zeta_{k}^{A*}, \sigma^2_{A} \right) \left({\zeta^{M*}_k}\right)^{z^M} \left(1 - {\zeta^{M*}_k}\right)^{1 - z^M}}\end{align}
where F denotes the cumulative distribution function of the random time to event T, hence
 $1-F$
denotes the survival function. Both numerator and denominator are averaged over the parameter draws.
As observed, this model allows for a nonmonotone effect of the covariates on the hazard function compared to a typical proportional hazard model approach as used in Deresa et al. (Reference Deresa, Van Keilegom and Antonio2022) and later analyzed to compare the models.
First of all, we notice that in the case where the male is the older couple member (
 $Z^M$
= 1), there is a slight shift upward of the hazard function at each age and for all all values of
 $Z^A$
. The only exception occurs when a male is aged between 60 and 68 years and
 $Z^A=10$
. A similar finding can be observed when analyzing the fitted hazard function for the females.
These results demonstrate how the model is capable to flexibly capture the effect of interactions between X,
 $Z^A$
and
 $Z^M$
without an explicit modeling assumption about these. We remark how these three variables do not have any linear relationship among them following the definition of
 $Z^A$
in Section 4.
Dependent lifetime events
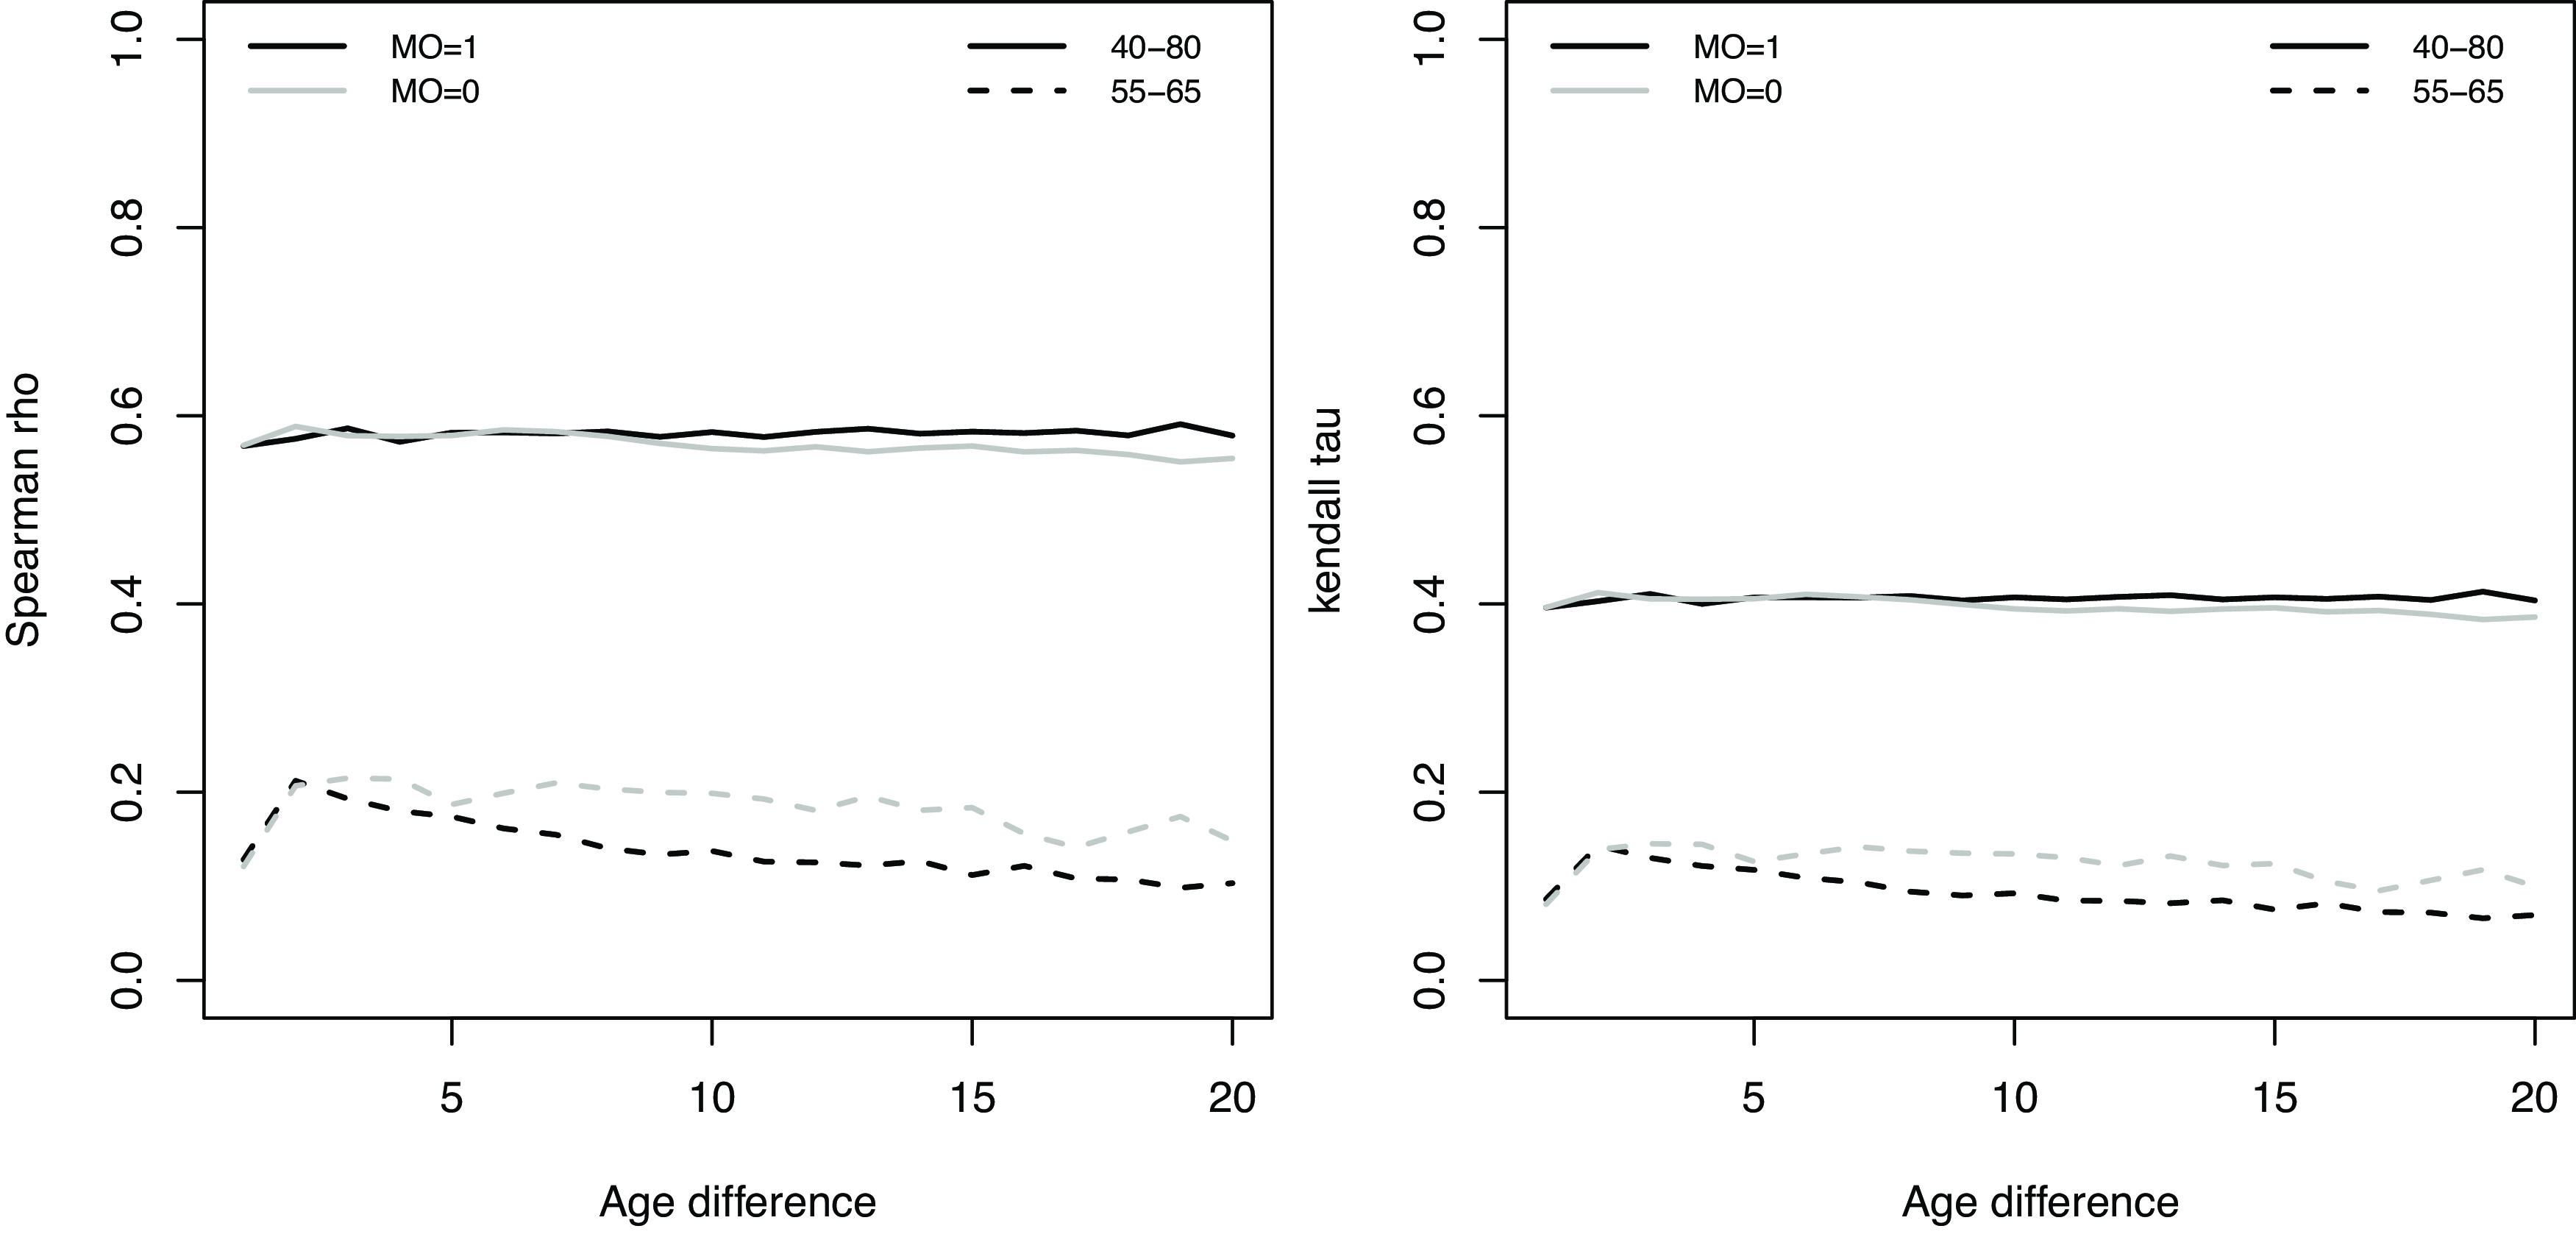
We analyze the statistical association between
 $T_1$
and
 $T_2$
by calculating the Spearman
 $\rho$
and the Kendall
 $\tau$
rank correlation coefficients over 20,000 random samples of
 $\left(T_1,T_2 \right)$
generated for each value of the age difference between 1 and 20 and of
 $Z^M$
(Figure 3). For each sample, we first draw the male age from a Uniform
 $\left(40, \ 80 \right)$
, with the female age following from the value of
 $Z^A$
and
 $Z^M$
.
Value of the Spearman
 $\rho$
(left panel) and of the Kendall
 $\tau$
(right panel) for different values of AD and MO.

We note how the model captures the presence of a positive statistical association between males and females lifetime. However, we note how this statistical association is unchanged with the values of
 $Z^A$
and
 $Z^M$
. As additional experiment, we then narrow the endpoints of the uniform distribution of the male individual age and repeat the same experiment. First, we note how both
 $\rho$
and
 $\tau$
are much smaller than the previous case, while
 $T_1$
and
 $T_2$
are still positively associated. For an age difference of one year,
 $\rho$
and
 $\tau$
are relatively larger and then have a constant value for every value of
 $Z^A$
, especially for the case where the female is the oldest couple member. In the opposite case where
 $Z^M=1$
, we observe a decreasing value of
 $\rho$
and
 $\tau$
as
 $Z^A$
increases. A different midpoint of the uniform distribution for the males age does not bring any change in the results. The modest impact of the age difference on the values of
 $\rho$
and
 $\tau$
might be due to the direct relationship between the age and the computation of the age difference. We remark how we perform this analysis on the basis of the solely available joint covariates. In any case, we could show how the AVDPM approach of this work can account for the Z-lifetime dependence as by-product.
Class analysis
The mixture modeling nature of AVDPM allows to classify the observations a posteriori, which can be helpful to learn further information about the resulting groups. A similar analysis was carried out in Ungolo and van den Heuvel (Reference Ungolo and van den Heuvel2024).
For this purpose, we use Bayes’ rule: for the ith couple, we calculate the probability to be in the kth class, denoted as
 $q_{i,k}$
, conditional on the observable data and the model parameters as follows:
 \begin{align} & q_{i,k} = \mathbb{P} \left(W_i=k \mid t_{i,1}, t_{i,2}, x_{i,1}, x_{i,2}, a_i, d_i,z^A_i,z^M_i \right)\nonumber \\[5pt] &\quad = \frac{\pi_k \Bigg[ \displaystyle\prod_{j=1}^2 f \left(t_{i,j} \mid x_{i,j},d_{i,j},a_{i};\;\alpha_j,\beta_j,\gamma^{*}_{k,j} \right) \Bigg] \,f\left(z^A_i \mid \zeta^{A*}_{k}, \sigma^{2}_{\text{A}} \right) \left({\zeta^{M*}_k}\right)^{z_i^M} \left(1 - {\zeta^{M*}_k}\right)^{1 - z_i^M}}{\displaystyle\sum_{h=1}^K \pi_h \left[ \displaystyle\prod_{j=1}^2 f \left(t_{i,j} \mid x_{i,j},d_{i,j},a_{i};\;\alpha_j,\beta_j,\gamma^{*}_{h,j} \right) \right] f\left(z^A_i \mid \zeta^{A*}_{h}, \sigma^{2}_{\text{A}} \right) \left({\zeta^{M*}_h}\right)^{z_i^M} \left(1 - {\zeta^{M*}_h}\right)^{1 - z_i^M}} \end{align}
where we average both the numerator and the denominator (separately) over the posterior draws of the parameters.
The ith couple is then hard-assigned to the kth class, by setting
 $w_i=k$
if
 $q_{i,k} \gt q_{i,h}$
for
 $h \neq k$
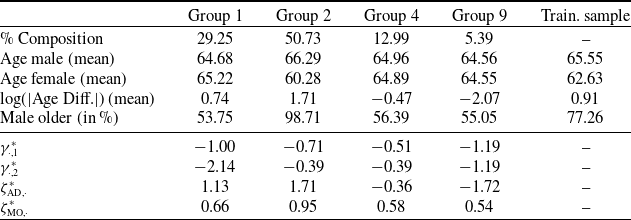
. The four largest classes total 98.4% of the observations. Table 2 illustrates the key features of groups 1, 2, 4, and 9, alongside the posterior mean of their class-specific parameters
 $\left(\gamma_{\cdot,1}^*,\gamma_{\cdot,2}^*,\zeta^{A*}_{\cdot},\zeta^{M*}_{\cdot} \right)$
. The difference between % Composition in Table 2 and
 $\pi$
is due to the specific classification rule we use.
Features of the four largest classes as determined by Bayes’ rule.

A first striking evidence is that these four classes have different features compared to the whole training sample. This means that we can be able to identify groups of couples that have distinctive features.
Around 50% of the couples compose Group 2, which is characterized by the largest log-absolute age difference among the four groups and the males are the oldest member of the couple for almost all observations.
Group 1 is characterized by the lowest percentage of couples where the males are the oldest couple members and where females have an average age higher than males. Furthermore, this group is characterized by the lowest hazard function for males and females, given their
 $\gamma^*$
posterior mean coefficient. Groups 4 and 9 are almost similar in terms of average age of the males and females therein, as well as the percentage of older males, while these differ in terms of the log-absolute age difference in couples.
Comparison with other models
The results of the AVDPM approach are compared with those obtainable by assuming a basic Gompertz (BG) hazard function, and with a proportional hazard model which includes all covariates (PH), similarly to Deresa et al. (Reference Deresa, Van Keilegom and Antonio2022)Footnote 1 which assume that:
 \begin{align}\nonumber \mu^{BG}\left(t \mid x_{i,j}; \alpha_j, \beta_j \right) &= \exp \left(\alpha_j + \beta_j \left(x_{i,j} - \bar{x} + t\right) \right) &&\\[5pt] \nonumber \mu^{PH}\left(t \mid x_{i,j}, z^A_i, z^M_i; \alpha_j, \beta_j,\delta_{j,1},\delta_{j,2} \right) &= \exp \left(\alpha_j + \beta_j \left(x_{i,j}- \bar{x} + t\right) + \delta_{j,1} z^A_i + \delta_{j,2} z^M_i \right)\end{align}
with parameters estimated by using maximum likelihood (results in Section 3 of the Supplementary Material). Therefore, under BG and PH models, we assume that conditional on the individual age, and the two common covariates, then the males and females lifetimes are independently distributed.
We quantitatively compare the three models by using the Akaike information criteria (Akaike, Reference Akaike1974) for the BG and PH models, and its generalization to a Bayesian framework with latent variables, known as widely applicable information criteria (WAIC, Watanabe, Reference Watanabe2009) for the AVDPM model. Their calculation is detailed in Appendix B. AIC and WAIC are computed for both the training sample and the held out part of the dataset (Table 3), and we chose the model which minimizes the value of these criteria.
AIC and WAIC of the models (the lowest value is shown in bold).

The inclusion of the covariates within a proportional hazard model has the effect to slightly improve the performance of the model compared to the base Gompertz hazard function, as earlier discussed. The benefit of including covariates is very negligible when looking at the out-of-sample performance of the PH model. Conversely, the AVDPM approach shows a smaller value of the WAIC for both the training and test dataset. Therefore, we conclude that the enhanced flexibility of AVDPM yields a better in sample and out of sample fit for these data.
These results are confirmed also when calculating AIC and WAIC by gender (Table 4). The use of the AVDPM yields a better in sample and out of sample performance for both males and females (the sum of the WAICs by gender is not equal to the overall WAIC as consequence of the Jensen’s inequality, as we can observe from its computation in Appendix B.).
AIC and WAIC of the models by gender (the lowest value is shown in bold).

7. Actuarial illustration of AVDPM
Let
 $Y_{x_1,x_2}\left(z\right)$
denote the present value of a cash flow of $1 paid continuously to a couple with characteristics z, where the male is aged
 $x_1$
and the female
 $x_2$
, as long as both are alive (joint status). Conversely, let
 $Y_{\overline{x_1,x_2}}\left(z\right)$
denote the present value of a $1 cash flow paid continuously until the death of the last survivor of a similar couple.
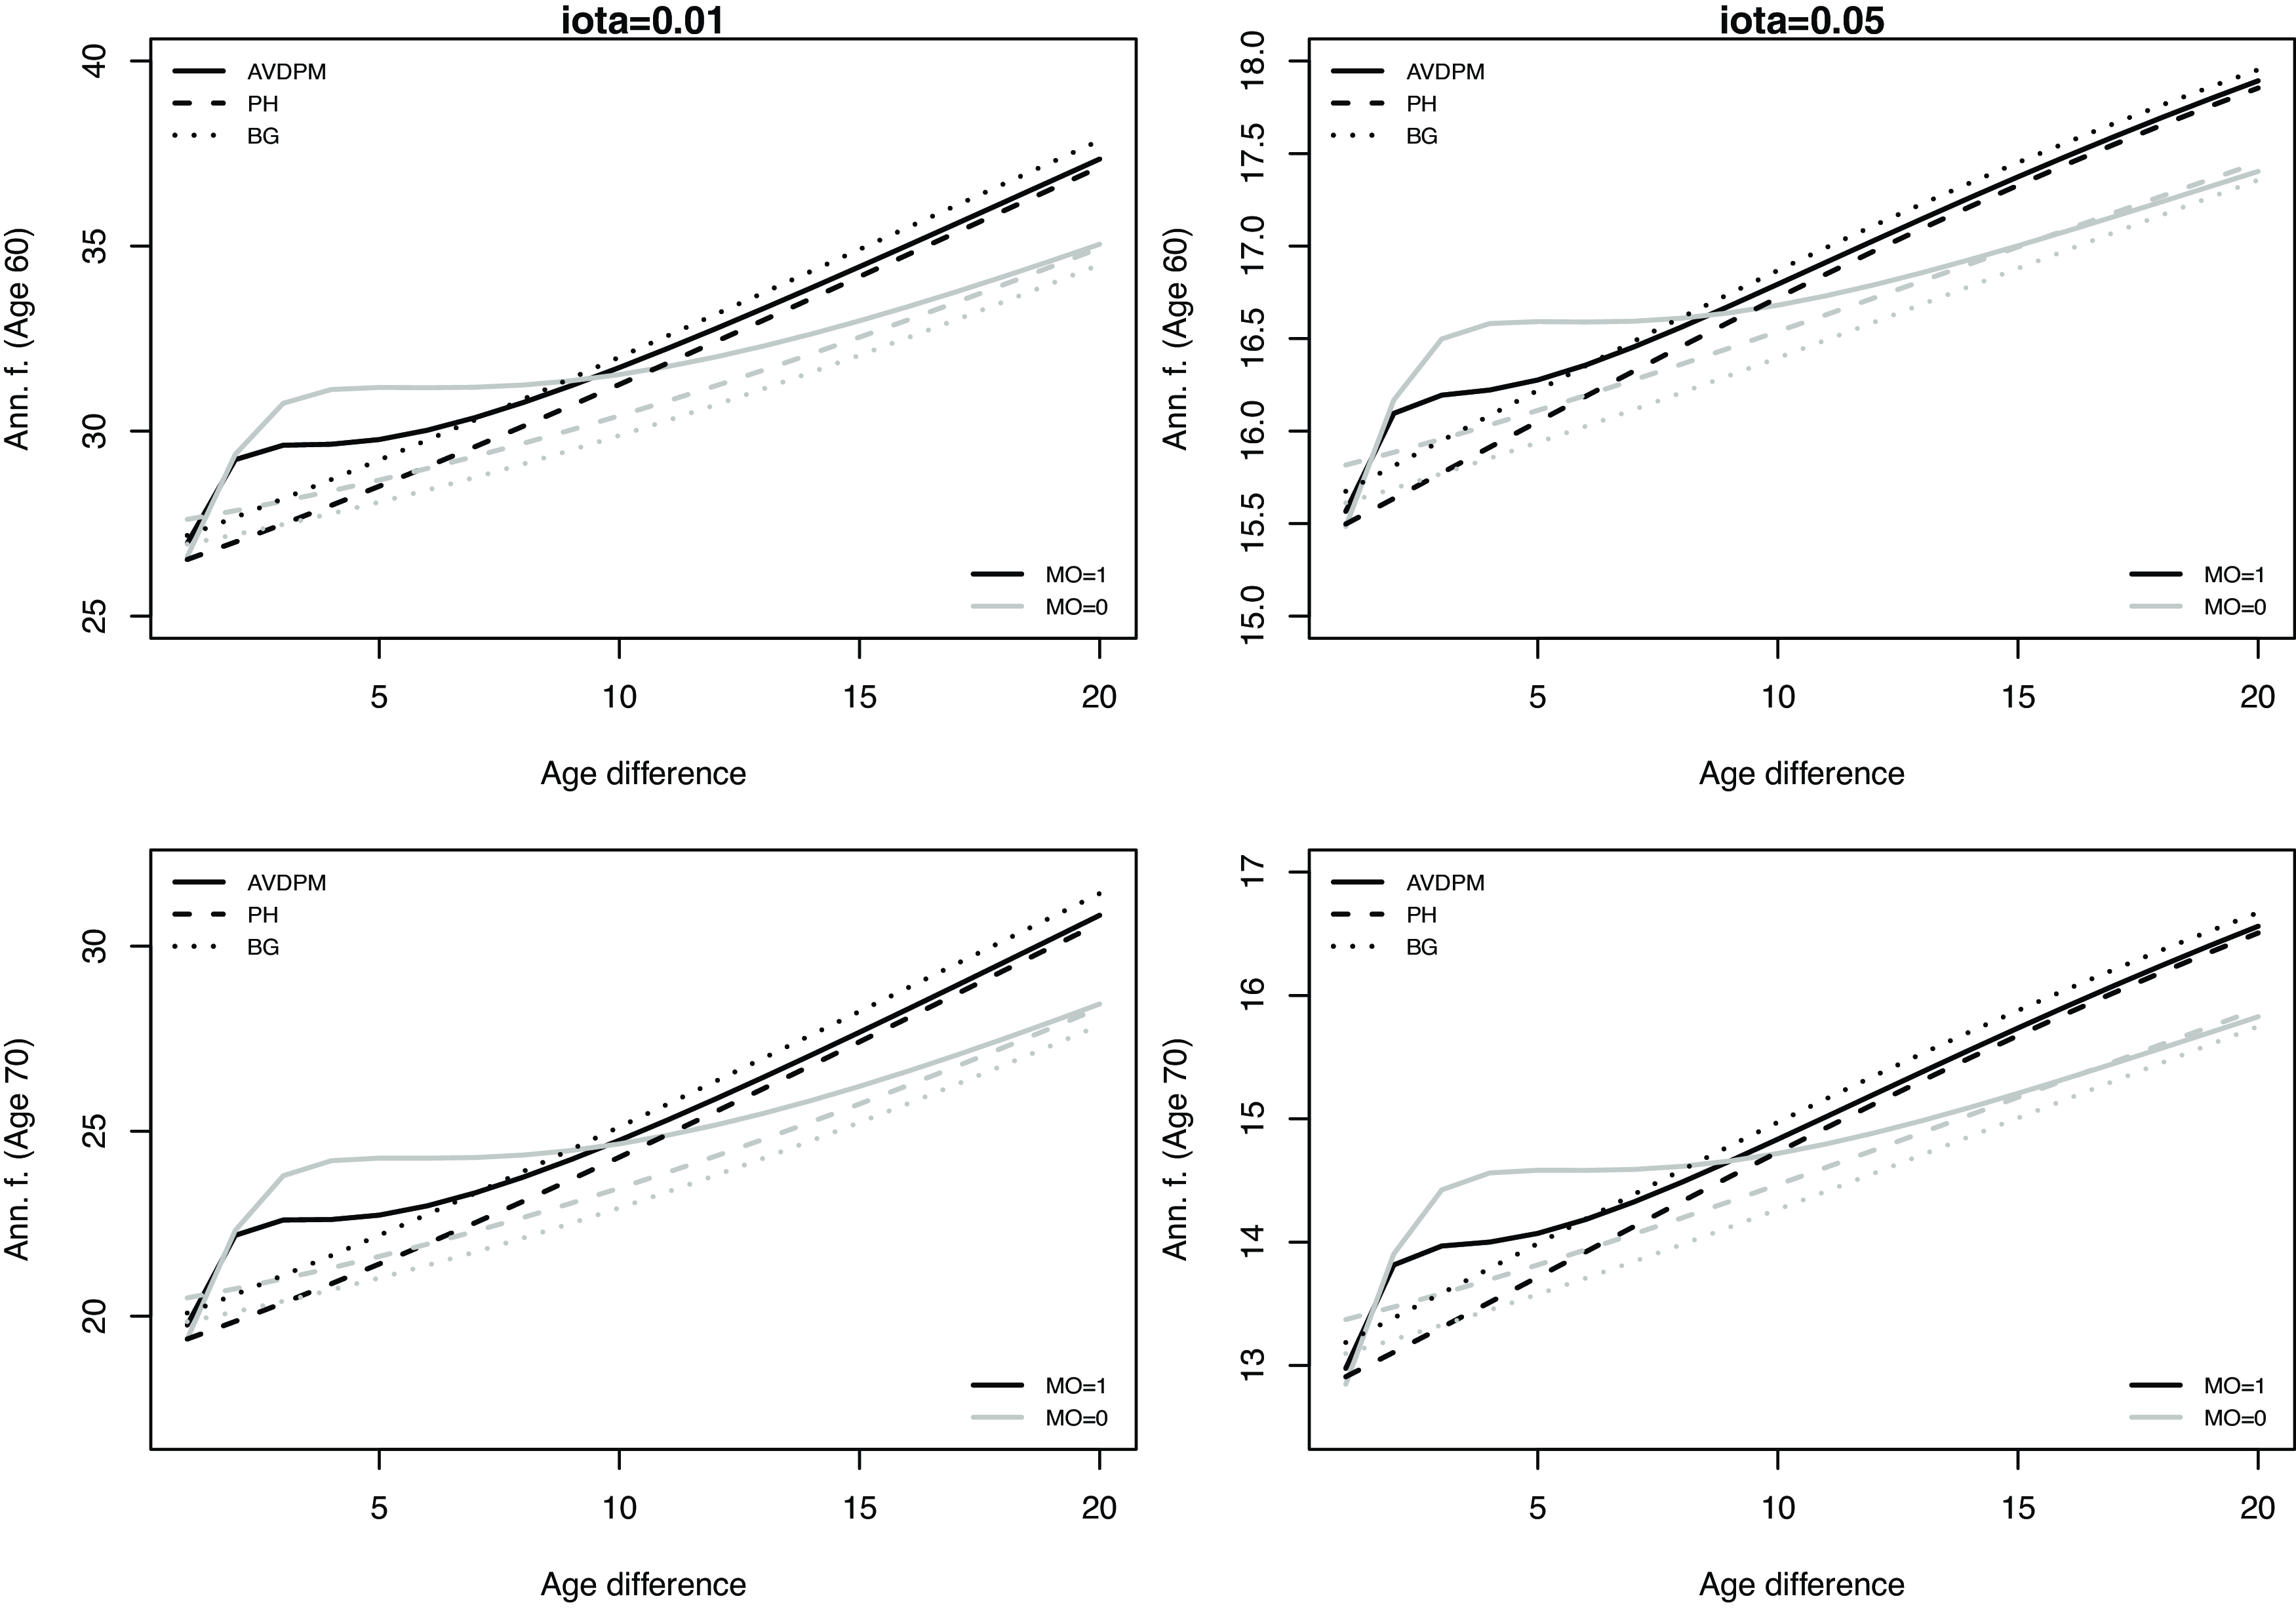
Last survivor annuity factor calculated using the AVDPM model (solid line), the PH model (dashed line), and the BG model (dotted line) for different values of age difference (
 $\exp \left( Z^A \right)$
, x-axis) and
 $Z^M$
when the oldest member is aged 60 (top panel) and 70 (bottom panel), for
 $\iota=1\%$
(left panel) and
 $\iota=5\%$
(right panel).

Assuming a force of interest
 $\iota$
, we can obtain the annuity factor of these cash flows as the expected value of
 $Y_{x_1,x_2}\left(z\right)$
and
 $Y_{\overline{x_1,x_2}}\left(z\right)$
(Dickson et al., Reference Dickson, Hardy and Waters2013):
 \begin{align}\nonumber \overline{a}_{x_1,x_2}\left(z\right) &= \mathbb{E}\left[Y_{x_1,x_2}\left(z\right) \right] = \int_0^{\infty} \exp \left(- \iota t \right) S_{x_1,x_2} \left(t \mid z \right) \mathrm{d}t; &&\\[5pt] \nonumber \overline{a}_{\overline{x_1,x_2}}\left(z\right) &= \mathbb{E}\left[Y_{\overline{x_1,x_2}}\left(z\right) \right]=\int_0^{\infty} \exp \left(- \iota t \right) S_{\overline{x_1,x_2}} \left(t \mid z \right) \mathrm{d}t,\end{align}
where the last survivor function
 $S_{\overline{x_1,x_2}} \left(t \mid z \right)$
was defined in Section 3, and
 $S_{x_1,x_2} \left(t \mid z \right)$
denotes the corresponding joint survivor function.
We analyze the effect of the covariates by comparing the annuity value under the AVDPM with the annuity value obtainable using the BG model in order to assess the effect of the covariates (as well as the dependence), and with the value obtained using the PH model to assess the effect of the dependence.
Figure 4 shows the value of the last survivor annuity factor obtainable under the AVDPM model and the other two competing models PH and BG described in Section 6. The annuity factors are evaluated at different male ages (60 and 70), different values of
 $Z=\left(Z^A,Z^M\right),$
and two different forces of interest
 $\iota=(0.01, 0.05)$
. The same plot for the joint life annuity is shown in Section 4 of the Supplementary Material (Figure 4.1).
The plot shows that the AVDPM annuity value is always higher than the value obtained using the PH model. When the male is the oldest couple member, the difference between these two values is highest when the age difference is within five years and narrows afterward. Such annuity price difference is also negligible for an age difference of one year. This means that neglecting the effect of the dependence has the effect of underpricing the last survivor annuity, especially when the age difference is between two and five years. A similar evidence is obtained when the female is the oldest couple member, whenever the male is lesser than ten years younger. This evidence is in contrast with earlier findings in the literature which use copula models to account for lifetime dependence. Using a Frank copula, Frees et al. (Reference Frees, Carriere and Valdez1996, Figure 3) show that the price of a last survivor annuity is higher under a model that assumes independent lifetimes, especially for couples where males and females have a similar age. Similarly, Dufresne et al. (Reference Dufresne, Hashorva, Ratovomirija and Toukourou2018, Figure 5.2) observe that the difference between independent and dependent lifetime (using a Clayton and a Joe copula) in the last-survivor life expectancy is highest for an age difference around 0, regardless the value of
 $Z^M$
.
When comparing the annuity factor using the AVDPM with the value obtained using a Base Gompertz model which assumes independent lifetimes and does not account for the effect of the covariates, we note that using latter in annuity pricing yields a lower value compared to the former when the female is the older couple member. Conversely, when
 $Z^M=1$
, the BG model underprices the last survivor annuity for an age difference lower than eight years. These evidences are consistent with the findings in Frees et al. (Reference Frees, Carriere and Valdez1996, Figure 4) and Deresa et al. (Reference Deresa, Van Keilegom and Antonio2022), where the latter analyze only the case of a couple where the male is aged 65 years and the female is two years younger.
A higher interest rate, which decreases the value of the annuity all else being equal, yields a reduction of both the effect of the dependence and the effect of the price difference due to the covariates. On the other hand, an increase in the age of the two heads (Figure 4 bottom panel) yields a higher percentage difference between the annuity value priced using the AVDPM model and the two models which assume independence. Therefore, in this latter case, the dependence turns out to have a higher impact in the pricing of the last survivor annuity.
For the joint life annuity, we note that when the male is the oldest couple member, the joint life annuity factor under the AVDPM is always higher compared to the value obtainable under the two models assuming independent lifetimes for an age difference higher than a year, and the same is obtained in case
 $Z^M=0$
and the age difference is between 1 and 15 years. This is obtained for both male ages and for the two interest rates hereby analyzed. Similarly, the copula-based dependence model analyzed by Deresa et al. (Reference Deresa, Van Keilegom and Antonio2022) yields a higher joint life annuity value compared to the independence case, although they focus on the sole case where males and females are again aged 65 and 63 years, respectively.
8. Extension of AVDPM to the analysis of the joint lifetimes of nonexchangeable units
So far, we have illustrated the method for the case of male–female couples. If we want to allow for groups with differing number of exchangeable members, as can be the case of collective insurance policies, we can extend the framework through a hierarchical model with additional layers.
Suppose the ith group includes
 $J_i$
members, with common set of variables
 $z_i$
, and individual (within group) characteristics
 $x_{i,j}$
(
 $j=1,\ldots,J_i$
). A possible solution is to model the group-specific joint distribution of the lifetimes and Z as:
 \begin{align} f\left(t_{i,1},\ldots,t_{i,J_i},z_i\mid x_i;\;\beta,G \right) = \int_{\Omega_{\gamma,\eta}} \left[\displaystyle\prod_{j=1}^{J_i} f\left(t_{i,j} \mid x_{i,j} ;\;\beta,\gamma_{i,j} \right) \right] f \left(z_i\mid\zeta_i \right) \mathrm{d}Q \left(\gamma_{i,j}\mid \eta_i \right) \mathrm{d}G \left(\eta_i, \zeta_i \right)\end{align}
where Q denotes a suitable distribution function for
 $\gamma_{i,j}$
, indexed by the group-specific parameter
 $\eta_i$
. Again, Q can also be a random draw from a Dirichlet process, although we would opt for a simpler known parametric form for computational reasons and also because we are indexing Q with a group-specific parameter
 $\eta_i$
whose distribution is drawn from a DP.
9. Conclusion
This paper contributes to the analysis of grouped dependent lifetime events by proposing a joint model for the lifetimes which is augmented of the distribution of the group-specific covariates. The inclusion of multivariate random effects captures the dependence among the lifetimes and between the lifetimes and the group-specific covariates. The use of DPM models enhances the flexibility of the random effects distribution and of the standard parametric assumptions for the covariates. The resulting AVDPM model has been illustrated through the empirical analysis of the mortality rates of the male and female members of a couple, which resulted in an enhanced in-sample and out-of-sample fitting performance. We showed how the model output can be used to infer additional information on the nature of the male–female mortality dependence and how this can affect the price of joint life and last survivor annuities.
The full Bayesian analysis of the AVDPM model of this work allows for the incorporation of the prior information about possible parameter values from the user. An alternative to a fully Bayesian analysis can be the assumption of a fixed, known number of mixture components and fit the model parameters using maximum likelihood. The results of similar analysis in the field can be used at this purpose. In addition, an approach based on the use of random effects allows for the specification of different parametric forms for the lifetime of each couple or group member.
One limitation of the AVDPM model is that it does not explicitly disentangle the lifetime dependence due to causal effects, as measured through group-specific covariates, from the dependence due to other sources of unobserved heterogeneity. This aspect can be potentially relevant from a pricing perspective (Gourieroux and Lu, Reference Gourieroux and Lu2015). One possibility, beyond the AVDPM of this work, is to consider a joint model à la Lu (Reference Lu2017) where the causal effect is part of the regression function, with couple-specific regression coefficients:
 \begin{align} \mu\left(t \mid x_{i,j},z_i ;\;\alpha_j, \beta_j, \delta_{i,j} \right) = \exp \left(\alpha_j+ \beta_j \left(x_{i,j} - \bar{x} +t \right) + \delta_{i,j}z_i + \gamma_{i,j}\right)\end{align}
with
 $\left(\delta_{i,1},\delta_{i,2} \right)$
eventually drawn from either a parametric distribution, or a discrete distribution following a Dirichlet process. In this way, we would be able to account for both the effect of
 $z_i$
on the individual lifetime, as well as the lifetime dependence given
 $z_i$
. We leave the further analysis of this model for future research.
Richer parametric structures for the Dirichlet processes are available in the literature, such as the generalized Dirichlet process prior (GDP, see Hjort, Reference Hjort2000), which generalizes the basic DP through an additional parameter, the dependent Dirichlet process (DDP, see MacEachern, Reference MacEachern2000) which allows for covariate dependent mixture weights
 $\pi_k$
and location of the random effects, and the dependent GDP of Barcella et al. (Reference Barcella, De Iorio, Favaro and Rosner2017) which combines DDP and GDPs. Such extensions can be useful to obtain a better characterization of the groups associated with the mixture components. On the other hand, these approaches would require more computationally intensive MCMC algorithms to estimate the posterior distribution of the parameters.
Another important future research avenue is the development of fast approximation techniques for the computation of posterior distribution of the parameters (for example, based on variational inference techniques (Blei et al., Reference Blei, Kucukelbir and McAuliffe2016)), which would allow to quickly explore different parametric models for the data on hand.
Acknowledgments
We wish to thank the Society of Actuaries, through the courtesy of Edward (Jed) Frees and Emiliano Valdez, for allowing the use of the data in this paper.
Supplementary material
The supplementary material for this article can be found at https://doi.org/0.1017/asb.2024.34
A. Data Augmentation MCMC sampler
Below, we outline the steps of the data augmentation MCMC scheme to sample the parameters from the posterior distribution:
-
Step 0: Set an initial value for the parameters
 $\left(\alpha^{(0)},\beta^{(0)},\gamma^{*(0)}, \zeta^{A*(0)},\zeta^{M*(0)}, \sigma^{2(0)}_{A}, \Sigma_{\gamma}^{(0)}, m_{A}^{(0)}, s^{2(0)}_{A}, \phi^{(0)}, \psi^{(0)} \right)$
;
For each iteration
$\ell=1,\ldots,M$
: -
Step 1: For each unit sample, the mixture component
$w_i^{(\ell)}$
(
$W_i^{(\ell)} \in \lbrace 1,\ldots,K \rbrace$
) from a discrete distribution with probability:(A.1)where
\begin{align} & \mathbb{P} \left(W_i^{(\ell)}=k \mid t_{i,1},t_{i,2}, x_{i,1}, x_{i,2}, a_i, d_{i,1},d_{i,2}, z^A_i, z^M_i \right) \\[5pt]\nonumber &= \frac{\pi_k^{(\ell-1)} \Bigg[ \displaystyle\prod_{j=1}^2 f \left(t_{i,j} \mid x_{i,j},d_{i,j},a_{i};\;\alpha_j^{(\ell-1)},\beta_j^{(\ell-1)},\gamma^{*(\ell-1)}_{k,j} \right) \Bigg]f \left(z_i \mid \zeta^{*(\ell-1)}_k \right)}{\displaystyle\sum_{q=1}^K \pi_q^{(\ell-1)} \Bigg[ \displaystyle\prod_{j=1}^2 f \left(t_{i,j} \mid x_{i,j},d_{i,j},a_{i};\;\alpha_j^{(\ell-1)}, \beta_j^{(\ell-1)},\gamma^{*(\ell-1)}_{q,j} \right) \Bigg] f \left(z_i \mid \zeta^{*(\ell-1)}_q \right)},\end{align}
(A.2)
\begin{align} f \left(z_i \mid \zeta^{*(\ell)}_k \right) = f\left(z^A_i \mid \zeta^{A*(\ell)}_{k}, \sigma^{2(\ell)}_{A} \right) \left(\zeta^{M*(\ell)}_{k} \right)^{z^M_i} \left(1- \zeta^{M*(\ell)}_{k} \right)^{1-z^M_i}.\end{align}
Hence,
$s_{i,k}^{(\ell)}=1$
if
$w_i^{(\ell)}=k$
and 0 otherwise; -
Step 2: Sample the stick-breaking weights
$\psi$
and update
$\pi$
:-
Step 2.1: Sample
$\psi_k^{(\ell)}$
(
$k=1,\ldots,K-1$
, with
$\psi_K=1$
): (A.3)
\begin{align} \psi_k^{(\ell)} \sim \text{Beta}\left( 1 + \displaystyle\sum_{i=1}^n \mathrm{1}_{\left[w_i^{(\ell)}=k\right]}, \enspace \phi^{(\ell-1)} + \displaystyle\sum_{i=1}^n \mathrm{1}_{\left[w_i^{(\ell)} \gt k\right]} \right)\end{align}
-
Step 2.2: Update
$\pi_k$
: (A.4)
\begin{align} \pi_k^{(\ell)} = \psi_k^{(\ell)} \displaystyle\prod_{j \lt k} \left(1 - \psi_j^{(\ell)} \right)\end{align}
-
-
Step 3: Sample
$\exp\left(\alpha_j^{(\ell)}\right)$
from a conjugate Gamma distribution with shape
$\Gamma_{j,1}$
and rate
$\Gamma_{J,2}$
: (A.5)
\begin{align}\nonumber \Gamma_{j,1} &= 1 + \displaystyle\sum_{i=1}^n d_{i,j} &&\\[5pt] \Gamma_{j,2} &= 1 + \displaystyle\sum_{i=1}^n \frac{\exp\left[ \beta_j^{(\ell-1)} \left(t_{i,j} + a_i \right)\right] - \exp\left(\beta_j^{(\ell-1)} a_i \right)}{\beta_j^{(\ell-1)}} \exp \left(\beta_j^{(\ell-1)} \left(x_{i,j}-\bar{x}\right) + \gamma^{*(\ell-1)}_{w_i^{(\ell)},j} \right)\end{align}
-
Step 4: Sample
$\beta_{j}^{(\ell)}$
(
$j=1,2$
) using the acceptance–rejection sampling method:-
Step 4.1: Sample
$\beta_j^*$
from a truncated normal proposal distribution q with mean
$\beta_j^{(\ell-1)}$
and variance
$\sigma^{2(\ell-1)}_{p,j}$
. The proposal distribution has truncation bounds given by the parameters of the uniform distribution specified as prior. The variance of the proposal distribution is iteratively updated using the robust adaptive metropolis (RAM) algorithm of Vihola (Reference Vihola2012), described in Step 4.4; -
Step 4.2: Compute the ratio
(A.6)where
\begin{align} \!\!\!\!\!\!\! r' = \frac{\left[ \displaystyle\prod_{i=1}^n f \left(t_{i,j} \mid x_{i,j},d_{i,j},a_{i};\;\alpha_j^{(\ell)}, \beta_j^{*},\gamma^{*(\ell-1)}_{j,w_{i}^{(\ell)}} \right) \right] p\left( \beta_j^{*}\mid 0.1,0.25 \right) q_{10^{-5},5}\left(\beta^{(\ell-1)}_j \mid \beta^{*}_j,\sigma^{2(\ell-1)}_{p,j} \right) }{ \left[\displaystyle\prod_{i=1}^n f \left(t_{i,j} \mid x_{i,j},d_{i,j},a_{i};\;\alpha_j^{(\ell)},\beta_j^{(\ell-1)},\gamma^{*(\ell-1)}_{j,w_{i}^{(\ell)}} \right) \right] p\left(\beta^{(\ell-1)}_j \mid 0.1,0.25 \right) q_{10^{-5},5}\left(\beta^{*}_j \mid \beta^{(\ell-1)}_j,\sigma^{2(\ell-1)}_{p,j} \right) } \end{align}
$q_{10^{-5},5}\left(a \mid b,c \right)$
denotes the density of the proposal distribution at the value of a, with mean b and variance equal to c;
-
Step 4.3: Set:
(A.7)
\begin{align} \beta_j^{(\ell)} = \begin{cases} \beta_j^* & \quad \text{w.p. min}\left(r',1\right) \\[5pt] \beta_j^{(\ell-1)} & \quad \text{w.p. } 1-\text{min}\left(r',1\right) \end{cases} \end{align}
-
Step 4.4: Update the standard deviation of the proposal distribution
$\sigma_{p,j}$
: (A.8)
\begin{align} \sigma^{(\ell)}_{p,j} = \sigma^{(\ell-1)}_{p,j} \sqrt{ 1 + \ell^{-0.6} \left( \text{min}\left(r',1\right) - 0.234 \right)}\end{align}
The parameter 0.6 is chosen following Vihola (Reference Vihola2012), who suggests a value between 0.5 and 1, while 0.234 is the desired acceptance probability, chosen following Roberts et al. (Reference Roberts, Gelman and Gilks1997);
-
-
Step 5: Sample
$\gamma^*$
using the acceptance–rejection sampling method:-
Step 5.1: For
$k=1,\ldots,K$
sample
$\gamma_{k}'=\left(\gamma_{k,1}',\gamma_{k,2}'\right)^\top$
from a bivariate Normal proposal distribution q with mean
$\gamma_{k}^{*(\ell-1)}=\left(\gamma_{k,1}^{*(\ell-1)},\gamma_{k,2}^{*(\ell-1)}\right)^\top$
and variance-covariance matrix
$\boldsymbol{\Sigma}^{(\boldsymbol\ell-1)}_{\textbf{p},\textbf{k}}$
:-
Step 5.1.1: Sample
$\textbf{h}^{(\boldsymbol\ell)} \sim \text{MVN} \left( \textbf{0}_2, \textbf{I}_2 \right)$
, where
$\textbf{0}_2$
is a column vector of zeros, and
$\textbf{I}_2$
denotes the
$2\times 2$
identity matrix; -
Step 5.1.2: Set
$\gamma_{k}' = \gamma_{k}^{*(\ell-1)} + \textbf{L}_{\textbf{k}}^{(\boldsymbol\ell-\textbf{1})} \textbf{h}^{(\boldsymbol\ell)}$
,where
$\textbf{L}^{(\boldsymbol\ell-\textbf{1})}_{\textbf{k}}$
is the lower triangular matrix denoting the Cholesky decomposition of
$\boldsymbol{\Sigma}_{\textbf{p},\textbf{k}} = \textbf{L}_{\textbf{k}}\textbf{L}_{\textbf{k}}^{\boldsymbol\top}$
. The variance–covariance matrix of the proposal distribution is again updated using the RAM algorithm described in Step 5.4 for its multivariate version;
-
-
Step 5.2: Compute the ratio:
(A.9)
\begin{align} \!\!\!\!\!\!\! r'' = \frac{p\left(\gamma_k' \mid \textbf{0},\Sigma_{\gamma}^{(\ell-1)} \right)\left[\displaystyle\prod_{\lbrace i:w_i^{(\ell)}=k \rbrace} \displaystyle\prod_{j=1}^2 f_j \left(t_{i,j} \mid x_{i,j},d_{i,j},a_{i};\;\alpha_j^{(\ell)},\beta_j^{(\ell)},\gamma_{k,j}' \right)\right]q\left(\gamma_{k}^{'} \mid \gamma_{k}^{*(\ell-1)}, \boldsymbol\Sigma^{(\boldsymbol\ell-\textbf{1})}_{\textbf{p},\textbf{k}} \right)}{p\left(\gamma_k^{*(\ell-1)} \mid \textbf{0},\Sigma_{\gamma}^{(\ell-1)} \right) \left[\displaystyle\prod_{\lbrace i:w_i^{(\ell)}=k \rbrace} \displaystyle\prod_{j=1}^2 f_j \left(t_{i,j} \mid x_{i,j},d_{i,j},a_{i};\;\alpha_j^{(\ell)},\beta_j^{(\ell)},\gamma^{*(\ell-1)}_{k,j} \right)\right]q\left(\gamma_{k}^{*(\ell-1)} \mid \gamma_{k}^{'},\boldsymbol\Sigma^{(\boldsymbol\ell-\textbf{1})}_{\textbf{p},\textbf{k}} \right)} \end{align}
-
Step 5.3: Set:
(A.10)
\begin{align} \left(\gamma_{k,1}^{*(\ell)},\gamma_{k,2}^{*(\ell)}\right) = \begin{cases} \left(\gamma_{k,1}',\gamma_{k,2}'\right) & \quad \text{w.p. min}\left(r'',1\right) \\[5pt] \left(\gamma_{k,1}^{*(\ell-1)},\gamma_{k,2}^{*(\ell-1)}\right) & \quad \text{w.p. } 1-\text{min}\left(r'',1\right) \end{cases} \end{align}
-
Step 5.4: Update the lower triangular Cholesky factor of
$\boldsymbol\Sigma_{\textbf{p},\textbf{k}}$
:-
Step 5.4.1: Compute
$\boldsymbol\Sigma^{(\boldsymbol\ell)}_{\textbf{p},\textbf{k}}$
: (A.11)where
\begin{align} \boldsymbol\Sigma^{(\boldsymbol\ell)}_{\textbf{p},\textbf{k}} = \textbf{L}_{\textbf{k}}^{(\boldsymbol\ell-1)} \left(\textbf{I}_{\textbf{2}} + \ell^{-0.6} \left(\text{min}\left(r'',1\right) - 0.234 \right) \frac{\textbf{h}^{(\boldsymbol\ell)}{\textbf{h}^{(\boldsymbol\ell)}}^{\boldsymbol\top}}{ ||\textbf{h}^{(\boldsymbol\ell)}||^2} \right)\textbf{L}_{\textbf{k}}^{(\boldsymbol\ell-\textbf{1})\boldsymbol\top} \end{align}
$||\textbf{h}||$
denotes the Euclidean norm of
$\textbf{h}$
;
-
Step 5.4.2: Compute
$\textbf{L}_{\textbf{k}}^{(\boldsymbol\ell)}$
as the Cholesky factor of
$\boldsymbol\Sigma^{(\boldsymbol\ell)}_{\textbf{p},\textbf{k}}$
;
-
-
-
Step 6: Sample
$\Sigma_{\gamma}$
from the conjugate posterior which is the Inv–Wishart distribution with degrees of freedom
$\Lambda_1$
and scale matrix
$\Lambda_2$
, calculated as:(A.12)
\begin{align} \Lambda_1 &= 5 + \displaystyle\sum_{k=1}^K \mathrm{1}_{\left[ n_k^{(\ell)} \gt 0 \right]} &&\end{align}
where
\begin{align}\nonumber \Lambda_2 &= \begin{bmatrix} 2 & 1.2 \\[0.3em] 1.2 & 2 \end{bmatrix} + \displaystyle\sum_{k=1}^K \mathrm{1}_{\left[ n_k^{(\ell)} \gt 0 \right]} \gamma^{*(\ell)}_k {\gamma^{*(\ell)}_k}^\top\end{align}
$n_{k}^{(\ell)} = \displaystyle\sum_{i=1}^n s_{i,k}^{(\ell)} = \displaystyle\sum_{i=1}^n \mathrm{1}_{\left[ w_i^{(\ell)} = k \right]}$
;
-
Step 7: Sample
$\zeta_{k}^{A*(\ell)}$
(
$k=1,\ldots,K$
) from a conjugate
$\text{N}\left( \Lambda_{3,k}, \Lambda_{4,k} \right)$
distribution, where:
\begin{align}\nonumber \Lambda_{3,k} &= \Lambda_{4,k} \left(\frac{ \displaystyle\sum_{\lbrace i:w_i^{(\ell)}=k \rbrace} z^A_i }{\sigma^{2(\ell-1)}_{A}} + \frac{m_{A}^{(\ell-1)}}{s^{2(\ell-1)}_{A}}\right) &&\\[5pt] \nonumber \Lambda_{4,k} &= \left(\frac{n_k^{(\ell)}}{\sigma^{2(\ell-1)}_{A}} + \frac{1}{s^{2(\ell-1)}_{A}}\right)^{-1}\end{align}
-
Step 8: Sample
$\zeta_{k}^{M*(\ell)}$
(
$k=1,\ldots,K$
) from a conjugate
$\text{Beta}\left( \Lambda_{5,k}, \Lambda_{6,k} \right)$
distribution, with posterior parameters calculated as follows:
\begin{align}\nonumber \Lambda_{5,k} &= 13.31+ \displaystyle\sum_{\lbrace i:w_i^{(\ell)}=k \rbrace} z^M_i &&\\[5pt] \nonumber \Lambda_{6,k} &= 4.44 + \displaystyle\sum_{\lbrace i:w_i^{(\ell)}=k \rbrace} \left(1-z^M_i\right)\end{align}
-
Step 9: Sample
$m_{A}^{(\ell)}$
from a conjugate
$\text{N}\left(\Lambda_7, \Lambda_8 \right)$
distribution, where:
\begin{align}\nonumber \Lambda_7 &= \Lambda_8 \frac{ \displaystyle\sum_{\lbrace k: \enspace n_k^{(\ell)} \gt 0 \rbrace} \zeta_{k}^{A*(\ell)} }{s^{2(\ell-1)}_{A}} &&\\[5pt] \nonumber \Lambda_8 &= \left(2 + \frac{\displaystyle\sum_{k=1}^K \mathrm{1}_{\left[ n_k^{(\ell)} \gt 0 \right]} }{s^{2(\ell-1)}_{A}}\right)^{-1}\end{align}
-
Step 10: Sample
$\sigma^{2(\ell)}_{A}$
from a conjugate Inv-Gamma
$\left( \Lambda_9^{(\ell)}, \Lambda_{10}^{(\ell)} \right)$
distribution where:
\begin{align}\nonumber \Lambda_9^{(\ell)} &= 2+0.5n &&\\[5pt] \nonumber \Lambda_{10}^{(\ell)} &= 1+ \displaystyle\sum_{i=1}^n \left(z_i^A - \zeta^{A*(\ell)}_{w_i^{(\ell)}} \right)^2\end{align}
-
Step 11: Sample
$s^{2(\ell)}_{A}$
from a conjugate Inv-Gamma
$\left(\Lambda_{11}^{(\ell)}, \Lambda_{12}^{(\ell)} \right)$
distribution where:
\begin{align}\nonumber \Lambda_{11}^{(\ell)} &= 3+0.5 \displaystyle\sum_{k=1}^K \mathrm{1}_{\left[ n_k^{(\ell)} \gt 0 \right]} &&\\[5pt] \nonumber \Lambda_{12}^{(\ell)} &= 0.5+ \displaystyle\sum_{\lbrace k: n_k^{(\ell)} \gt 0 \rbrace} \left( \zeta^{A*(\ell)}_{k} - m^{(\ell)}_{A} \right)^2\end{align}
-
Step 12: Sample
$\phi$
by following the steps outlined in Escobar and West (Reference Escobar and West1995):-
Step 12.1: Sample
$\epsilon \sim \text{Beta}\left(\phi^{(\ell-1)}+1,n \right)$
; -
Step 12.2: Sample
$ B \sim \text{Bernoulli}\left( \pi_{\epsilon}\right) $
, where (A.13)
\begin{align} \pi_{\epsilon} = \frac{ \displaystyle\sum_{k=1}^K \mathrm{1}_{\left[ n_k^{(\ell)} \gt 0 \right]} }{n \left(1 - \ln \epsilon\right) + \displaystyle\sum_{k=1}^K \mathrm{1}_{\left[ n_k^{(\ell)} \gt 0 \right]} }\end{align}
-
Step 12.3: Sample
$\phi$
: (A.14)
\begin{align} \phi^{(\ell)} \sim & \mathrm{1}_{[B=1]} \text{Gamma} \left( 1 +\displaystyle\sum_{k=1}^K \mathrm{1}_{\left[ n_k^{(\ell)} \gt 0 \right]}, 1 - \ln \epsilon \right) \\[5pt]\nonumber & + \mathrm{1}_{[B=0]} \text{Gamma} \left( \displaystyle\sum_{k=1}^K \mathrm{1}_{\left[ n_k^{(\ell)} \gt 0 \right]}, 1 - \ln \epsilon \right)\end{align}
-


B. Computation of AIC and WAIC
Let
 $\hat{\theta}$
denote the set of the parameter estimates using maximum likelihood for BG and PH, and
 $\theta^{(\ell)}$
the retained
 $\ell$
th draw from the posterior distribution of the parameters of the AVDPM approach. AIC and WAIC are calculated as follows:
 \begin{align}\nonumber \text{AIC} &= -2 \ln L \left(\hat{\theta} \mid \textbf{t}, \textbf{x}, \textbf{a}, \textbf{d}, \textbf{z}^{\textbf{A}}, \textbf{z}^{\textbf{M}} \right) + 2 r &&\\[5pt] \nonumber \text{WAIC} &= -2\displaystyle\sum_{i=1}^n \ln \left(\frac{1}{H} \displaystyle\sum_{\ell=1}^H f \left(t_{i,1}, t_{i,2} \mid x_{i,1},x_{i,2}, z^A_i, z^M_i, a_i,d_{i,1},d_{i,2};\;\theta^{(\ell)} \right) \right) + 2 p_{\text{WAIC}} &&\\[5pt] \nonumber p_{\text{WAIC}} &= 2 \displaystyle\sum_{i=1}^n \Bigg[ \ln \left(\frac{1}{H} \displaystyle\sum_{\ell=1}^H f \left(t_{i,1}, t_{i,2} \mid x_{i,1},x_{i,2}, z^A_i, z^M_i, a_i,d_{i,1},d_{i,2};\;\theta^{(\ell)} \right) \right) &&\\[5pt] \nonumber & \quad - \frac{1}{H} \displaystyle\sum_{\ell=1}^H \ln f \left(t_{i,1}, t_{i,2} \mid x_{i,1},x_{i,2}, z^A_i, z^M_i, a_i,d_{i,1},d_{i,2};\;\theta^{(\ell)} \right) \Bigg]\end{align}
where
 $L \left(\hat{\theta} \mid \textbf{t}, \textbf{x}, \textbf{a}, \textbf{d}, \textbf{z}^{\textbf{A}}, \textbf{z}^{\textbf{M}} \right)$
is the likelihood function of the parameters given the data, r denotes the number of parameters of the model under analysis, H is the number of retained draws from the posterior distribution, and
 \begin{align} & f \left(t_{i,1}, t_{i,2} \mid x_{i,1},x_{i,2}, z^A_i, z^M_i, a_i,d_{i,1},d_{i,2};\;\theta^{(\ell)} \right) \\\nonumber &= \frac{ \displaystyle\sum_{k=1}^K \pi_k^{(\ell)} \Bigg[ \displaystyle\prod_{j=1}^2 f \left(t_{i,j} \mid x_{i,j},d_{i,j},a_{i};\;\alpha_j^{(\ell)},\beta_j^{(\ell)},\gamma^{*(\ell)}_{k,j} \right) \Bigg] f \left(z_i \mid \zeta^{*(\ell)}_k\right)}{\displaystyle\sum_{k=1}^K \pi_k^{(\ell)} f \left(z_i \mid \zeta^{*(\ell)}_k \right)}.\end{align}
In this equation, we take the joint distribution of
 $T_{i,1}$
and
 $T_{i,2}$
conditional to the values of
 $Z^A_i$
and
 $Z^M_i$
, in order to make the three models comparable among them.
When computing the WAIC by gender for the males, we compute:
 \begin{align} & f \left(t_{i,1} \mid t_{i,2}, x_{i,1},x_{i,2}, z^A_i, z^M_i, a_i,d_{i,1},d_{i,2};\;\theta^{(\ell)} \right) \\[5pt]\nonumber &= \frac{ \displaystyle\sum_{k=1}^K \pi_k^{(\ell)} \Bigg[ \displaystyle\prod_{j=1}^2 f \left(t_{i,j} \mid x_{i,j},d_{i,j},a_{i};\;\alpha_j^{(\ell)},\beta_j^{(\ell)},\gamma^{*(\ell)}_{k,j} \right) \Bigg] f \left(z_i \mid \zeta^{*(\ell)}_k\right)}{\displaystyle\sum_{k=1}^K \pi_k^{(\ell)} f \left(t_{i,2} \mid x_{i,2},d_{i,2},a_{i};\;\alpha_2^{(\ell)},\beta_2^{(\ell)},\gamma^{*(\ell)}_{k,2} \right) f \left(z_i \mid \zeta^{*(\ell)}_k \right)}.\end{align}
Similar calculations are performed for the WAIC of the AVDPM for the females.